
Sample Category Title
GBP/JPY Weekly Outlook
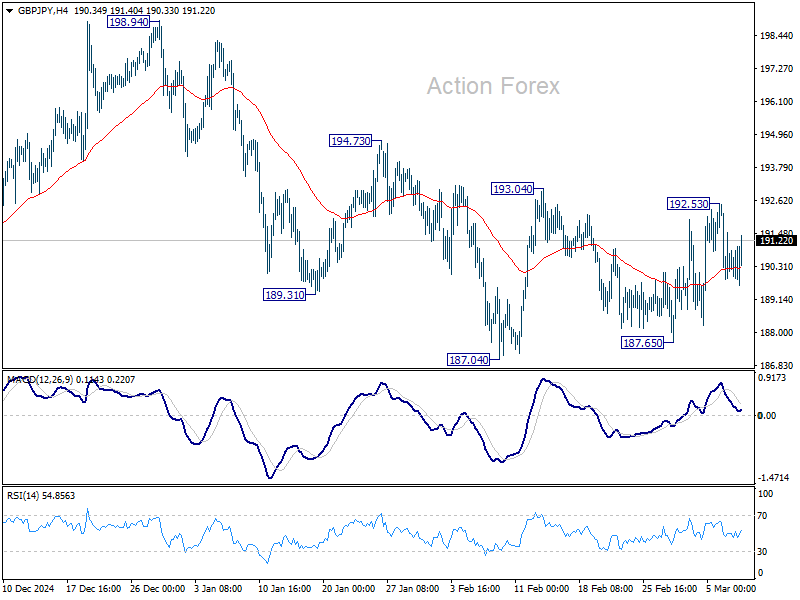
Range trading continued in GBP/JPY last week and outlook is unchanged. Initial bias remains neutral this week first. On the upside, firm break of 193.04 will resume the rebound from 187.04 to 194.73 resistance, and then 198.94. On the downside, firm break of 187.04 will extend the fall from 199.79 towards 180.00 support. Overall, corrective pattern from 180.00 might still be extending.
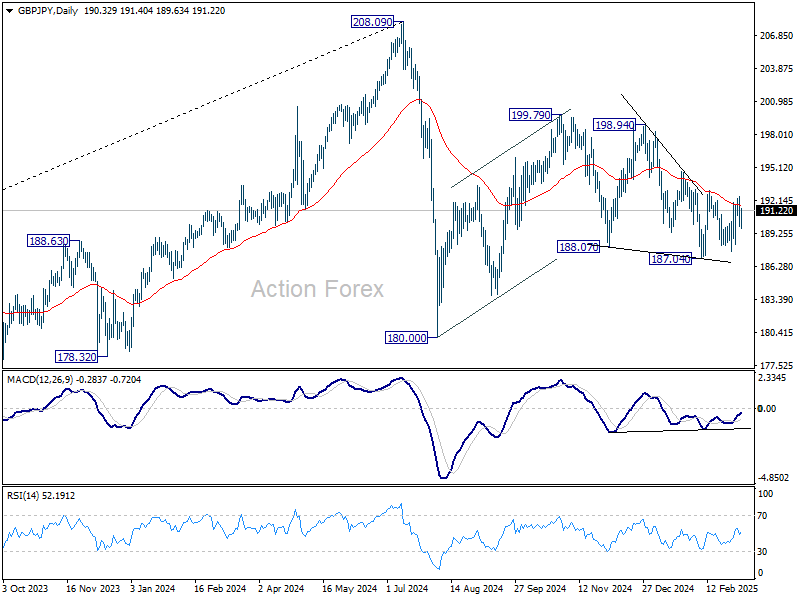
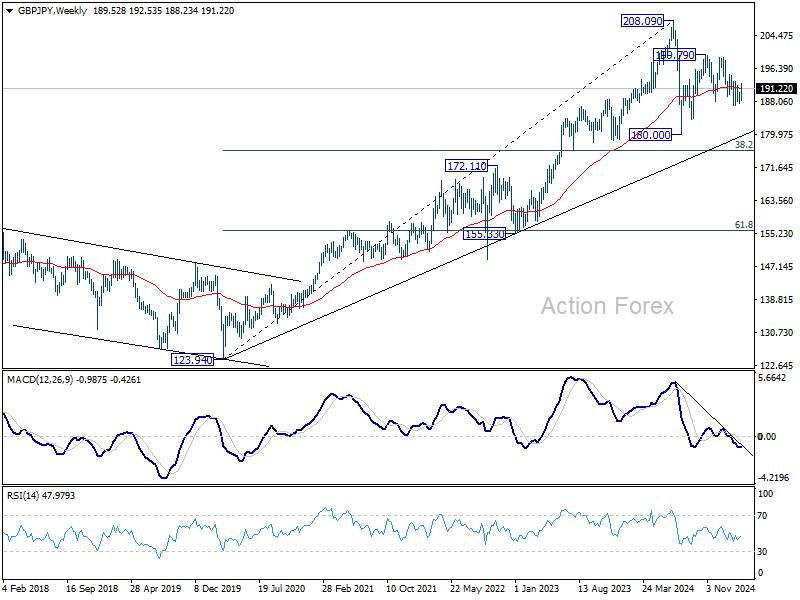
In the bigger picture, price actions from 208.09 are seen as a correction to rally from 123.94 (2020 low). Strong support should be seen from 38.2% retracement of 123.94 to 208.09 at 175.94 to contain downside. However, sustained break of 152.11 will bring deeper fall even still as a correction.
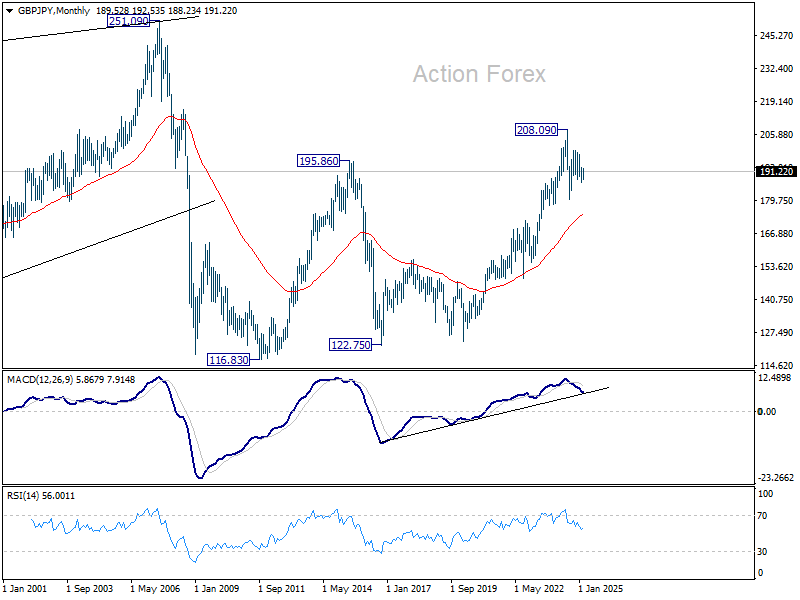
In the longer term picture, while a medium term top was formed at 208.09 (2024 high), it's still early to conclude that the up trend from 122.75 (2016 low) has completed. But GBP/JPY is at least in a medium term corrective phase, with risk of correction to 55 M EMA (now at 173.92).
EUR/JPY Weekly Outlook
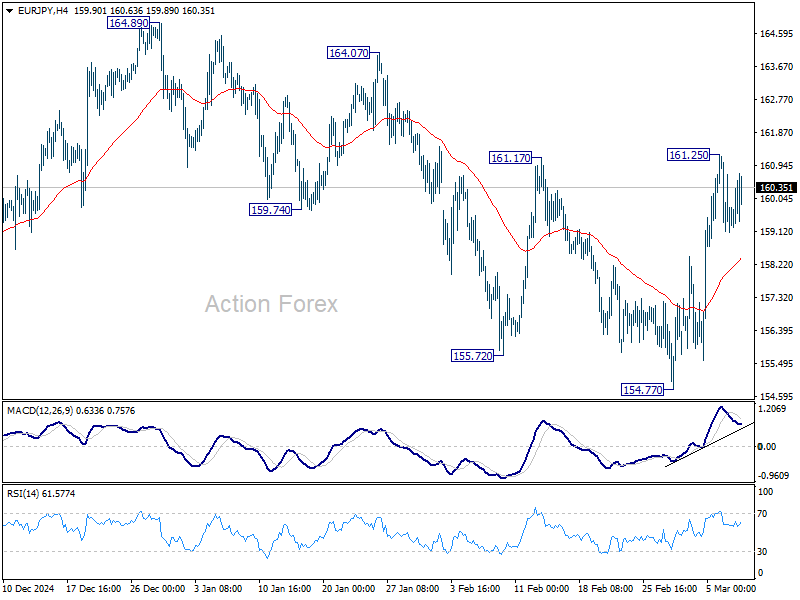
EUR/JPY rebounded to as high as 161.25 last week but turned sideway since then. Initial bias remains neutral this week. Overall development suggest that consolidation pattern from 154.40 is extending with another rising leg. On the upside, break of 161.25 will target 164.89 resistance.
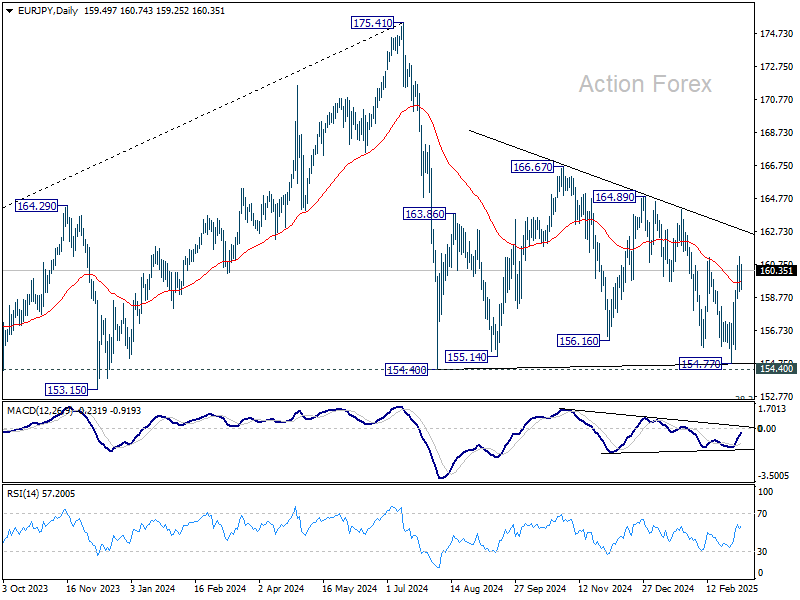
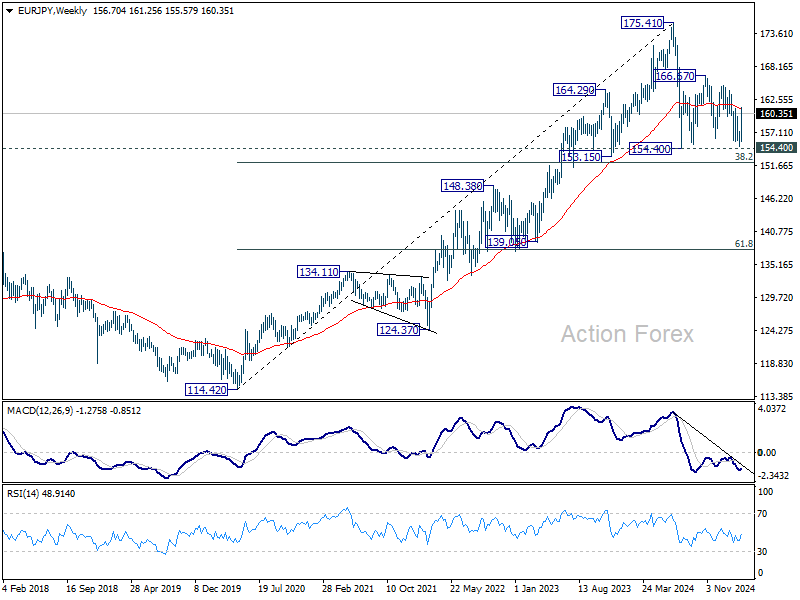
In the bigger picture, price actions from 175.41 are seen as correction to rally from 114.42 (2020 low). Strong support should be seen from 38.2% retracement of 114.42 to 175.41 at 152.11 to contain downside. However, sustained break of 152.11 will bring deeper fall even still as a correction.
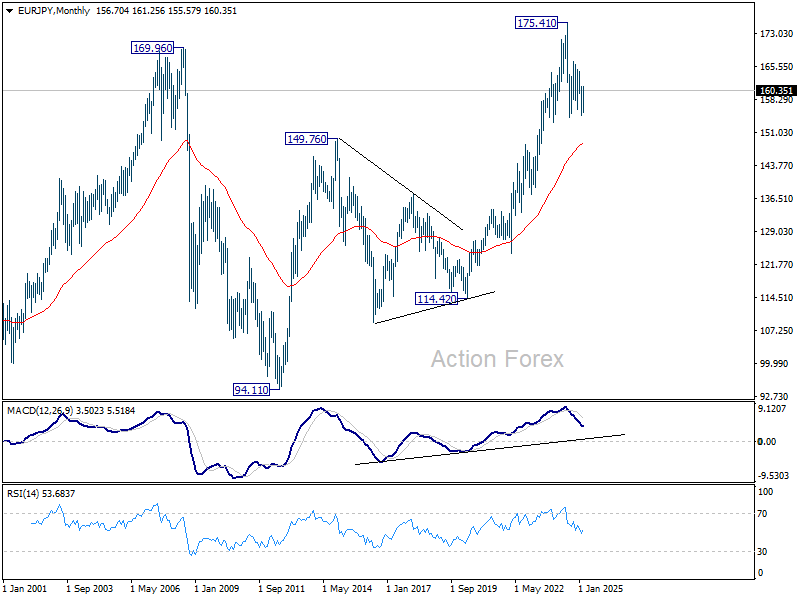
In the long term picture, while 175.41 is at least a medium term top, it's still early to conclude that up trend from 94.11 (2012 low) has completed. A medium term corrective phase is in progress with risk of deeper fall back to 55 M EMA (now at 148.45).
EUR/GBP Weekly Outlook
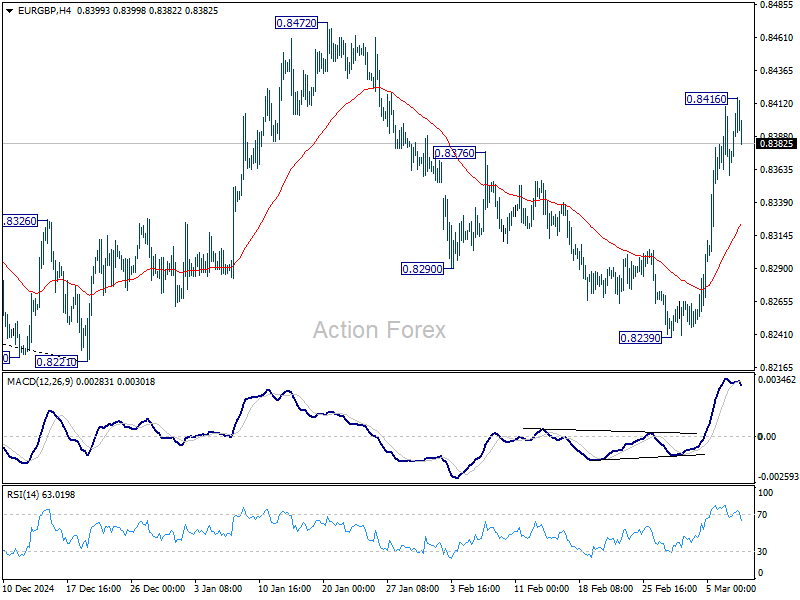
EUR/GBP's strong rally last week suggest that fall from 0.8472 has completed as a corrective three-wave move down to 0.8239. However, the cross lost momentum after final push to 0.8416. Initial bias is neutral this week for consolidations. Downside should be contained above 55 4H EMA (now at 0.8323) to bring another rise. Break of 0.8416 temporary top will target 0.8472 resistance next.
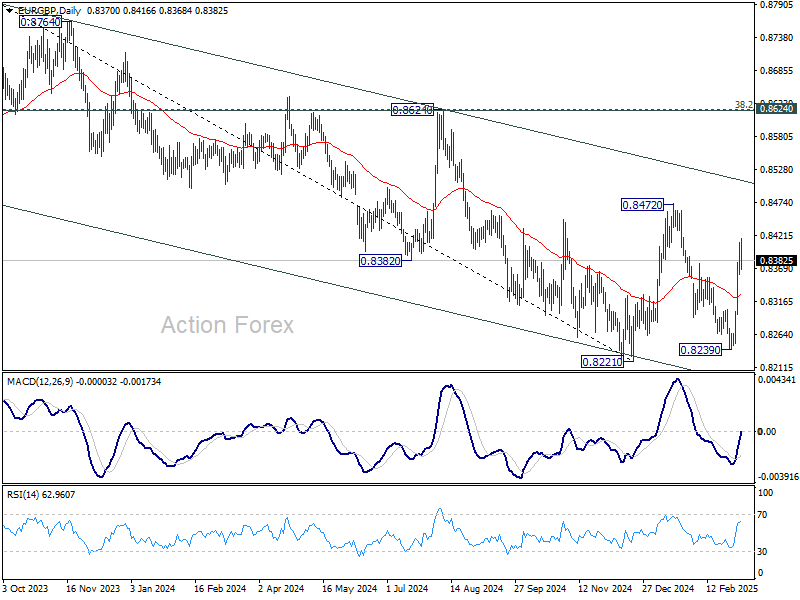
In the bigger picture, EUR/GBP is still bounded inside medium term falling channel. While rebound from 0.8221 might extend higher, it could still develop into a corrective pattern. Overall outlook will be neutral at best and down trend from 0.9267 (2022 high) could extend, at least until decisive break of channel resistance (now at 0.8511).
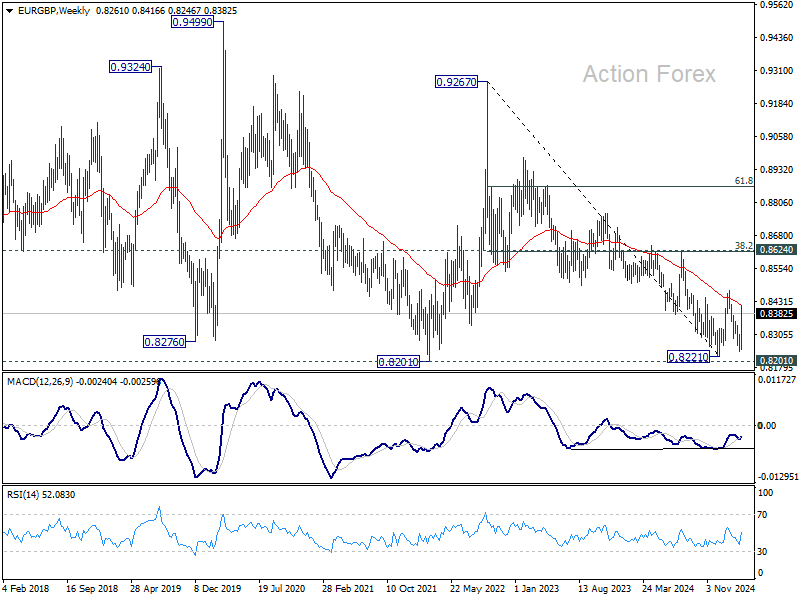
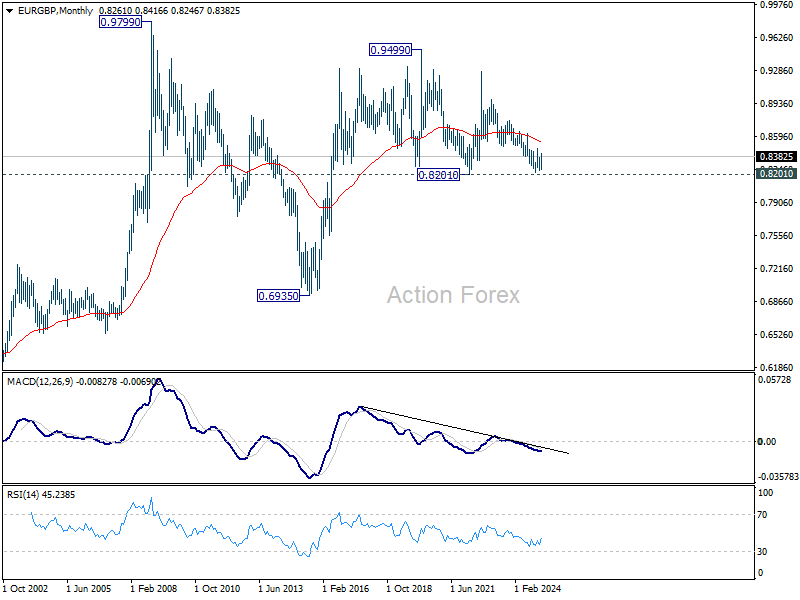
In the long term picture, price action from 0.9499 (2020 high) is seen as part of the long term range pattern from 0.9799 (2008 high). Range trading should continue between 0.8201 and 0.9499, until there is clear signal of imminent breakout.
EUR/AUD Weekly Outlook
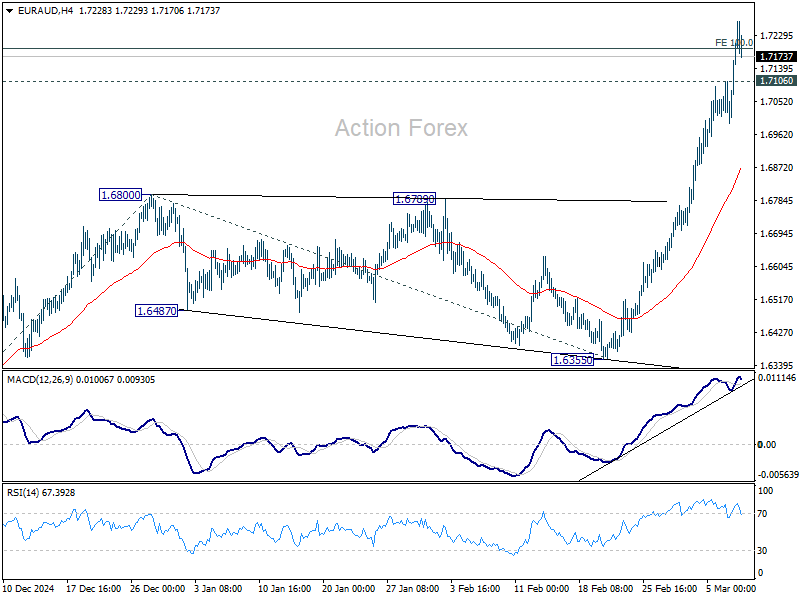
EUR/AUD's rally from 1.5693 resumed last week and accelerated to as high as 1.7268. There is no clear sign of topping yet and initial bias stays on the upside this week. Sustained trading above of 100% projection of 1.5963 to 1.6800 from 1.6355 at 1.7192 will target 161.8% projection at 1.7709 next. On the downside, below 1.7016 minor support will turn intraday bias neutral and bring consolidations first.
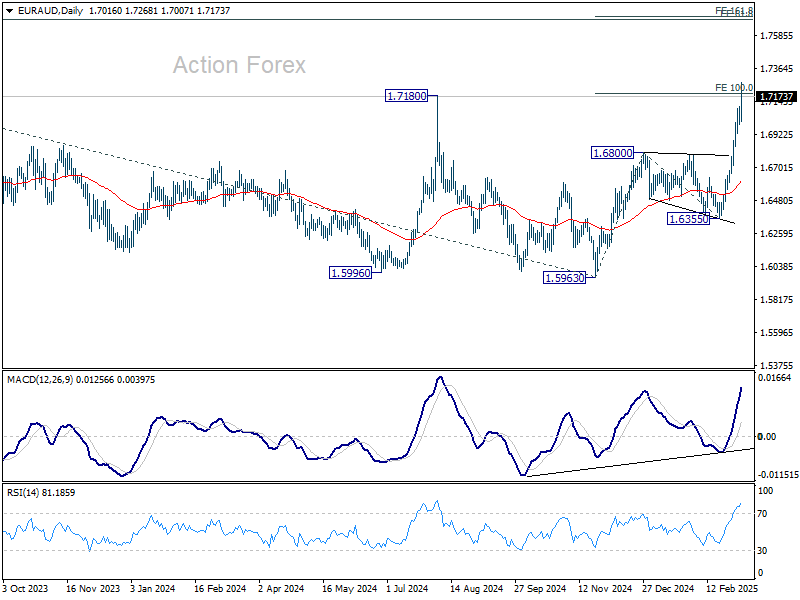
In the bigger picture, the breach of 1.7180 key resistance (2024 high) suggests that up trend from 1.4281 (2022 low) is resuming. Sustained trading above 1.7180 will confirm and target 61.8% projection of 1.4281 to 1.7062 from 1.5963 at 1.7682, which is also close to 61.8% retracement of 1.9799 (2020 high) to 1.4281 at 1.7691. For now, this will remain the favored case as long as 1.6355 support holds, even in case of deep pullback.
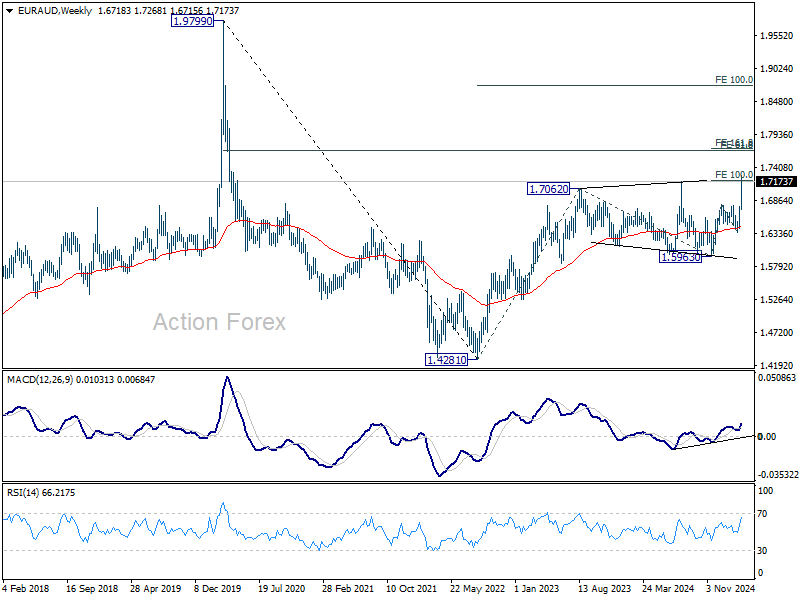
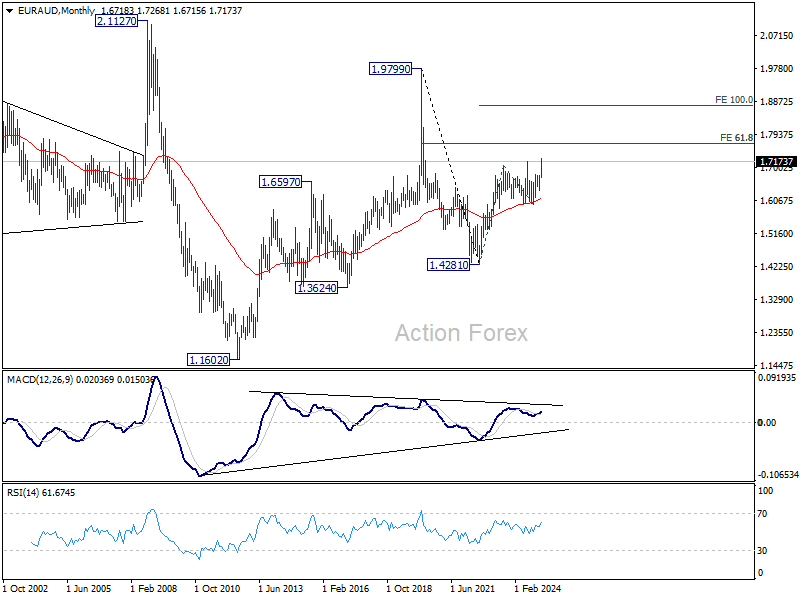
In the longer term picture, rise from 1.4281 is seen as the second leg of the pattern from 1.9799 (2020 high), which is part of the pattern from 2.1127 (2008 high). As long as 55 M EMA (now at 1.6090) holds, this second leg could still extend higher. However, sustained trading below 55 M EMA will open up the bearish case for extending the decline through 1.4281 low.
EUR/CHF Weekly Outlook
EUR/CHF surged to as high as 0.9634 last week but faced strong resistance from long term falling channel and retreated. Initial bias stays neutral this week first and some more consolidations could be seen. Further rally will be expected as long as 55 4H EMA (now at 0.9467) holds. On the upside, above 0.9634, and sustained trading above 0.9651 fibonacci level will pave the way back to 0.9928 key resistance next.
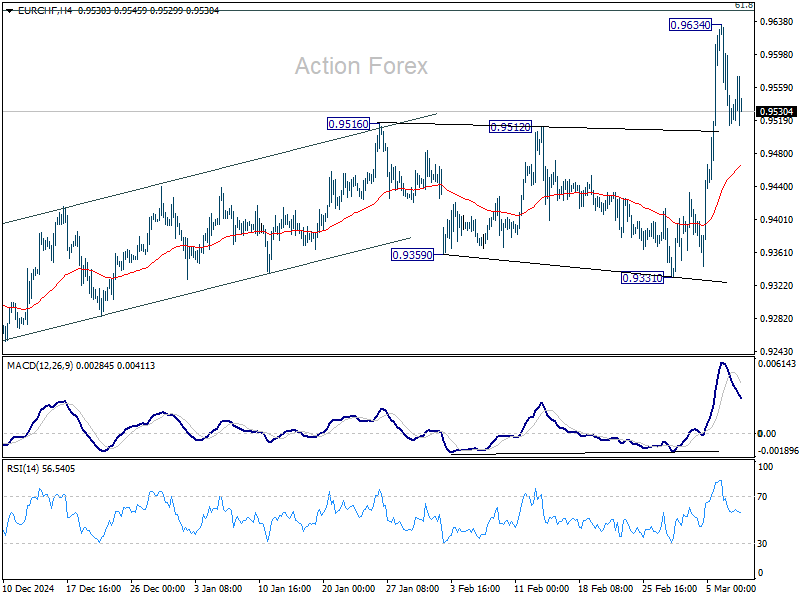
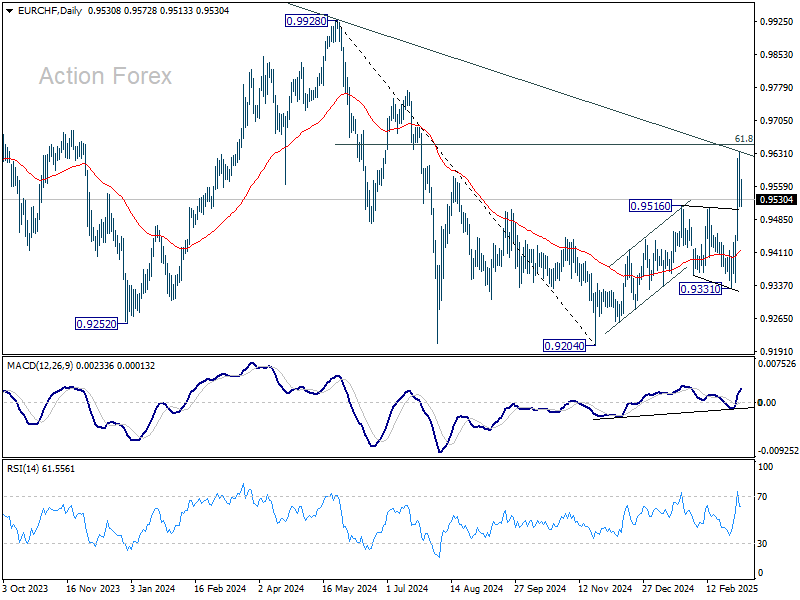
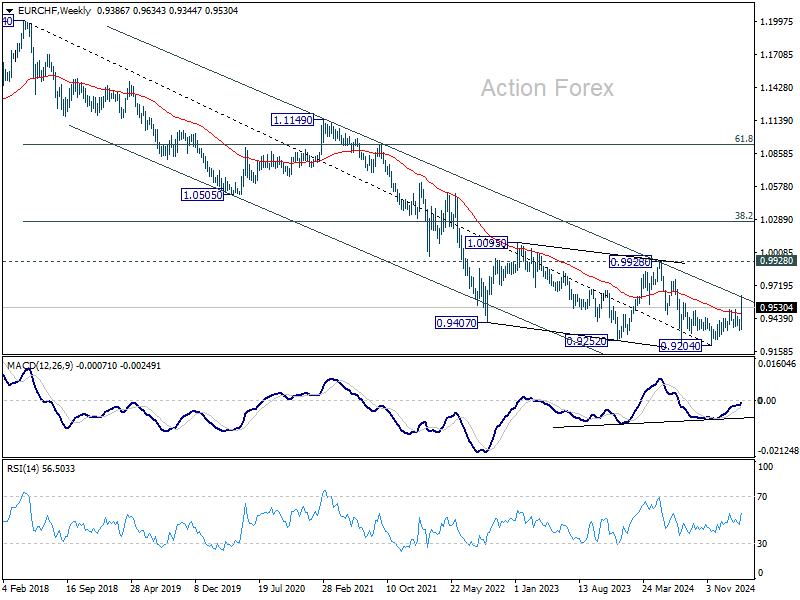
In the bigger picture, the strong break of 55 W EMA (now at 0.9482) is a medium term bullish sign. Sustained break trading above long-term falling channel resistance (at around 0.9620) would suggest that the downtrend from 1.2004 (2018 high) has bottomed at 0.9204. Stronger rally should then be see to 0.9928 key resistance at least.
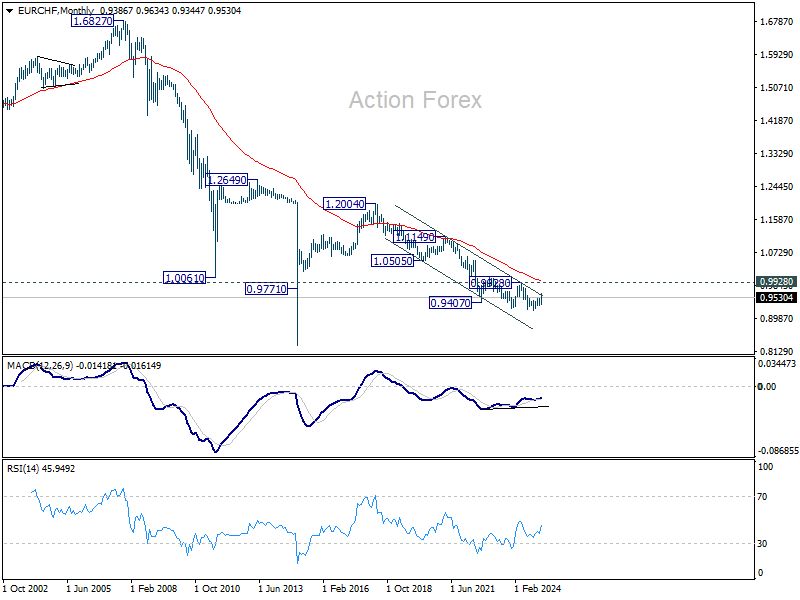
In the long term picture, bullish signs are emerging. However, the important hurdle at 0.9928 resistance, which is close to 55 M EMA (now at 0.9960), is needed to be taken out decisively before considering long term trend reversal. Otherwise, outlook is neutral at best.
A Multi-Decade Trend Reversal Underway in EUR/USD?
The sharp contrast between Europe’s newfound unity and the ongoing tariff chaos in the US has been a defining theme in the financial markets. Euro’s extraordinary strength last week reflected growing investor confidence in the region’s strategic shift toward fiscal expansion and defense spending. From the formation of the "Coalition of the Willing" to the ReArm Europe initiative, they highlighted a strong, coordinated response to challenges, be it geopolitical or economic. That could set the stage for a long-term structural shift in European markets.
Meanwhile, the US continued to grapple with trade policy uncertainty, with tariffs now more seen as a drag on sentiment and economic growth rather than a source of inflationary pressure. The recent exemptions granted to Canada and Mexico only reinforced the perception of inconsistency in Washington’s trade strategy. The lack of clarity on future policy moves has started to weigh on investor sentiment. That, if persists, could lead to a outflow of capital from the US and weakening the Dollar further.
From a technical points of view, EUR/USD has shown clear signs of a potential long-term bullish reversal. The pair’s strong surge last week suggests that the multi-year downtrend may have bottomed out, with further upside potential if Europe successfully executes its ambitious fiscal and defense spending plans. However, challenges remain, including implementation risks and the broader impact of trade tensions on European exports.
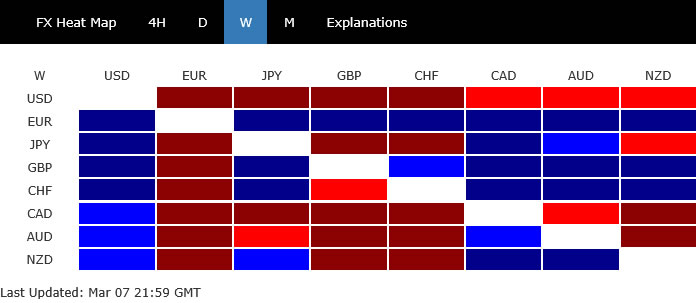
Currency market performance last week reflected the shifting sentiment. Euro ended as the strongest performer, followed by Sterling and Swiss Franc, which also benefited from Europe’s renewed economic confidence.
On the other hand, Dollar closed as the worst performer, struggling under the weight of investor skepticism and diminishing safe-haven appeal. Elsewhere, Canadian Dollar and Australian Dollar also underperformed, indicating that risk-off sentiment remains present, particularly in the US. Yen and Kiwi positioned themselves in the middle of the performance spectrum.
Europe’s Bold Shift Ignites Market Optimism
Last week brought a seismic shift in Europe's geopolitical, defense, and fiscal policies. In a move not seen in decades, the region is asserting greater strategic independence while ramping up economic stimulus. The changes were embraced by investors with enthusiasm, fueling rallies in European assets, particularly in Euro and German equities.
Euro surged 4.4% against Dollar, its best weekly performance since 2009. Meanwhile, Germany’s 10-year yield posted its biggest jump since the fall of the Berlin Wall. DAX hit fresh record highs, with cyclical and defense-related stocks leading the charge.
At the heart of this shift is the “ReArm Europe” initiative, which commits the EU to a significant defense buildup. European Commission President Ursula von der Leyen has proposed mechanisms to mobilize up to EUR 800B in special funds. This landmark decision not only strengthens military readiness, but also reduces reliance on external allies.
Further reinforcing this new direction, EU leaders took a bold stand against Hungarian Prime Minister Viktor Orbán, overriding his veto on aid to Ukraine. In an unusual move, member states issued a separate statement reaffirming their unified support for Kyiv.
Meanwhile, in Germany, despite ongoing coalition talks, CDU leader Friedrich Merz wasted no time aligning with the SPD to push for loosening of the "debt brake", which would unlock EUR 500B for infrastructure projects. Additionally, defense spending above 1% of GDP will be permanently exempt from fiscal constraints. Over the next decade, these measures could increase government spending by a staggering 20% of GDP. The scale surpasses even that seen after German reunification in the 1990s.
This massive fiscal shift in Germany carries significant upside potential for both domestic and Eurozone growth. With a sharp boost in public spending, it could also act as a buffer against potential US tariffs. For years, European growth has been held back by fiscal conservatism—but now, these bold new policies could reshape the region’s economic future for years to come.
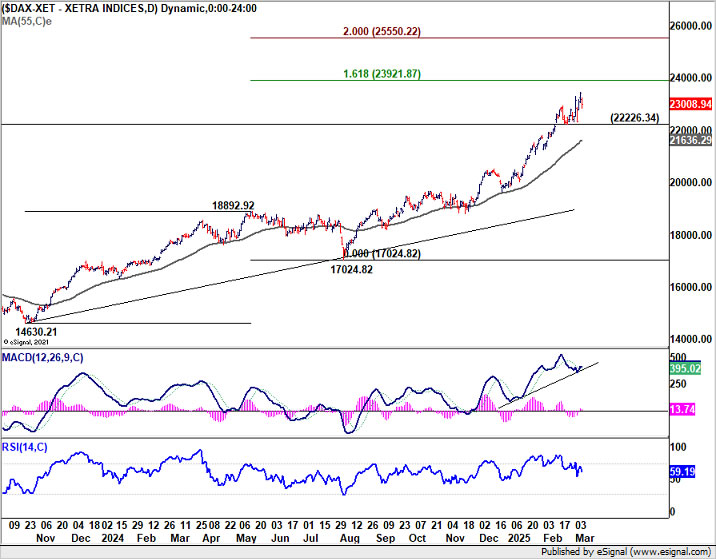
Technically, DAX might be rebuilding upside momentum as seen in D MACD. Current up trend should head to take on 161.8% projection of 14630.21 to 18892.92 from 17024.82 at 23921.87. Decisive break there would target 200% projection at 25550.22 next. Nevertheless, firm break of 22226.34 support will suggest DAX has topped for the near term at least, and consolidations should follow first.
Is Euro Entering a Long-Term Bull Cycle?
As Europe embarks on a new era of fiscal expansion and policy coordination, Euro's looks well-positioned for a prolonged rally and with prospects of long term bullish trend reversal.
Another key factor supporting Euro is the growing belief that ECB is nearing a pause in its policy easing cycle. With monetary policy now "meaningfully less restrictive", as described by President Christine Lagarde, a pause could start as soon as in April. ECB could opt for a wait-and-see approach, to assess how trade policy, fiscal initiatives, and broader geopolitical risks play out.
However, key risks remain, including escalation in trade disputes with the US, as well as how effectively Europe executes its ambitious spending plans. The coming months will be crucial in determining whether this historic shift translates into sustained economic momentum or if internal and external headwinds slow down the Euro’s resurgence.
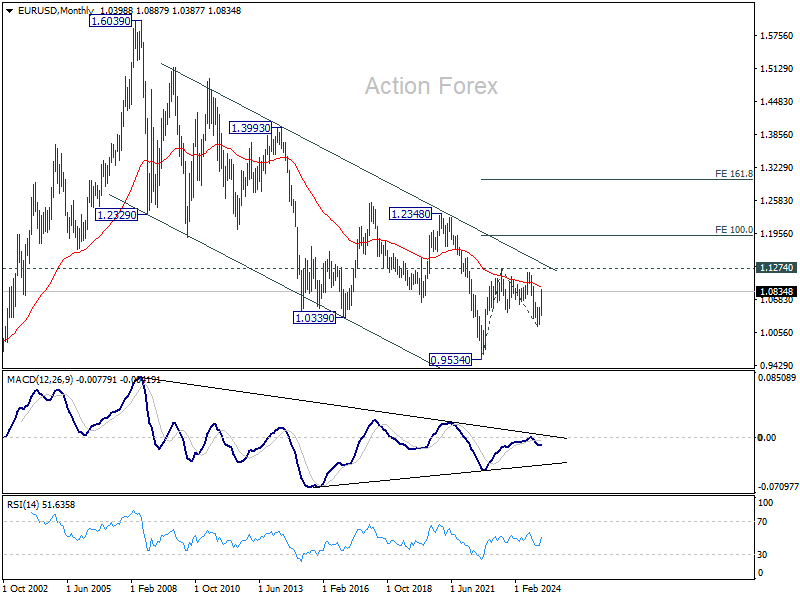
Technically, EUR/USD's strong rally suggests that fall from 1.1274 (2023 high) has completed as a correction, with three waves down to 1.0176. Firm break of 1.1274 would resume larger rally from 0.9534 (2022 low), to 100% projection of 0.9534 to 1.1274 from 1.0176 at 1.1916.
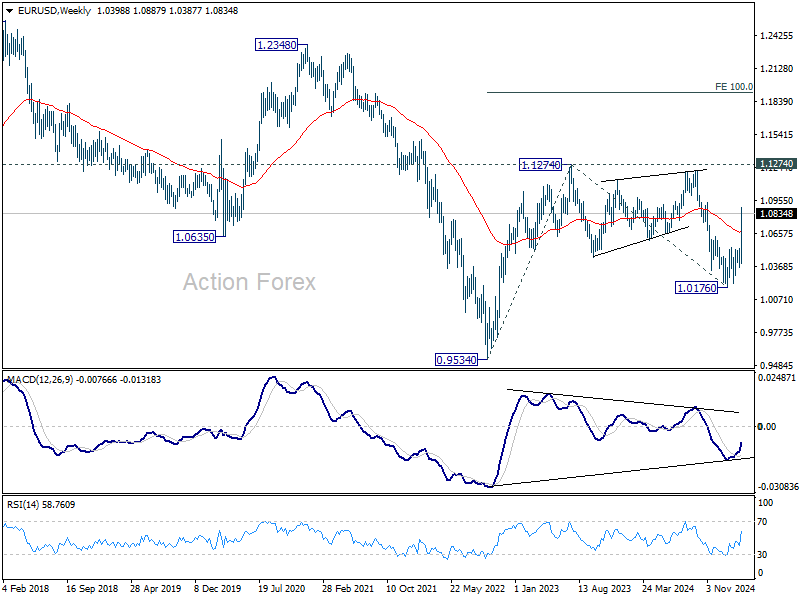
More significantly, if the bullish case is realized, that would push EUR/USD through the two-decade falling channel resistance, which could be an important sign of long term trend reversal.
US Stocks at Risk of Bearish Trend Reversal Amid Tariff Chaos
US stocks endured a turbulent week as investors wrestled with the unpredictable nature of President Donald Trump's trade policies. The volatility has taken a clear toll on market sentiment, with technical indicators increasingly pointing to bearish trend reversal in major indexes. The coming weeks could prove decisive in determining whether the strong uptrend that has defined the past few months has reversed or if equities can regain their footing.
S&P 500 logged its worst week since September, falling -3.1%, while DOW dropped -2.4%. NASDAQ was hit hardest, tumbling -3.5%.
The implementation of 25% tariffs on Canadian and Mexican imports on March 4, had initially sent markets into a tailspin. However, Trump’s decision on Thursday to pause tariffs on USMCA-covered goods for another month only added to the confusion, as investors struggled to decipher the long-term direction of trade policy.
This chaotic cycle of tariff imposition followed by temporary reversals has created an uncertain and fragile investment environment. Businesses remain hesitant to make forward-looking decisions, while consumer confidence is showing signs of strain. The erratic nature of US trade policy has left markets with little clarity, and the risk of further deterioration in sentiment remains high.
Nevertheless, Friday’s non-farm payroll report provided some relief, as job growth remained near its recent average, unemployment stayed within its recent range, and wage growth held robust. The data suggested that, at least for now, the feared economic fallout from tariffs has not yet materialized in a meaningful way. However, lingering uncertainty around trade and global economic conditions continues to weigh on sentiment.
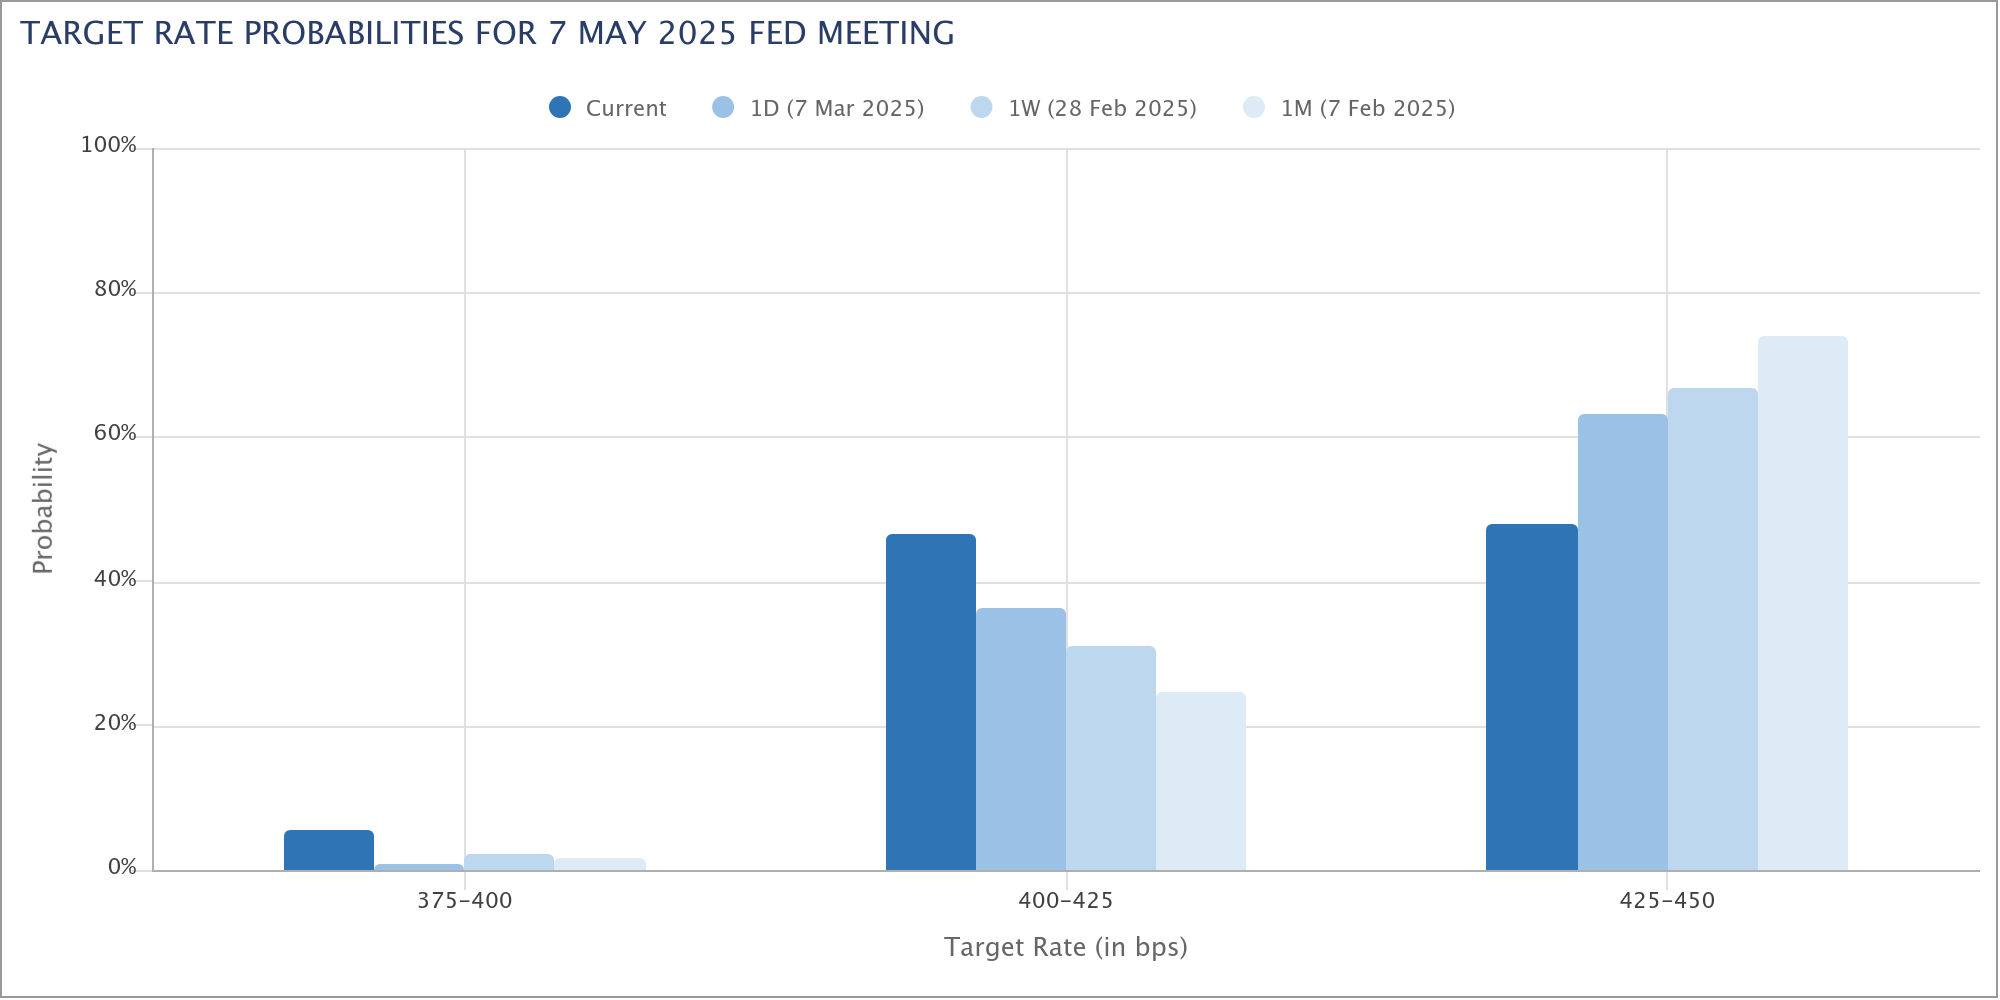
Meanwhile, Fed Chair Jerome Powell reiterated on Friday that the central bank is in no rush to cut rates, stating that the Fed is “well-positioned to wait for clarity.” Powell’s cautious stance contrasts with growing market expectations for rate cuts, as investors bet on economic weakness forcing the Fed’s hand.
While a hold in March remains the base case, with 88% odds, Fed fund futures now price in a 52% probability of a 25bps rate cut in May, up sharply from 33% a week ago and 26% a month ago. This suggests that investors are bracing for the possibility of further economic softening, with Fed being forced to act sooner than its current guidance suggests.
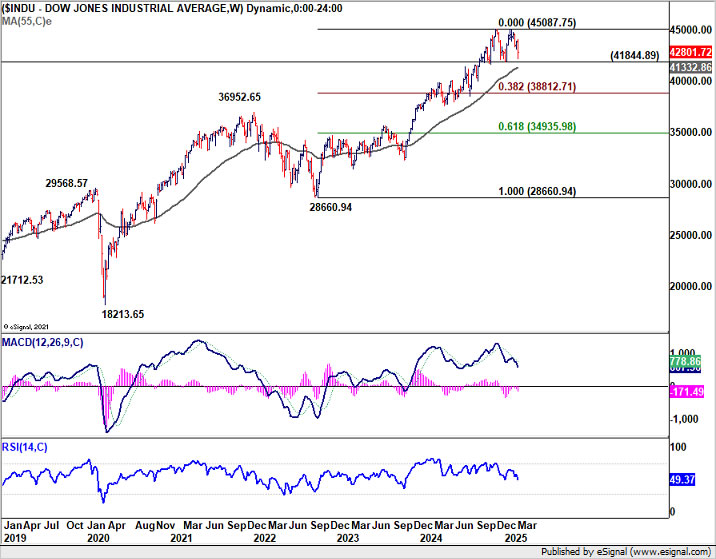
Technically, DOW's up trend should still be intact as long as 41844.89 support holds. However, firm break there will argues that it's already in correction to the up trend from 28660.93 (2022 low). Sustained trading below 55 W EMA (now at 41332.86) will further solidify this bearish case. Next target will be 38.2% retracement of 28660.94 to 45087.75 at 38812.71.
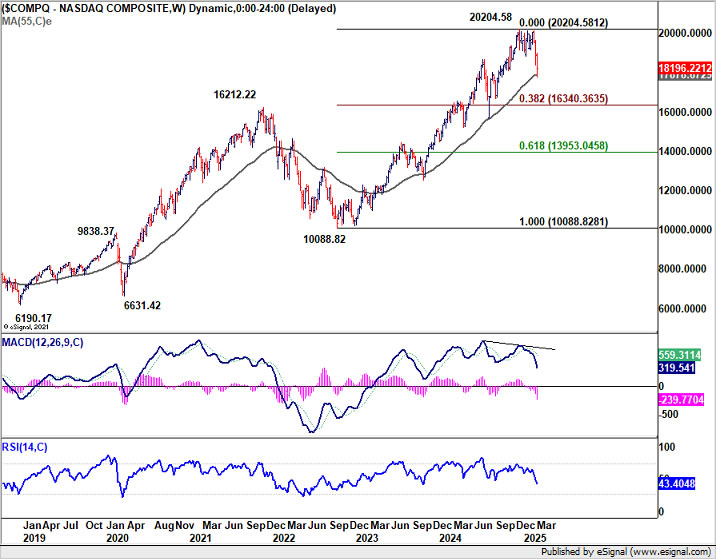
As for NASDAQ, it's now pressing 55 W EMA (at 17878.67). Sustained break there will also indicate that it's already correcting the up trend from 10088.82 (2022 low). Next target is 38.2% retracement of 10088.82 to 20204.58 at 16340.36.
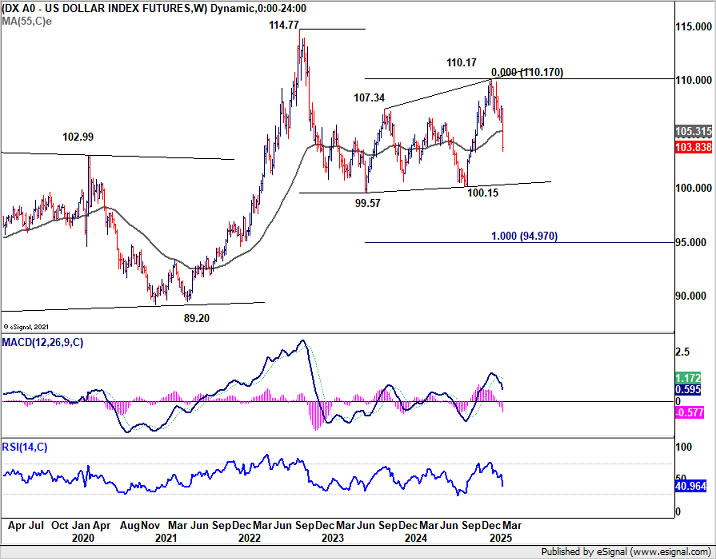
As for Dollar Index, last week's steep decline and strong break of 55 W EMA (now at 105.31) argues that corrective pattern from 99.57 (2023 low) has completed with three waves up to 110.17. Near term risk will now stay on the downside as long as 55 D EMA (now at 106.91) holds. Further downside acceleration will raise the chance that Dollar Index is indeed resuming the whole down trend from 114.77 (2022 high) .
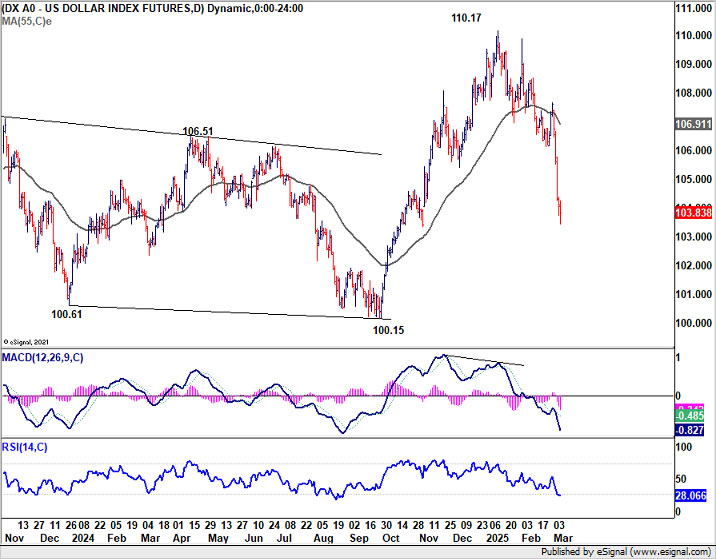
While it's still too early to confirm the bearish case, firm break of 100.15 support could set up further medium term fall to 100% projection of 114.77 to 99.57 from 110.17 at 94.97.
The challenge for Dollar is that risk aversion no longer seems to be offering support. Tariffs are providing little help unlike what it did this year. Meanwhile, Fed appears poised to resume rate cuts sooner than expected. With these factors in play, it's unclear what could drive a rebound for the greenback, other then implosion of Euro and other currencies
EUR/CHF Weekly Outlook
EUR/CHF surged to as high as 0.9634 last week but faced strong resistance from long term falling channel and retreated. Initial bias stays neutral this week first and some more consolidations could be seen. Further rally will be expected as long as 55 4H EMA (now at 0.9467) holds. On the upside, above 0.9634, and sustained trading above 0.9651 fibonacci level will pave the way back to 0.9928 key resistance next.
In the bigger picture, the strong break of 55 W EMA (now at 0.9482) is a medium term bullish sign. Sustained break trading above long-term falling channel resistance (at around 0.9620) would suggest that the downtrend from 1.2004 (2018 high) has bottomed at 0.9204. Stronger rally should then be see to 0.9928 key resistance at least.
In the long term picture, bullish signs are emerging. However, the important hurdle at 0.9928 resistance, which is close to 55 M EMA (now at 0.9960), is needed to be taken out decisively before considering long term trend reversal. Otherwise, outlook is neutral at best.
February CPI Preview: The Tariff Winds Start to Blow
Summary
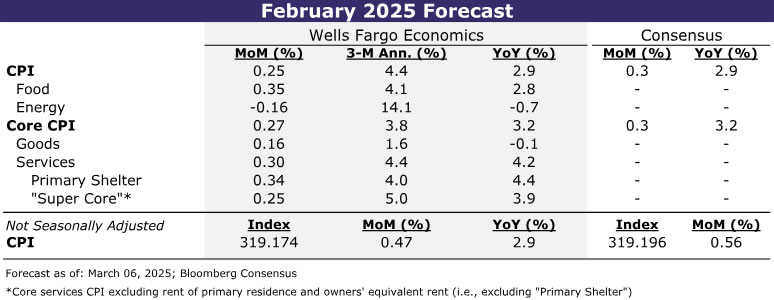
Consumer price inflation came out of the gate strong in 2025, but price growth looks to have cooled somewhat in February. We estimate headline CPI rose 0.25% and the core index advanced 0.27%. The moderation in the core index is likely to reflect some giveback in a handful of categories that soared in January (e.g., prescription drugs, used cars, motor vehicle insurance and recreation services) and lead to softer monthly prints for both core goods and services. However, we believe growing concerns over tariffs are already affecting pricing decisions and will help to keep the pace of consumer price inflation firm overall.
Despite Moderation in February, CPI Inflation to Remain Firm
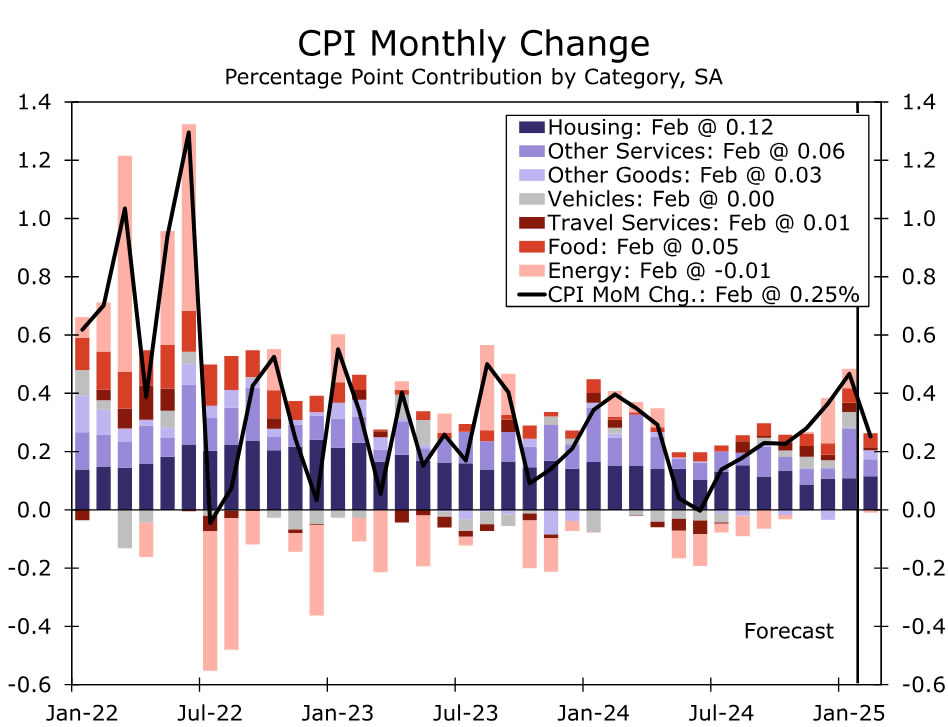
The January CPI report carried echoes of 2024 with the first key inflation read of the year coming in hot. Unlike last year, however, we expect it to be followed up by a more temperate gain in February. Headline CPI likely increased by about 0.25% in February, or roughly half the size of last month's advance. Gasoline prices rose less than usual last month, signaling a decline in energy goods prices on a seasonally-adjusted basis. That should help keep the overall contribution from energy slightly negative despite a pickup in energy services costs from the recent strength in natural gas prices (Figure 1).
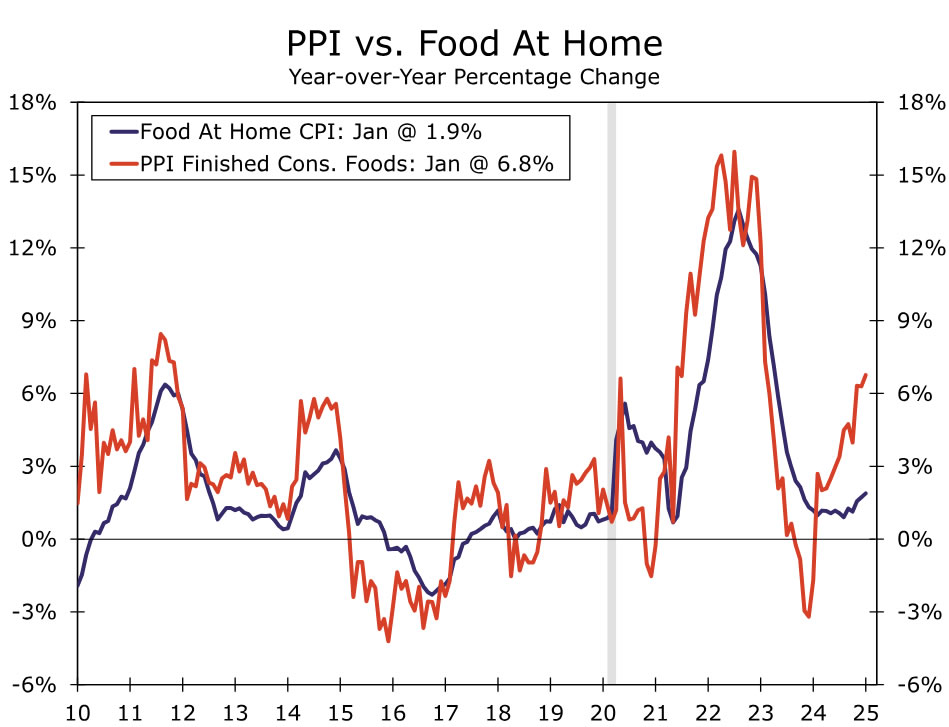
The firmer trend in food inflation that began last fall likely continued in February. We look for a 0.3% rise in food prices, which would push the three-month annualized rate up to 4.1%—the strongest clip in two years. Grocery prices look poised for another solid increase (0.4%) following the jump in producer prices for consumer foods last month and weekly data from the USDA suggesting relief on egg prices has yet to arrive (Figure 2). Slower growth in average hourly earnings for restaurant workers continues to offer some relief to food away from home, but the rebound in food-related commodity costs and the lapping of a low base comparison last February points to the cost of dining out picking up on a year-ago basis.
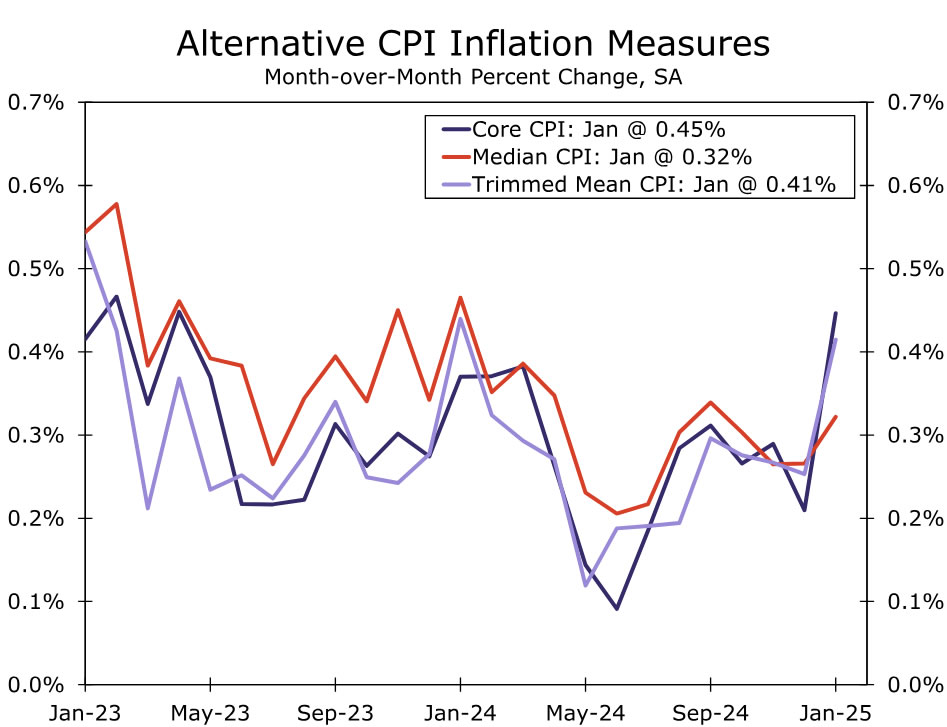
Excluding food and energy, we estimate CPI inflation cooled in February with a 0.3% gain (0.27% unrounded). Whereas January 2024's upside surprise was broadly based, strength at the start of this year was more narrowly driven and suggests price pressures are not quite as persistent as first meets the eye. Specifically, the core CPI's rise of 0.45% exceeded the median CPI increase (0.32%) and trimmed mean CPI increase (0.41%)—a reversal from what played out last year when January's strength was followed in February and March (Figure 3).
When looking across the core, we see a number of categories ripe for reversion toward their recent trend. Among them are prescription drugs after the largest monthly gain on record in January (2.5%). On the services side, we see scope for slowing in motor vehicle insurance, whose 2.0% jump in January looks elevated versus industry rate data, and in recreation services and motor vehicles fees, where prices in each saw their largest monthly increases in at least four years.
The anticipated giveback in these categories should lead to a slowing in non-housing services inflation both on a monthly (0.3%) and annual basis (3.9%). We have penciled in a slight pickup in primary shelter costs in February, however. While any impact of the LA wildfires is likely to be a choppy and drawn out affair, February marks the first month in which rents may be affected (see the Topic of the Week section of our January 24 Weekly for more detail). All told, we expect core services to advance 0.3%, which would nudge the year-over-year rate down to a three-year low of 4.2%.
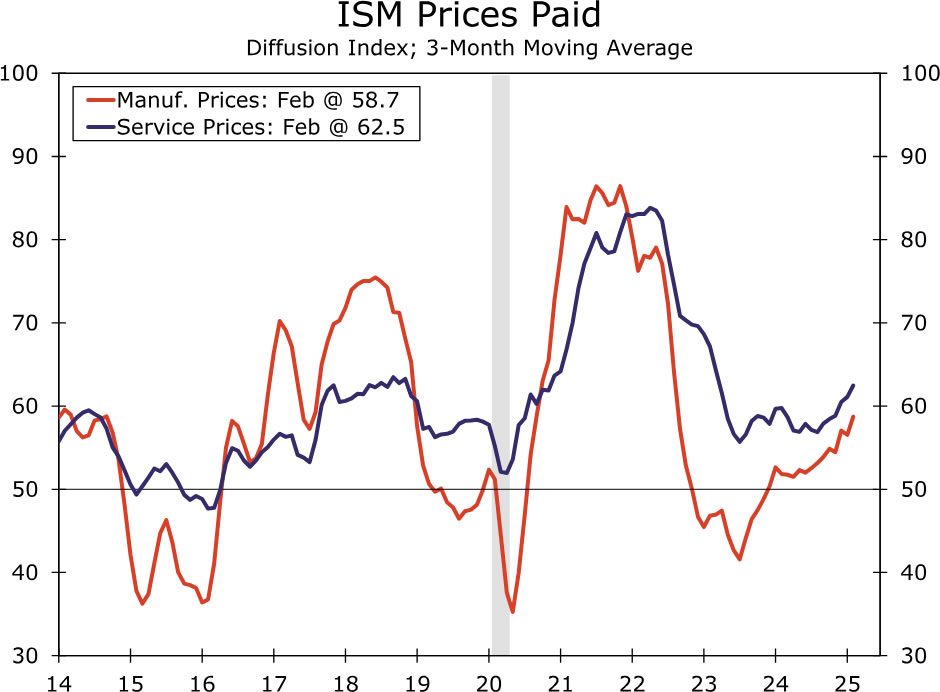
Core goods inflation is likely to have slowed slightly in February with a 0.2% monthly increase. In addition to the anticipated payback for prescription drugs, wholesale auction prices for used cars point to the CPI used vehicle index moving back down in the near term. But elsewhere, we expect the uptrend in goods prices to continue. Goods prices have historically risen the most during the first two months of the year, leaving the potential for residual seasonality in the data to boost February prices on seasonally-adjusted basis. And unlike the tariffs under the first Trump administration, the additional 10% tariffs on Chinese imports implemented at the start of the month included all consumer goods. Furthermore, while even larger tariffs on Canada and Mexico were postponed, the saber-rattling may have been enough to change some firms' pricing decisions already. Notably, both the ISM manufacturing and services surveys reported a pickup in prices paid last month (Figure 4), while the Atlanta Fed's measure of businesses' one-year inflation expectations rose to a seven-month high in February.
While February's CPI report is likely to deliver an initial taste of tariffs, it is likely to be just the start. The implementation of a further 10% tariffs on Chinese goods and the follow-through on 25% tariffs on goods from Canada and Mexico, even with some carve outs, is poised to stoke inflation in the near term. Although we expect both headline and core inflation to tick down on a year-over-year basis in February, we anticipate it will start moving back up this spring and remain stuck near 3% for the duration of this year despite further easing in shelter inflation and growing signs of consumer fatigue.
Weekly Market Outlook: Trigger Uncertainty, Nasdaq in Correction & US CPI Data Ahead
- Markets experienced turmoil this week, driven by investor concerns over the Trump administration’s tariff policies.
- The US dollar is on track for its worst week in over a year, Nasdaq entered a correction.
- The Bank of Canada may cut rates due to tariff impacts and economic concerns.
- US CPI is also due in the week ahead, will it rescue the ailing US Dollar?
Week in Review: Fear is Rising but US Labor Market Remains Steady for Now
Markets have struggled this week as fears are rising. Wall Street is on edge as investors say the Trump administration’s mixed signals on rolling back tariffs are creating confusion instead of easing concerns.
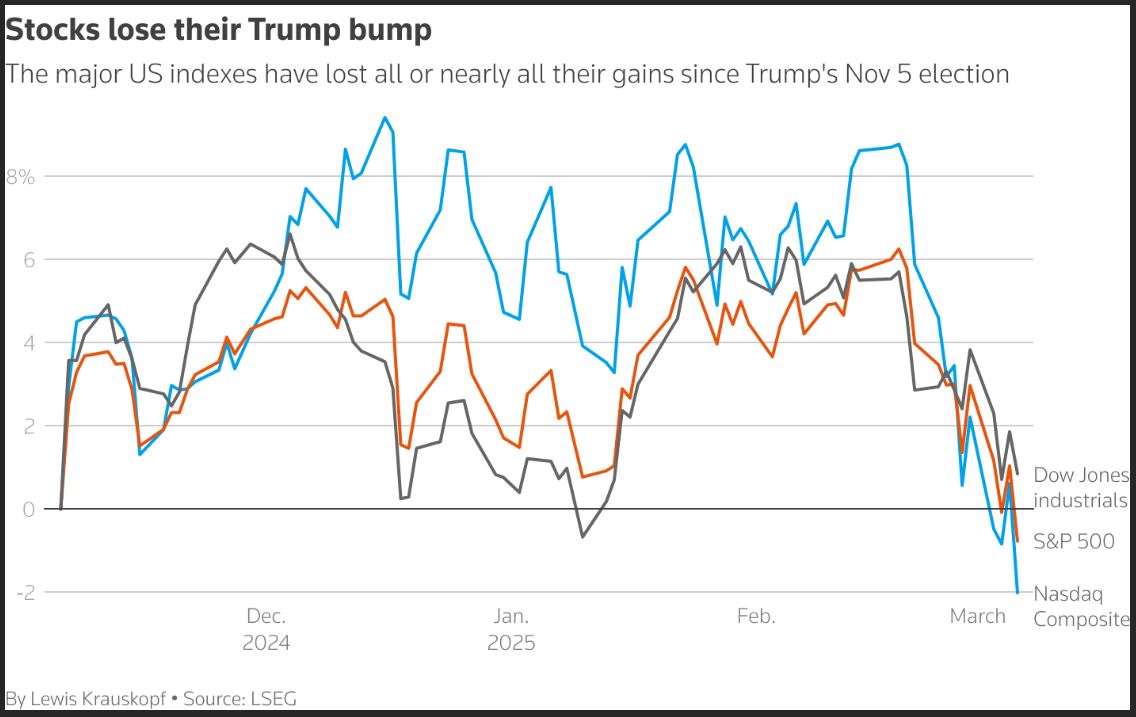
The S&P 500 has dropped 4.3% since President Trump took office on January 20, with tariffs being a major worry for investors. Many believe tariffs could hurt economic growth and lead to higher prices.
On Thursday, stocks faced a sharp selloff after Trump announced a one-month exemption for Canada and Mexico from the 25% tariffs he introduced earlier in the week. The Nasdaq fell 2.6% that day and has been in a correction since its record high on December 16.
This latest tariff move gave limited relief to stocks, as Wall Street remains unsure about how a tariff-driven trade policy might affect the economy.
The Nasdaq 100 has now officially entered corrective territory with losses of 10% from its all time high.
Trump believes tariffs can boost revenue, growth, and help in negotiations with other countries. However, investors are worried they may hurt consumer confidence and cause businesses to hold back on spending.
Sources: LSEG Datastream
A brief pause came on Friday with the US jobs data release. The U.S. added 151,000 jobs last month, according to the Labor Department, following a revised increase of 125,000 jobs in January. Economists had predicted a rise of 160,000 jobs, compared to the earlier reported January figure of 143,000.
On the FX Front the dollar showed its vulnerabilities and is on course for its worst week in over a year. The dollar has dropped about 5% since President Trump took office in January and is now at a four-month low.
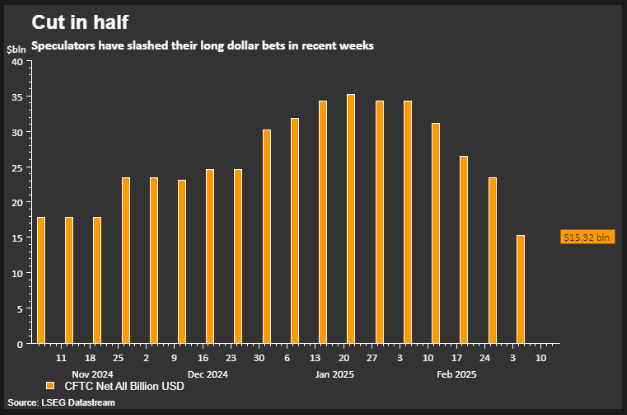
Concerns about U.S. growth, fueled by trade tariff news, have hurt the dollar. Meanwhile, Germany’s boost in spending has improved Europe’s economic outlook, leading investors to move their money to economies with stronger growth prospects.
The chart below shows how speculators have slashed their bets on a bullish US Dollar in recent weeks.
Source: LSEG
On the commodities front, Gold has rebounded this week to trade back above the $2900/oz mark, but continues to struggle to pierce through resistance at the $2924 handle. As we have discussed for weeks now, the geopolitical situation coupled with tariff uncertainty is likely to keep the precious metal supported.
Oil prices faltered this week thanks to the OPEC+ announcement and growth fears. For a full breakdown read Brent Oil Price Analysis: Six-Month Lows Amid OPEC Output, Tariffs & Russia-Ukraine Negotiations
The Week Ahead: Tariffs at the Forefront. Will Trump Follow Through?
Asia Pacific Markets
The main focus this week in the Asia Pacific region for me is China’s Two Sessions and inflation data.
China’s Two Sessions ends next Tuesday, with key policy updates expected on stimulus and reforms. February inflation data is due Sunday, and the Lunar New Year impact may push consumer inflation to -0.3% year-on-year, while producer inflation is also expected to stay negative. Credit data for February is expected next week, with markets predicting higher overall financing and new loans in RMB.
In Japan, I do expect growth in labor earnings to slow, mainly due to smaller bonus payments. January’s inflation spike will likely push real earnings into the negative. Fourth quarter GDP may be revised down from 0.7% to 0.5% because capital spending was weaker than expected.
Markets are still focused on Japan as further interest rate hikes from the Bank of Japan remain on the table.
Europe + UK + US
In developed markets, the US inflation is back in the limelight. The data however, might be overshadowed once more by the ongoing tit-for-tat tariff developments which are set to continue.
U.S. consumer price inflation is expected to remain high in the coming week, with a 0.3% month-on-month increase forecasted. Business surveys show some companies are raising prices ahead of potential tariffs. Food and energy costs are also pushing inflation higher, even though gasoline prices have recently dropped.
However, markets are currently more concerned about slowing growth, government spending cuts, and the risk of reduced purchasing power if tariffs lead to higher prices. Over the past three weeks, expectations have shifted from predicting one small rate cut this year to three. A 0.3% inflation figure is unlikely to change this outlook.
The EU and UK have a bit of breather on the data front next week with a speech by ECB President Christine Lagarde on Wednesday the highlight.
The Bank of Canada has already cut rates by 200 basis points due to weak growth and low inflation. U.S. tariffs on Canadian imports are adding fears of a recession. Governor Macklem warned that a long trade conflict could severely damage the economy, which their models show would shrink before recovering on a path 2.5% below earlier forecasts.
Since 76% of Canadian exports go to the U.S., equal to 20% of GDP, the risks are high. With 6.6% unemployment and 1.9% inflation, the BoC may cut rates by another 25 basis points on Wednesday.
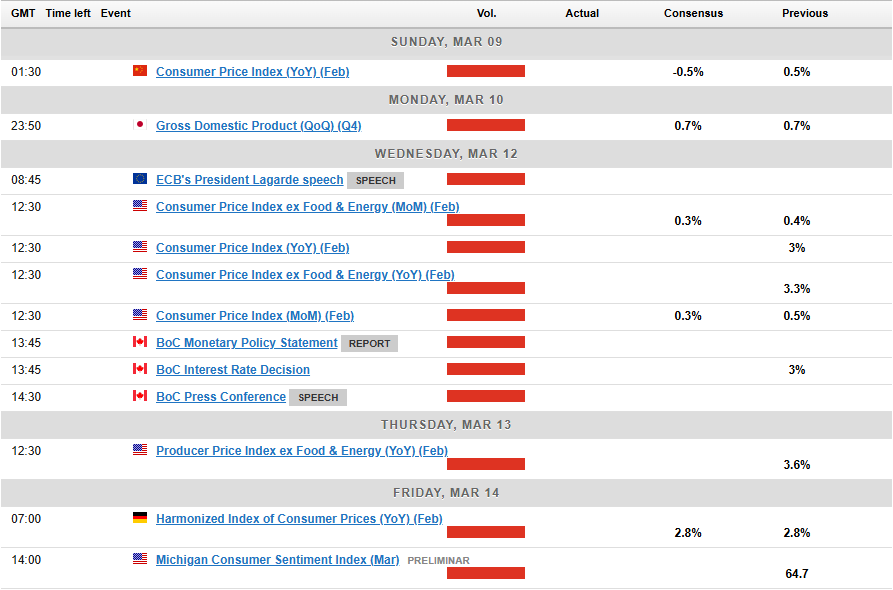
Chart of the Week
This week’s focus is on the Nasdaq 100 chart as the index had fallen as much as 10% from its all time highs this past week.
Friday did however bring a significant recovery from the weekly low of 19733, with the index rising to trade at 20131 at the time of writing. That is a near 2% percent rise from the weekly low.
Is this a temporary pullback or are the bulls finally back?
Time will tell, but given the amount of uncertainty and concerns from companies, there is a real possibility that there may be more downside ahead.
Immediate resistance rests at the 20326 handle which also houses the 200-day MA and could prove a tough nut to crack. If the index is capable of recording a daily candle close above this level then a run toward 20484 and 20790 become a real possibility.
A break of the psychological 20000 handle though could be key and could lead to a longer term selloff down to the mid 18000’s.
Support may be found at 19750 and 19123.
Nasdaq 100 Daily Chart – March 7, 2025
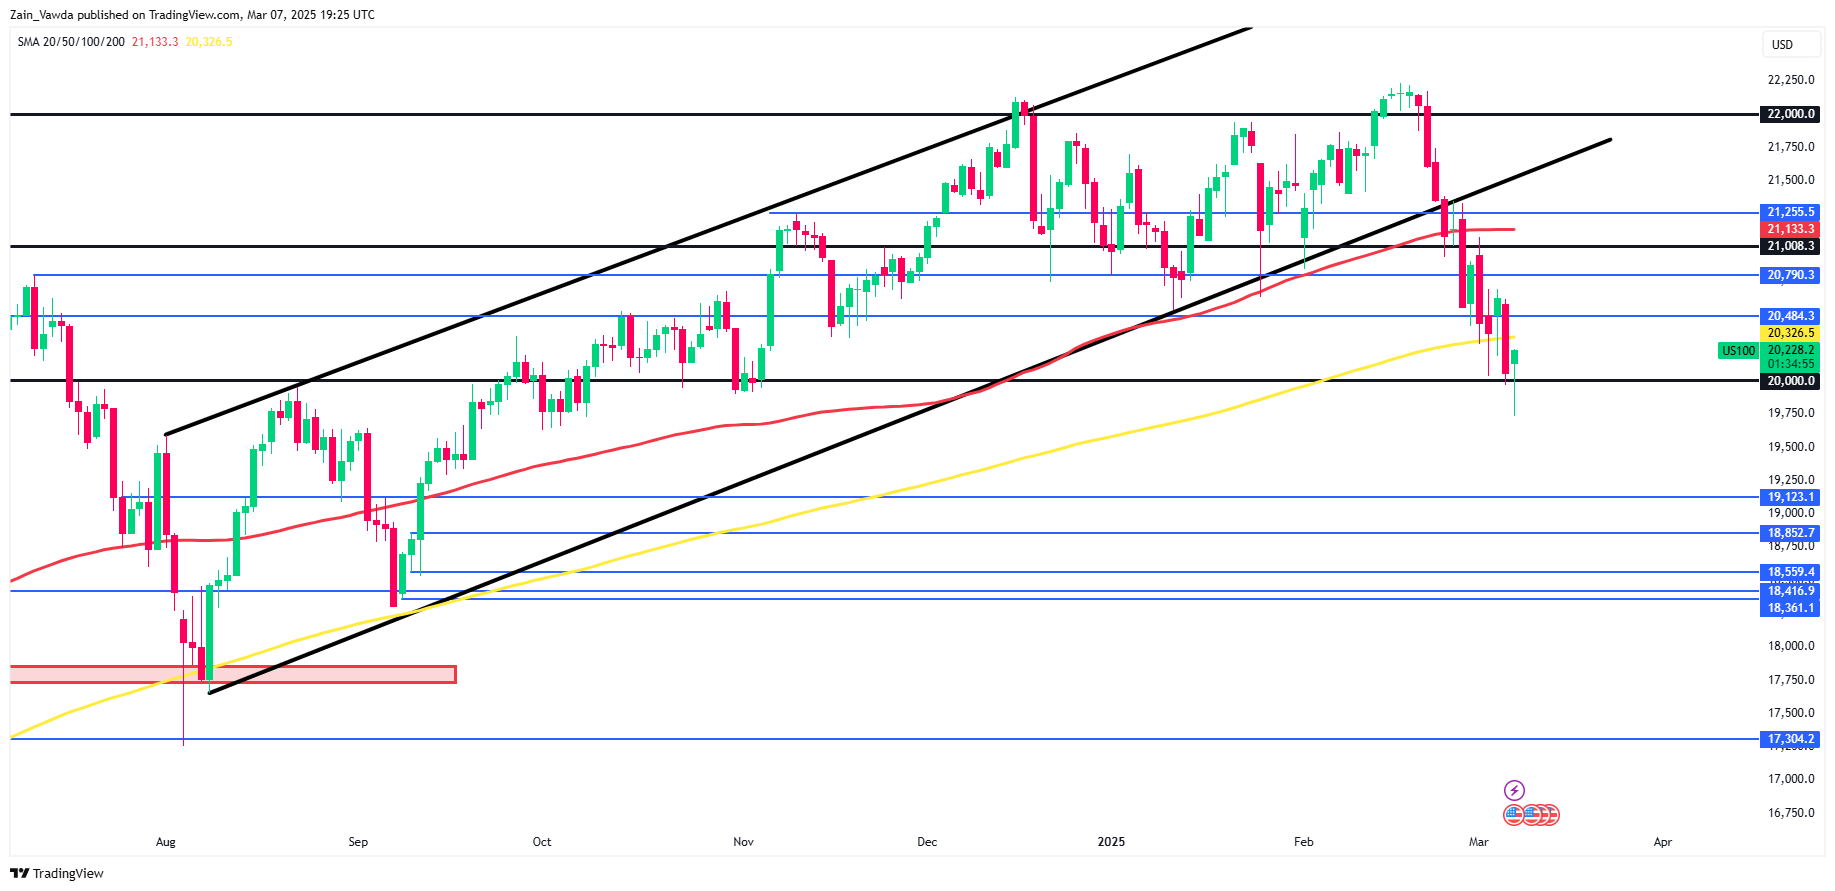
Source:TradingView.Com (click to enlarge)
Key Levels to Consider:
Support
- 20000
- 19733
- 19123
Resistance
- 20326
- 20484
- 20790
The Weekly Bottom Line: Trade Policy Rollercoaster Rattles Markets
Canadian Highlights
- Trump made good on his 25% tariffs threat against Canada and Mexico this week. In the end it only lasted 72 hours, but the rollercoaster gave markets a fright.
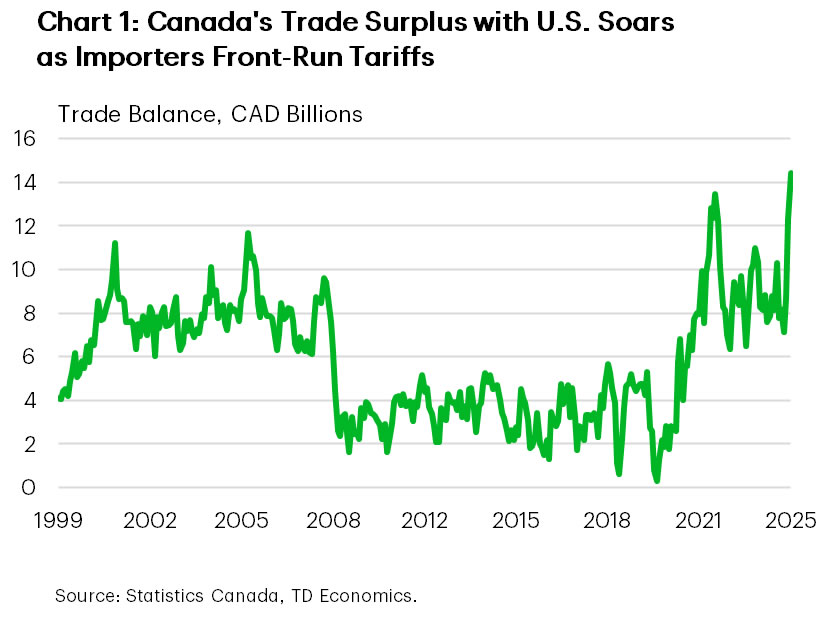
- Canada’s goods trade balance with the U.S. widened substantially in January, highlighting American companies are stockpiling supplies ahead of tariffs.
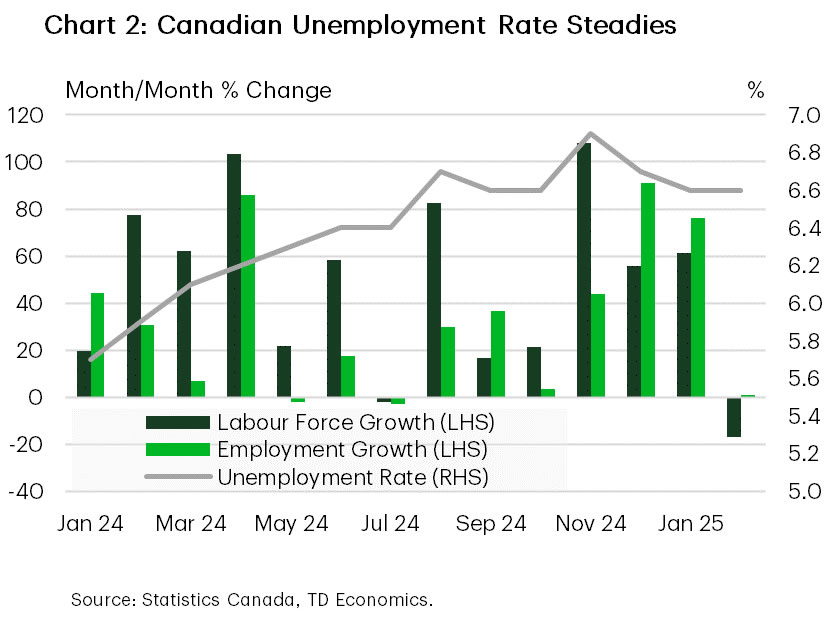
- Canada’s labour market got snowed-in in February. A labour force contraction balanced out the lack of job growth, keeping the unemployment rate steady.
U.S. Highlights
- On-again off-again trade policy continued this week as the U.S. implemented steep tariffs on imports from Canada and Mexico, but then backtracked, announcing carve-outs for USMCA-compliant imports until April 2nd.
- U.S. hiring activity improved moderately in February, with the U.S. economy adding 151 thousand jobs last month. The unemployment rate ticked up from 4.0% to 4.1%.
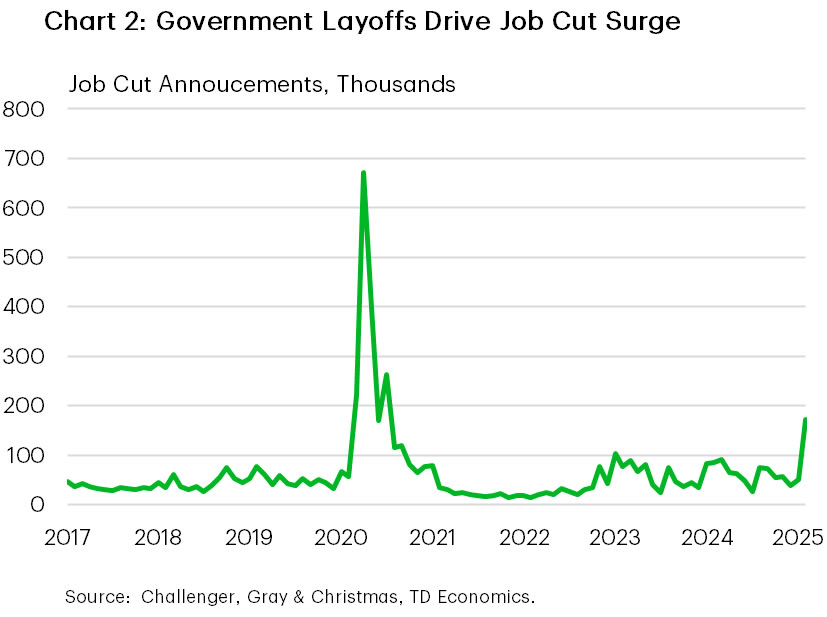
- One measurement of job cut announcements surged to 172 thousand in February, with government sector layoffs driving the surge.
Canada – Tariff-Induced Headaches
Canadians’ necks are likely sore from following the back and forth of this week’s tariff volleys. Beginning on March 4th, the previously unthinkable happened – the U.S. implemented 25% tariffs on Canadian and Mexican goods— with a 10% tariff on energy. Over the next 72 hours, Canada doubled-down on its retaliatory plan, the auto sector was granted a one-month carve out, and an executive order was signed pausing tariffs on Canadian and Mexican goods compliant with the United States-Mexico-Canada Free Trade Agreement (USMCA). And as it turns out, markets aren’t loving the uncertainty. Stocks continued to slide, with the S&P 500 and Canadian benchmark TSX dropping around 2% on the week. Canadian two and ten-year government bond yields rose modestly, helped by easing growth concerns, and the CAD nudged higher, finishing the week at 69.6 cents US.
Trade data confirmed that U.S. importers were proactive, and stockpiled Canadian goods to get ahead of tariffs. Canada’s monthly trade balance with the U.S. widened to over $14 billion in January, a new historical high (Chart 1). This was driven by a 7.5% month-on-month (m/m) surge in exports focused in the automotive sector, consumer goods, industrial machinery & equipment and energy products, which are key sectors impacted by tariffs. What’s more, since Trump won the election in November, nominal exports to the U.S. are up by a whopping 22%, the largest three-month gain on record, and by a considerable margin—excluding the frenetic export recovery in mid-2020. In the near-term, Canada’s economy will benefit from this tariff front-running, with early tracking showing a sizeable contribution from net trade to first quarter GDP growth. The expected broad-based weakness in the Canadian dollar could also buffer exports as trade flows constrict if and when tariffs set in.
Meanwhile, Canada’s labour market flatlined in February, with virtually no job created in the snowy month. Despite this, the unemployment rate held steady 6.6%, as the labour force contracted for the first time in seven months (Chart 2). On the margin, it was a weak report relative to expectations, but the readings were skewed by the intense snowstorms that occurred during the survey’s reference week. Almost half a million employees saw a reduction in hours worked because of the weather, pulling nation-wide total hours worked lower by 1.3%. This may have a negative impact on February’s industry-based GDP readings, but we’d expect a positive kick-back in March.
The Bank of Canada is set to make a highly anticipated interest rate announcement next Wednesday. For several weeks, we’ve expected the BoC to deliver a 25 basis point (bps) cut to take out insurance against a trade war escalation, despite the domestic economy running at a decent clip. Indeed, market pricing is aligned with our call, now predicting a 90% chance of a 25 basis (bps) rate cut, up from only 30% a couple weeks ago.
U.S. – Trade Policy Rollercoaster Rattles Markets
The first week of March proved to be a rollercoaster for financial markets. While plenty of important data reports were published, these generally played second fiddle to developments on the trade front. Early in the week, the U.S. imposed 25% tariffs on Canada and Mexico, and an additional 10% tariff on China. Canada and China retaliated, albeit in a more measured approach. As the trade conflict heated up, stock markets trended lower. But, slightly cooler heads seemed to prevail in the following days, with the U.S. first announcing a carve-out from tariffs for the auto sector, then announcing that all USMCA-compliant imports from Canada and Mexico would be exempt from the 25% tariff until April 2nd.
At a first glance, the latest backtracking on the tariff measures can be viewed as a positive development. However, the amount of trade that will ultimately be tariff exempt is still unclear, with at least some portion of imported goods from Canada and Mexico expected to face a higher tariff rate than they had until recently. The complicated nature of trade rules and processes is likely to cause delays and disruptions to supply chains.
Furthermore, the fact that this latest move provides only a partial reprieve from higher tariffs, with trade tensions likely to flare up once again in a month from now, does little to alleviate concerns. In fact, come April 2nd, tariff action is expected to involve many other countries. On that day, the U.S. is expected to impose reciprocal tariffs on all nations that place tariffs or tariff-like barriers on U.S. goods.
Tariff threats have already effected business decisions, as many firms ramped up shipments early in the year to get ahead of tariffs. Imports surged 10% in January, which widened the U.S. trade deficit to a record of $131 billion. This is likely to weigh on growth in the first quarter. The stop-start nature of policy moves also undermines consumer and business confidence, and is expected to weigh on investment decisions.
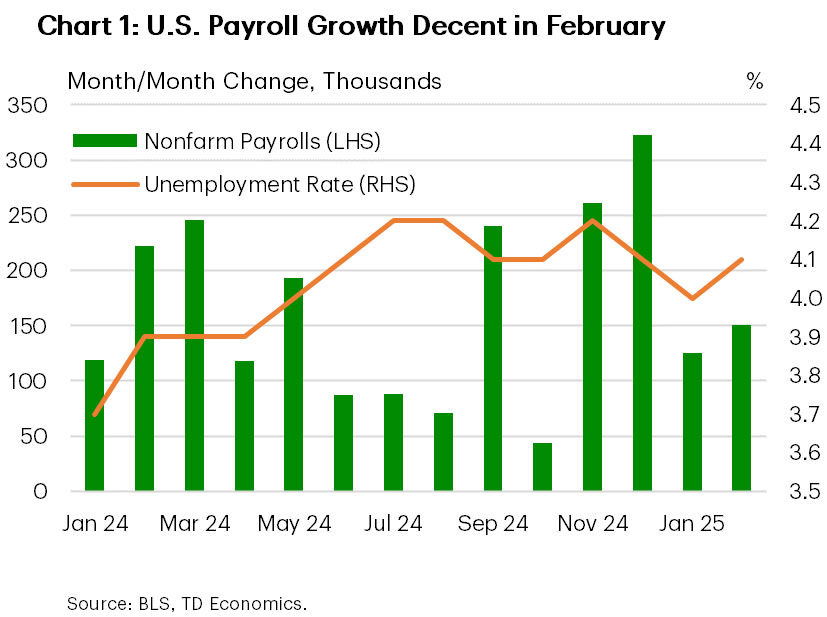
For the time being, the job market remains on solid footing, with the U.S. economy adding 151k jobs in February (Chart 1). However, job growth is likely to soften ahead. Apart from the potential for trade policy uncertainty to weigh on near-term hiring intentions, federal layoffs related to DOGE also continue to mount. Job cut announcements surged in February, with a steep increase in layoffs in the government sector being the largest contributor to the overall tally (Chart 2). The potential for a government shutdown, which could happen as early as next weekend, may pose additional downside risk over the near-term.
The Fed will have to carefully weigh the risks of a potential slowing in economic activity against the risk of a near-term boost in inflation. The price measures in both the Manufacturing and Services ISM surveys increased in February. For the time being, the Fed is expected to remain on hold, but come summer we could see chair Powell taking out the interest rate scissors.
Weekly Economic & Financial Commentary: Tariff Turmoil
Summary
United States: Tariff Turmoil
- The U.S. economy added 151K jobs in February accompanied by higher unemployment and lower labor force participation. Economic developments elsewhere reflected heightened uncertainty around trade policy, prompting a leap in imports, concerned industry comments and reports of higher input prices.
- Next week: JOLTS (Tue.), CPI (Wed.), Federal Budget (Wed.)
International: Simulating the Economic Impact of Tariffs
- In an effort to proactively assess the economic impact of changes to U.S. and international trade policy, we modeled two new tariff scenarios. The more aggressive and contentious simulation—defined by aggressive tariff hikes and matching retaliation—leads to global recession in 2026 and sharp economic downturns in Canada and Mexico.
- Next week: Tariff Talk (Mon.-Fri.), Bank of Canada Rate Decision (Wed.), Brazil Inflation (Wed.)
Interest Rate Watch: What to Make of the 10-Year Treasury Yield?
- The 10-year Treasury yield has fallen sharply to start the year. The yield on the 10-year note began 2025 around 4.6%, and it got as high as 4.8% in mid-January. But over the past couple of months, a more dour economic outlook amid an escalating trade war have pushed yields down to roughly 4.26% as we went to print. Have longer-term yields fallen too far too fast?
Topic of the Week: Don't Set Your Expectations Too High
- Tariffs pose upside risks to inflation, as the additional levies could be passed through to selling prices. Expectations for price growth in 2025 are recalibrating in response. Across several surveys and market-based measures, short-term inflation expectations have moved higher in recent months.