
Sample Category Title
GBP/USD Daily Outlook
Daily Pivots: (S1) 1.2879; (P) 1.2912; (R1) 1.2953; More...
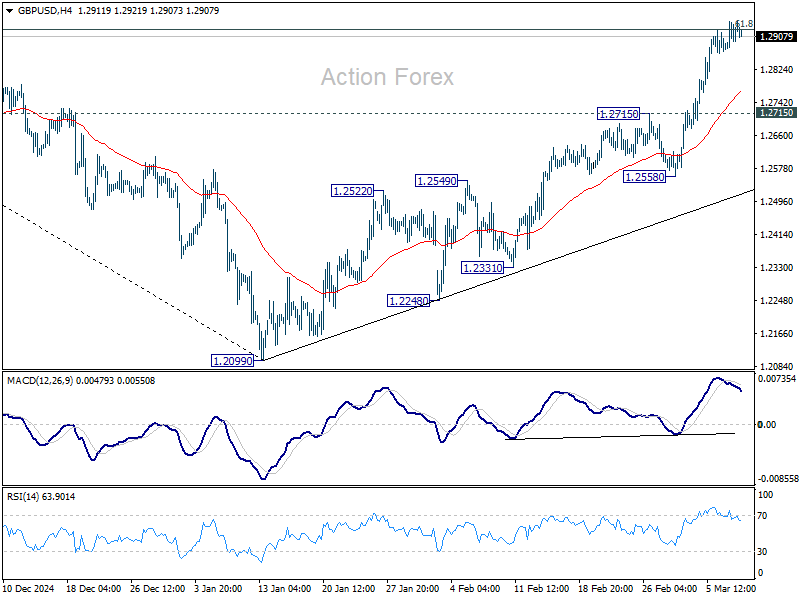
Intraday bias in GBP/USD is turned neutral again on loss of momentum as seen in 4H MACD. Downside of consolidations should be contained by 1.2715 resistance turned support to bring another rally. On the upside, sustained break of 61.8% retracement of 1.3433 to 1.2099 at 1.2923 will pave the way back to 1.3433 high.
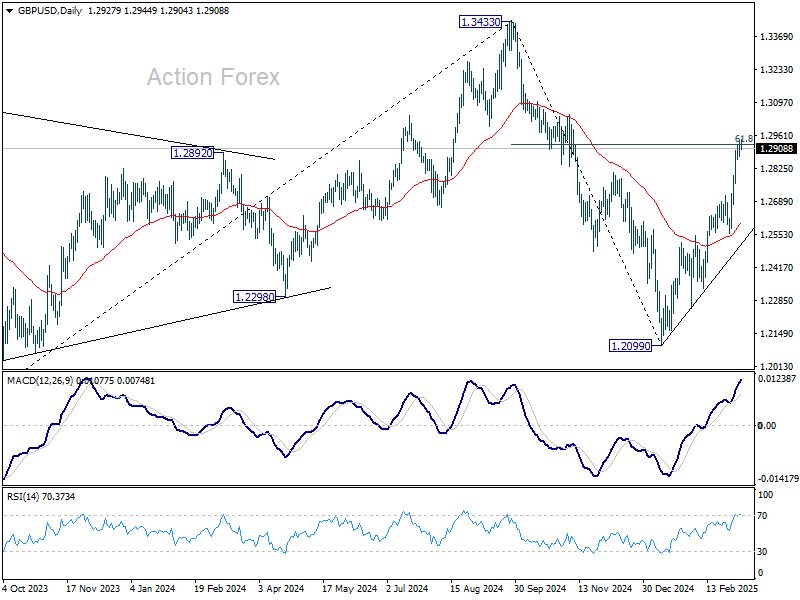
In the bigger picture, fall from 1.3433 (2024 high) should have completed at 1.2099 as a corrective move. Up trend from 1.3051 (2022 low) is still in progress but it's too early to say that it's resuming. Corrective pattern from 1.3433 could extend with one more down leg. But after all, eventual upside breakout is expected at a later stage.
USD/CHF Daily Outlook
Daily Pivots: (S1) 0.8759; (P) 0.8809; (R1) 0.8850; More…
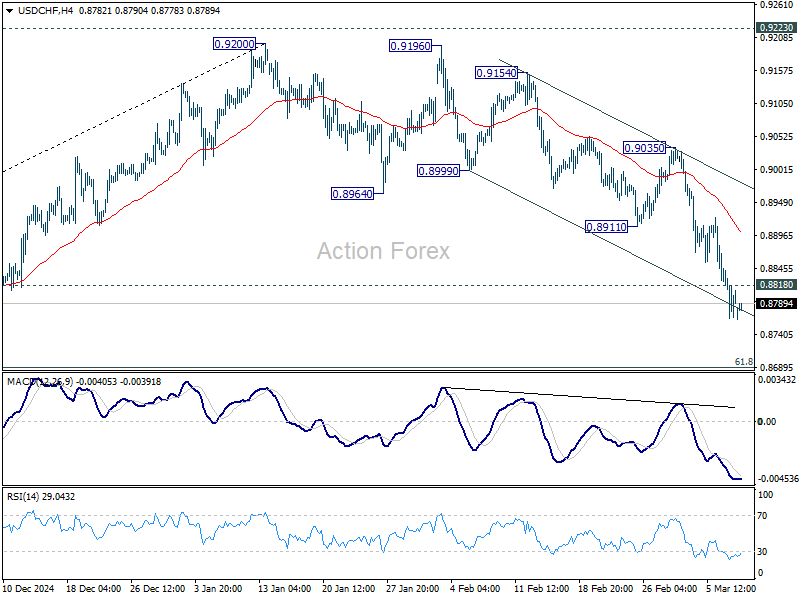
Intraday bias in USD/CHF remains on the downside for the moment. Current fall from 0.9200 should target 61.8% retracement of 0.8374 to 0.9200 at 0.8690. Sustained break there will pave the way back to 0.8374 support. On the upside, above 0.8818 minor resistance will turn intraday bias neutral and bring consolidations, before staging another fall.
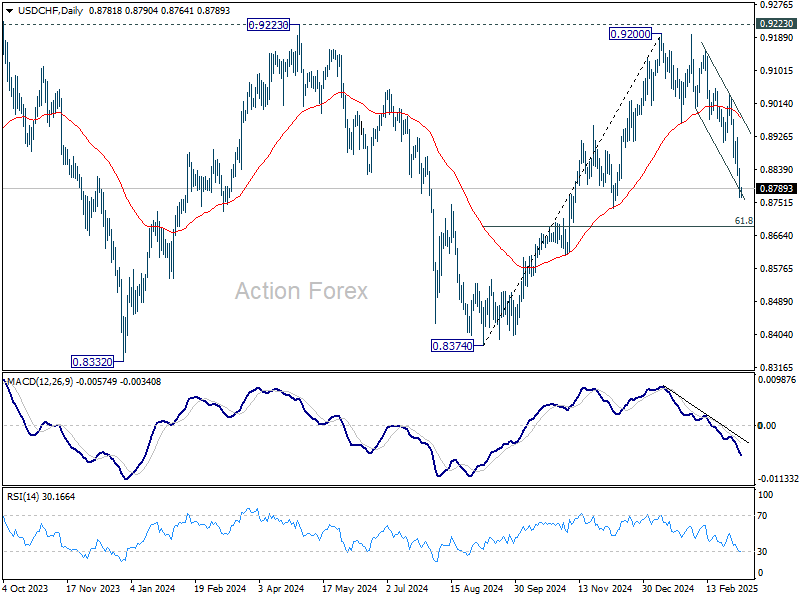
In the bigger picture, rejection by 0.9223 key resistance keep medium term outlook bearish. That is, larger fall from 1.0342 (2017 high) is not completed yet. Firm break of 0.8332 (2023 low) will confirm down trend resumption.
It’s An Important Tariff Week
Markets
US payrolls were decent across the board but missed the bar by a slight margin. It triggered only a minor kneejerk upleg in US Treasuries, suggesting some fatigue creeping in after a stellar rally in recent weeks. Powell’s looming noon (US time) speech ahead of the communications blackout kept markets on the sidelines too. The Fed chair said uncertainty around the US economy had increased but that it continues to be in a good place. He doesn’t draw too many conclusions from indicators including weaker confidence surveys since it remains yet to be seen how this will affect future spending and investment. Powell said on inflation that they see ongoing progress in the currently still-elevated categories but the path is expected to remain bumpy. His view can be summarized in a one-liner: “We do not need to be in a hurry, and are well positioned to wait for greater clarity.” Simply sticking to the January message of a(n extended) pause helped form a bottom below US yields, which had been sliding over the last couple of weeks on recessionary concerns driven by weak(ish) data and DOGE, tariff-sparked uncertainty. Rates left the intraday lows to close between 2-4 bps higher. The (very) long end in Europe continues to underperform on the dramatic German fiscal policy U-turn. 30-yr yields added up to 6 bps (swap). The euro in the same vein keeps grabbing a decent bid. EUR/USD’s shy throw for 1.09 failed but the pair nevertheless ended higher and took out the 1.0804 resistance level (61.8% recovery on the Sep-Jan decline) in the process. The trade-weighted dollar index finished with a new four-month low sub 104. Sterling fell against the euro with a second but failed attempt by EUR/GBP to take out 0.84.
Markets are ready for a slow start this week. There are a few interesting data releases on tap later though, including in the US even though Chair Powell removed any of the remaining doubts for a pause on March 19. US JOLTS job openings and CPI numbers are due tomorrow and Wednesday. Consumer confidence (Michigan) on Friday is closely watched for any potential sentiment hit. It’s also an important tariff week with Chinese retaliatory measures kicking in today. Wednesday is a US-imposed deadline for 25% tariffs on (European) steel and aluminum. “The ECB and its Watchers” conference kicks of on Wednesday with many high-profile speakers including Lagarde scheduled. The US government is facing shutdown as soon as Friday. The House Republicans have announced a spending bill to keep agencies open through September 30 but it needs the help of Democrats in the Senate to get the 60-40 majority requirement. Should it fail, Congress is likely to pass a temporary bill to buy additional time.
News & Views
UK labour market conditions continued to weaken midway through the first quarter of 2025, according to the latest KPMG and REC UK Report on Jobs survey, compiled by S&P Global. The subdued economic outlook and rising payroll costs pushed businesses into pausing or paring back hiring plans while permanent placements and temp billings remained in decline as well (though at slower pace than last month). Weaker demand, also visible in a further drop in overall vacancies is met by higher supply (redundancies expand pool of labour) resulting in starting salaries rising at the weakest pace in 4 years. Commenting on the data, survey partners warn that several headwinds to growth remain with changes to National Insurance and the National Living Wage taking effect from April and the Exchequer’s Spring statement likely to be fiscally constrained. Easing pay growth should please the Bank of England though with expectations of further rate cuts offering a glimpse of hope.
Japanese base pay rose by 3.1% Y/Y in January, the fastest pace since October 1992. Growth in nominal cash earnings slowed from 4.4% Y/Y to 2.8% Y/Y with real cash earnings, adjusted for price growth, falling by 1.8% Y/Y. The data come as negotiations between Japanese unions and employers are expected to reach initial results later this week (March 14). Japan’s biggest union group last week demanded the highest wage hike since 1993 (6.09% vs 5.85% last year). These wage dynamics support the case for more gradual rate hikes by the BoJ. The central bank raised its policy rate to 0.5% in January. Another 25 bps increase is currently only (fully) discounted by September, but wage deals can easily speed up that timeline. The Japanese yield curve extends the recent bear steepening this morning with yields rising by 3 bps (2-yr) to 8.5 bps (20-yr). The Japanese yen tries to build on last week’s technical break below USD/JPY 148.65, which is the neckline of a double top formation.
Carney is Back
Last week was packed with tariff uncertainty and weak economic data. Friday’s jobs figures - the first set of jobs data of the new Trump era so far marked by mass firings at federal agencies - resulted in a weaker-than-expected NFP print, a higher-than-expected unemployment rate and a lower-than-expected participation rate. The only bright spots from Friday’s data were the higher-than-expected rise in manufacturing payrolls and the slower-than-expected wages growth on an annual basis. The latter could help tame additional inflationary pressures from tariffs in the US along with the waning consumer confidence and spending, and help the Federal Reserve (Fed) support the US economy navigate through agitated waters. But inflation will be crucial to determine the extent of Fed support.
This week, the US CPI update will be closely watched. rising inflation expectations keep the Fed doves on the sidelines. Activity on Fed funds futures hints that the Fed won’t be able to cut the rates before its June meeting – if it cuts at all this year. Fed’s Powell said on Friday that the US economy continues to ‘be in a good place.’ But the recession bets are rising, and the latest forecasts point at a sharp drop in economic growth in Q1.
Anyway, this week, analysts expect the US to print a slight easing in February inflation figures on both monthly and annual basis. If that’s the case, if the CPI update points at a number in line with expectations, or ideally softer-than-expected, the Fed doves could step up their rate cut bets for earlier than the June meeting. The latter could further pressure the US 2-year yield that best captures the Fed expectations and further weigh on the US dollar. It could also give support to the major US indices which were hit by their worse selloff since the Fed’s tightening peaked in 2023. If inflation looks stronger-than-expected, on the other hand, the market mood could further sour and the selloff in equities and the dollar could continue.
The reverse Trump trade
The S&P 500 dropped more than 3% last week, Nasdaq 100 lost nearly 3.30%, the Dow Jones declined 2.40%, the mid-caps lost almost 3.50% while the small cap Russell 2000 index dropped more than 4%. Note that this is the complete opposite of what was broadly expected to happen under Trump. The small and medium-sized stocks were supposed to flourish on America First policies and the dollar explode. Instead, the EURUSD has had its best week since more than a decade despite a 25bp rate cut from the European Central Bank (ECB) and the Stoxx 600 hit a fresh ATH, boosted by defense stocks. Cherry on top, the Eurozone’s Q4 growth surprised to the upside, and strengthened the view that growth in Europe could gather momentum as growth in the US will probably slow dramatically. As such, the rotation trade from the US to European stocks is set to continue. The EURUSD will probably test the 1.10 level sometime in the coming weeks. But in the short run, note that we see a hesitant start to the week, the RSI indicator confirms that the euro might have been purchased too fast and in a too short period of time and it could be time for correction. The price pullbacks could be interesting opportunities to build long euro positions on the stronger convergence for the US/European growth outlooks.
Carney is back
We woke up to the new week on news that Mark Carney, the ex- President of the Bank of Canada (BoC) and the Bank of England (BoE), will replace Trudeau as the next Canadian PM! Carney plans to respond to the US tariff attack with retaliatory tariffs but also implement economic reforms that include tax reductions and the promotion of innovation with the goal of reducing dependence on the US. His tough tone could help the Liberals improve popularity. The currency markets didn’t give a significant reaction to the news, the Loonie is rather pressured by the falling oil prices this morning. In the medium run, we could see the Loonie gain some colour against a broadly paler greenback if Carney successfully counters the US trade attacks. But in the short-run, selling pressure persists, and the BoC is expected to trim rates by another 25bp when it meets this Wednesday.
Ugly early week selloff in China
The week starts on a sharp negative note for the Chinese stocks, as the latest inflation update showed that consumer prices in China fell the most in more than a year. The Hang Seng index extends losses to more than 2% at the time of writing. But note that the index rebounded close to 30% since the DeepSeek news broke in January and the low valuations of the Chinese technology stocks along with promising AI news and the ample government support will probably bring the buyers in at dips.
Overall, the week is expected to bring more tariffs the Chinese tariffs on US agricultural and some Canadian products will start today, while the US steel and aluminium tariffs will be live from Wednesday.
Pressure Builds for Ukraine Peace Deal
In focus today
In the euro area, the Sentix investor sentiment indicator will be released today, revealing whether the sentiment improvement observed in February persisted into March.
In Sweden, several macroeconomic datapoints will be released. It is interesting to look at the production value index, household consumption, as well as industrial orders and turnover to get a better understanding on where the Swedish economy is heading. Further, we get the GDP-indicator for January. However, given the poor prediction capabilities of the indicator for the actual outcome we would not put too much emphasis on that number.
In Norway, we receive inflation figures for February. Surprisingly, core inflation for January rose to 2.8% y/y, largely driven by higher-than-expected growth in import prices. We believe that core inflation rose 0.25% m/m (SA) in February, leaving annual growth unchanged at 2.9%. This is somewhat higher than Norges Bank's estimate from PPR 4/24 in December of 2.7% and could start speculations that the disinflationary trend is slowing or even turning. After the Swedish data, risk may even be to the upside.
Throughout the week, focus will be on the meeting between US and Ukrainian officials on Tuesday. In Germany, we will closely monitor any developments concerning the substantial fiscal package that the incoming government agreed on last week.
Economic and market news
What happened over the weekend
In the US, the February labour market report aligned closely with expectations, showing an increase of 151K (cons: +160K, prior: +143K). Given the recent layoff of 30,000 public sector employees and the reduced labour influx due to tightened immigration rules this summer, job growth is considered robust. Unemployment rose slightly to 4.1% in February from 4.0% in January. Overall, this report did not signal imminent concerns about recession or overheating although other indicators have painted a softening picture of the US economy lately.
In geopolitics, Trump has suggested the possibility of imposing additional large-scale US sanctions and tariffs on Russia, aiming to exert pressure on Russia to negotiate a peace deal in Ukraine. This week, US and Ukrainian officials are scheduled to meet in Saudi Arabia for discussion, with hopes that these talks will be more fruitful than Zelenskyy's visit to the White House last week, which resulted in the US suspending military aid and intelligence support to Kyiv.
In the euro area, the revised final accounts data for Q4 exceeded expectations, showing growth of 0.2% (prior: 0.1%). Additionally, the full-year GDP growth forecast for 2024 was adjusted upwards to 1.2% (prior: 0.9%), which is a positive development given the weak growth of 2024.
In China, February inflation figures saw the first decrease in 13 months, with CPI coming in at -0.7% y/y (cons: -0.5%, prior: +0.5%) as the country faces deflationary pressure. This decline was largely attributed to the earlier than usual lunar new year holiday and reduced food costs. Next month's figures will be monitored to assess whether Beijing's efforts to stimulate the economy are impacting consumer and corporate expenditures.
In Denmark, industrial production experienced a significant decline of 11.9% in January (SA). Even for Danish industrial production, which is relatively volatile, this represents a substantial decrease. Although the pharmaceutical sector played a major role in this drop, production excluding pharmaceuticals still fell by 7.7%.
Equities: Equity investors stopped the bleeding on Friday, with US equities higher on a better-than-feared job report and dovish comments from Powell. Selloff still big from a week-to-week perspective and this time it brought Europe along. S&P 500 gained 0.6% on Friday but -3.3% for the week while Europe shaved off 0.6% for the week. This takes Nasdaq and small cap Russell 2000 in correction territory from the post-election highs, S&P 500 -6% since its peak, equal weighted S&P 500 -5%.
Sector- and regional performance differences have been huge the last three weeks. US banks, cars and consumer discretionary stocks took the biggest hit last week, down in the ballpark of 5-10%. Although Europe were lower for the week, sector performance tells a completely different story, partly due to the different direction of yields. While export companies are more sensitive to tariffs, it is not those that have sold off but the domestic industries - real estate -8%, consumer durables -8% - that has taken the hit. Meanwhile, capital goods and materials have added 3-4%. Yields and Germany's stimulus program is of course at the heart of this.
Retail investors were faster than professional investors in timing this selloff with the AAIIs bull-bear spread sliding into negative already at the start of the year. Retail investors have built a reputation of buy-the-dip-strategies the last five years, however, despite the correction territory in many US indices, the bull-bear spread remain at historical lows. The Fear-and-Greed index is at Extreme Fear. The jury is still out, but there is a risk that retail investors will be slower this time around, as the Trump and Fed put is more absent. Unlike the last five years, dovish comments from Powell - playing down the recent drop in sentiment surveys and uptick in inflation expectations as noise - did not sooth equity investors on Friday, with US equity futures lower again this morning. Bearish commentary from Trump in Fox News over weekend probably overshadowed Powell's attempt, with Trump arguing that the US economy will undergo "a period of transition" due to tariffs. He explicitly downplayed the Trump put "Look, what I have to do is build a strong country. You can't really watch the stock market. If you look at China, they have a 100-year perspective". This is quite a U-turn from Trump 1.0. It goes without saying, China is hardly a role model for equity investors, with indices still some 25% down from its 2021 peak.
FI&FX: While Friday's NFP report failed to do much for US fixed income, US yields eventually rose going into the weekend following remarks from FOMC Chair Powell who said that although uncertainty has increased, the US economy is "fine" and that there is no need to hurry to adjust the policy rate. Overnight, part of this move has been reversed as we start the week on a sour note in terms of risk appetite with the big European and US equity futures in red and global yields lower. The USD has gained back some of what was lost during an eventful week, during which EUR/USD went from below 1.04 last Monday to peak at 1.0889 on Friday afternoon before eventually closing the week at 1.0835. German yields steadied on Friday after the rout following the announcement of the German spending package. In the Scandies, the SEK remains the clear Majors outperformer with EUR/SEK breaking firmly below the 11.00 threshold and now trading just above the 10.90 figure. Meanwhile EUR/NOK continues to edge modestly higher trading just below the 11.80 mark.
USD/JPY Daily Outlook
Daily Pivots: (S1) 147.26; (P) 147.73; (R1) 148.51; More...
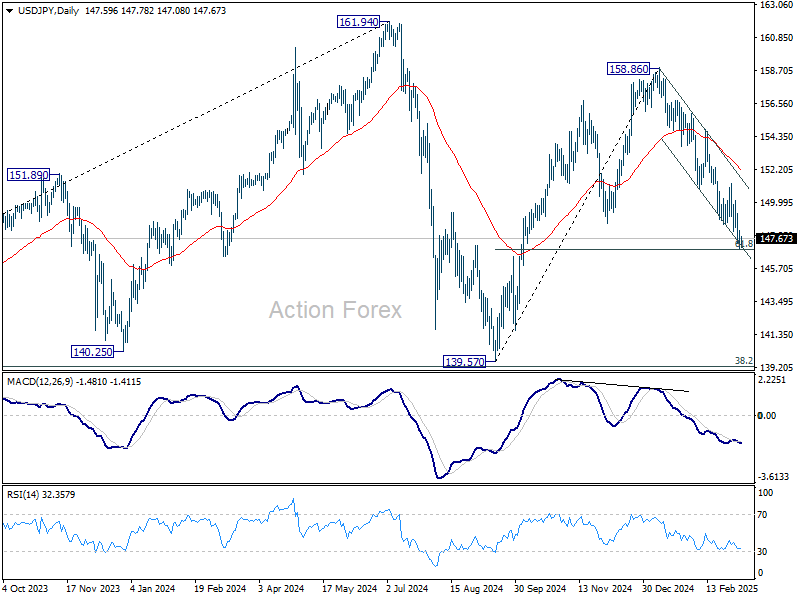
Intraday bias in USD/JPY stays on the downside at this point. Sustained trading below 61.8% retracement of 139.57 to 158.86 at 146.32 will pave the way to 139.57 support. On the upside, 149.32 minor resistance will turn intraday bias neutral and bring consolidations again, before staging another fall.
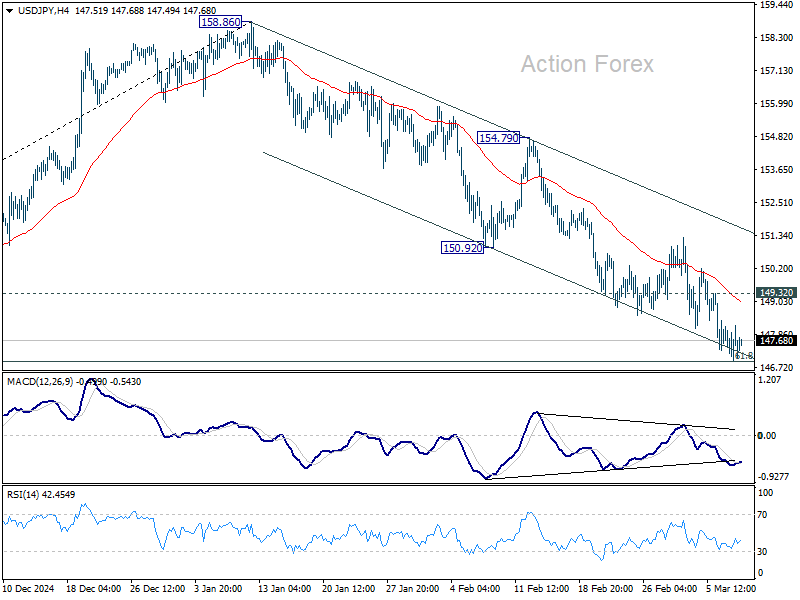
In the bigger picture, price actions from 161.94 are seen as a corrective pattern to rise from 102.58 (2021 low), with fall from 158.86 as the third leg. Strong support should be seen from 38.2% retracement of 102.58 to 161.94 at 139.26 to bring rebound. However, sustained break of 139.26 would open up deeper medium term decline to 61.8% retracement at 125.25.
Dollar Stays Soft as Forex Markets Quiet, US CPI Highlights the Week
Forex markets are trading quietly in the Asian session, remaining within Friday’s range and showing little impetus to move decisively in either direction. Dollar is staying on the back foot, with a lack of substantial buying interest to sustain a meaningful rebound. While last week’s non-farm payroll data helped calm fears of a rapid labor market slowdown, market sentiment remains cautious in the face of escalating uncertainties.
Late last Friday, Morgan Stanley lowered its 2025 economic growth forecast for the US and highlighted mounting concerns about trade tensions. The bank noted that “earlier and broader tariffs should translate into softer growth this year.” In contrast to its previous assumption that any tariff-related drag on growth would be more pronounced in 2026. Morgan Stanley now projects Q4/Q4 2025 growth at 1.5% (down from 1.9%), and 2026 growth at 1.2% (down from 1.3%).
Goldman Sachs also joined the wave of downward revisions, cutting its 2025 Q4/Q4 GDP growth forecast from 2.2% to 1.7%. Moreover, it raised its 12-month recession probability to 20%. While the odd is still low, it's a noticeable shift from the previously estimated 15%.
So far this month, Dollar is the weakest performer among the major currencies. It is trailed by Canadian Dollar and then Australian Dollar. On the other end, Euro leads the pack, followed by Swiss Franc and then British Pound, indicating broad European strength in the current environment. Both Yen and New Zealand Dollar hold the middle ground.
Looking ahead, the upcoming US CPI release will be the major data focal point this week Meanwhile, BoC is widely expected to deliver another rate cut. UK GDP data will also be a feature.
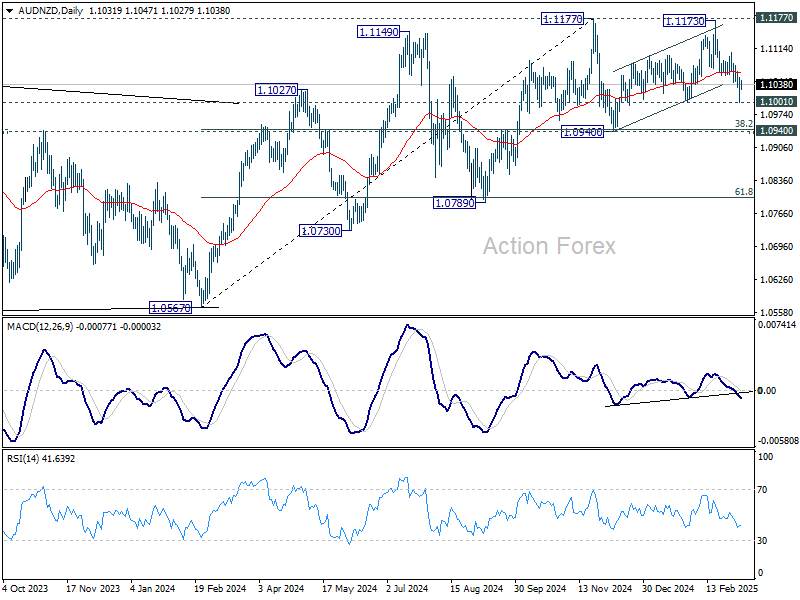
Technically, AUD/NZD appears to be building up downside momentum as seen in D MACD. Break of 1.1001 support will pace the way to 1.0940 cluster support zone (38.2% retracement of 1.0567 to 1.1177 at 1.0944). Such development would give Aussie some additional pressure elsewhere.
In Asia, at the time of writing, Nikkei is up 0.47%. Hong Kong HSI is down -1.53%. China Shanghai SSE is down -0.37%. Singapore Strait Times is down -0.52.
Japan’s nominal wages rises 2.8% yoy in Jan, real wages fall -1.8% yoy
Japan’s labor cash earnings rose 2.8% yoy in January, falling short of market expectations of 3.2% yoy. Nominal wage growth remained positive for the 37th month.
Real wages, adjusted for inflation, fell -1.8% yoy, reversing two months of slight gains. The decline was largely driven by a sharp rise in consumer inflation.
The inflation rate used by the Ministry of Health, Labor and Welfare to calculate real wages—which includes fresh food prices but excludes rent—accelerated to 4.7% yoy, its highest level since January 2023.
Regular pay, or base salary, rose 3.1% yoy, the largest gain since 1992. This was overshadowed by a sharp -3.7% yoy decline in special payments, which consist largely of one-off bonuses.
China’s inflation turns negative, but seasonal factors skew the picture
Released over the weekend, China’s consumer inflation dipped into negative territory for the first time in over a year, with February’s CPI coming in at -0.7% yoy, weaker than the expected -0.5% yoy, and a sharp reversal from January’s 0.5% yoy gain.
Core CPI, which strips out food and energy prices, also slipped by -0.1% yoy—its first decline since January 2021—signaling weak underlying demand.
On a month-over-month basis, consumer prices fell -0.2%, more than the expected -0.1%, reversing some of January’s 0.7% increase.
While the decline may raise concerns about deflationary pressures, NBS attributed much of the drop to seasonal distortions tied to the timing of the Lunar New Year. Stripping out this factor, NBS estimates that CPI actually rose 0.1% yoy.
Given these distortions, a clearer picture of China’s inflation trajectory will likely emerge in March when seasonal effects fade.
Meanwhile, producer prices remained in contraction for the 29th consecutive month, with PPU declining -2.2% yoy, slightly better than January’s -2.3% yoy but still below expectations of -2.1% yoy.
BoC rate cut, US inflation and consumer sentiment
Expectations for BoC to continue easing policy have surged following weak February job data, which showed that tariff-related uncertainty is already taking a toll on employment. Markets now widely expect BoC to lower its policy rate by another 25bps this week to to 2.75%, This would serve as an insurance move against further trade disruptions. With inflation well-contained, some analysts believe the central bank would continue cutting at this pace in upcoming meetings until rates reach 2%.
BoC’s rhetoric will be closely scrutinized to gauge how policymakers assess the risks posed by tariffs and trade disputes. If the central bank signals greater concern over the economic fallout, expectations for a sustained easing cycle will strengthen. The stance will be critical in shaping near-term movements in Canadian Dollar, which has just had a roller-coaster ride last week on tariff news.
Looking south, US inflation data are another pivot point for global markets. Both headline and core CPI rates are expected to edge lower, from 3.0% to 2.9% and from 3.3% to 3.2%, respectively. Yet the outcome remains uncertain due to possible tariff-induced price hikes—or, conversely, weaker consumption dampening inflation. With a surprise in either direction, Fed’s near-term policy path could be thrown into disarray. March is still widely expected to be a hold, but May is increasingly up in the air.
Adding to the US economic picture is the University of Michigan consumer sentiment survey, which carries added significance. The recent stock market selloff was closely tied to poor January consumer sentiment. Any notable deterioration in confidence could drive renewed risk aversion, compounding existing concerns about trade and growth.
Elsewhere, other key data, including UK GDP, Japan cash earnings, and household spending, will round out a relatively less busy week for global markets.
Here are some highlights for the week:
- Monday: Japan average cash earnings; Germany industrial production, trade balance; Swiss SECO consumer climate; Eurozone Sentix investor confidence.
- Tuesday: New Zealand manufacturing sales; Australia Westpac consumer sentiment, NAB business sentiment; Japan household spending, GDP final.
- Wednesday: Japan BSI manufacturing, PPI; US CPI, BoC rate decision.
- Thursday: Swiss PPI; Eurozone industrial production; US PPI, jobless claims.
- Friday: New Zealand BNZ manufacturing; Germany GDP final; UK GDP, production, goods trade balance; Canada manufacturing sales, wholesale sales; US U of Michigan consumer sentiment.
USD/JPY Daily Outlook
Daily Pivots: (S1) 147.26; (P) 147.73; (R1) 148.51; More...
Intraday bias in USD/JPY stays on the downside at this point. Sustained trading below 61.8% retracement of 139.57 to 158.86 at 146.32 will pave the way to 139.57 support. On the upside, 149.32 minor resistance will turn intraday bias neutral and bring consolidations again, before staging another fall.
In the bigger picture, price actions from 161.94 are seen as a corrective pattern to rise from 102.58 (2021 low), with fall from 158.86 as the third leg. Strong support should be seen from 38.2% retracement of 102.58 to 161.94 at 139.26 to bring rebound. However, sustained break of 139.26 would open up deeper medium term decline to 61.8% retracement at 125.25.
Bitcoin and Ethereum slide further as market reacts to strategic reserve letdown
Bitcoin has come under selling pressure in recent days, and slips closer to 80k mark. Ethereum, with a even worse outlook, has been struggling at its lowest levels since late 2023.
The broader cryptocurrency market has been in decline since early February, mirroring weak risk sentiment in the US financial markets. While there was a brief revival earlier this month after US President Donald Trump announced plans to establish a "strategic reserve" for cryptos, that optimism quickly faded once details of the initiative were revealed.
The market’s disappointment stemmed from the fact that the reserve would be funded solely by those seized in criminal and civil forfeiture cases, with no actual government purchases planned. Many investors had initially hoped for a more aggressive accumulation strategy.
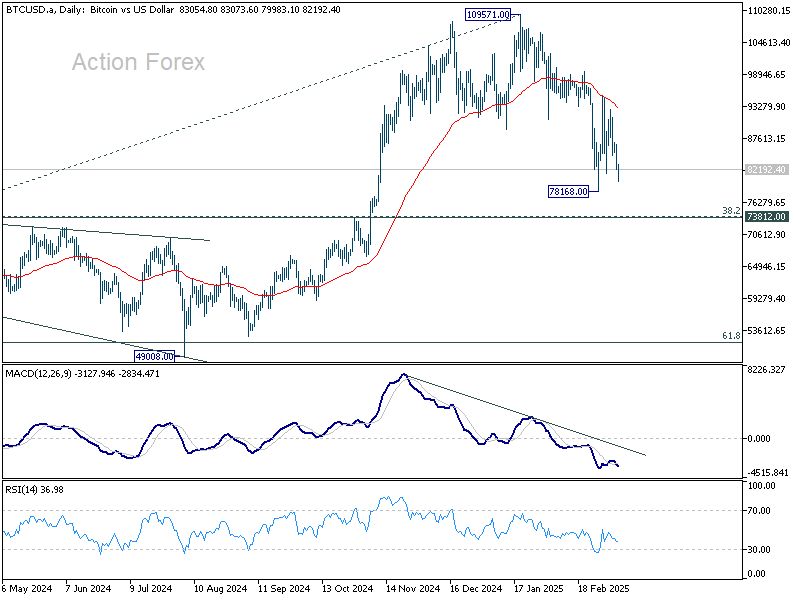
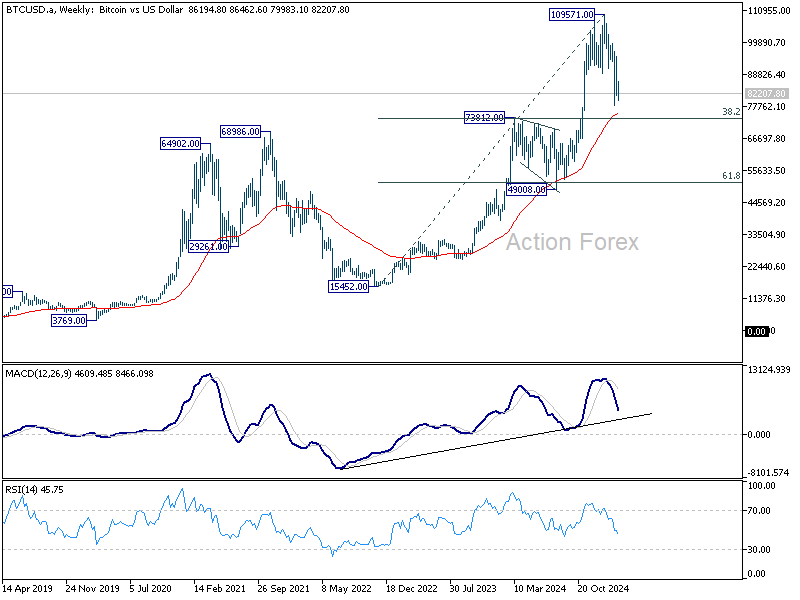
Technically, Bitcoin is still holding above 55 W EMA (now at 75052), which is slightly above 73812 cluster support (38.2% retracement of 15452. to 109571 at 73617). Price actions from 109571 high could still be seen as just forming a sideway consolidation pattern.
However, decisive break of 73k-75k support zone will argue that Bitcoin is already in a medium term downtrend, even still as correction. In the bearish case, Bitcoin could head to around 50k mark, that is, 49008 support and 61.8% retracement at 51405,before bottoming.
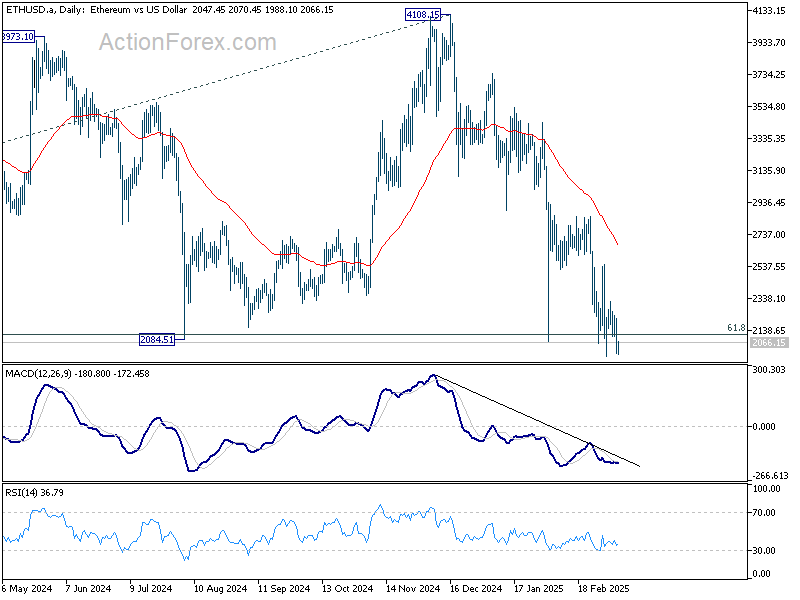
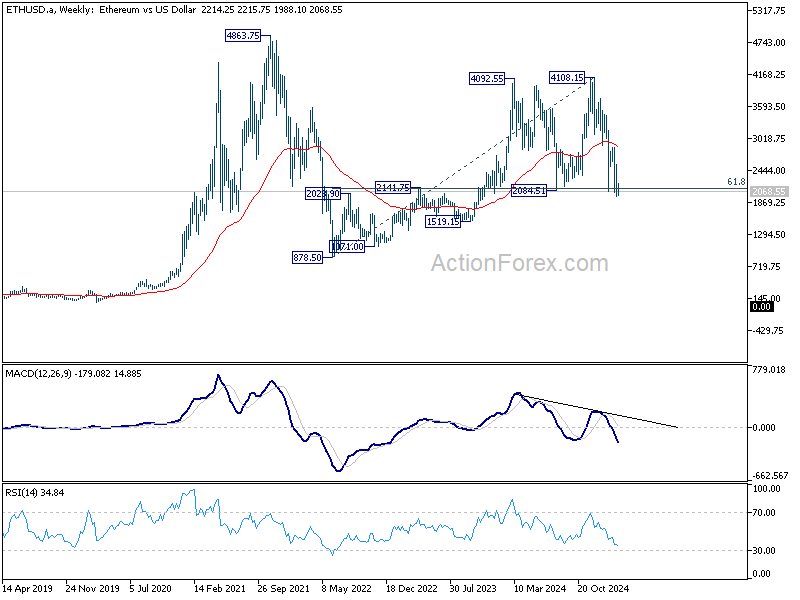
Outlook for Ethereum is even worse with focus now on 2000 psychological level, which is close to 2084.51 cluster support (61.8% retracement of 878.50 to 4108.15 at 2112.22).
Sustained break of this support zone around 2000 will raise the chance that fall from 4108.15 is the third leg of the decline from 4863.75 (2021 high). That could set up deeper medium term fall through 878.50 (2022 low).
Euro Strengthens—EUR/USD Begins Smooth Uptrend
Key Highlights
- EUR/USD started a fresh increase above the 1.0750 resistance zone.
- A short-term rising channel with support at 1.0800 on the 4-hour chart.
- GBP/USD surged above the 1.2850 and 1.2880 resistance levels.
- Crude oil prices dived below the $68.00 support zone.
EUR/USD Technical Analysis
The Euro started a decent increase above the 1.0750 resistance against the US Dollar. EUR/USD broke the 1.0800 and 1.0820 resistance levels.
Looking at the 4-hour chart, the pair settled above the 1.0800 level, the 100 simple moving average (red, 4-hour), and the 200 simple moving average (green, 4-hour). The pair even climbed above the 1.0850 zone before the bears appeared.
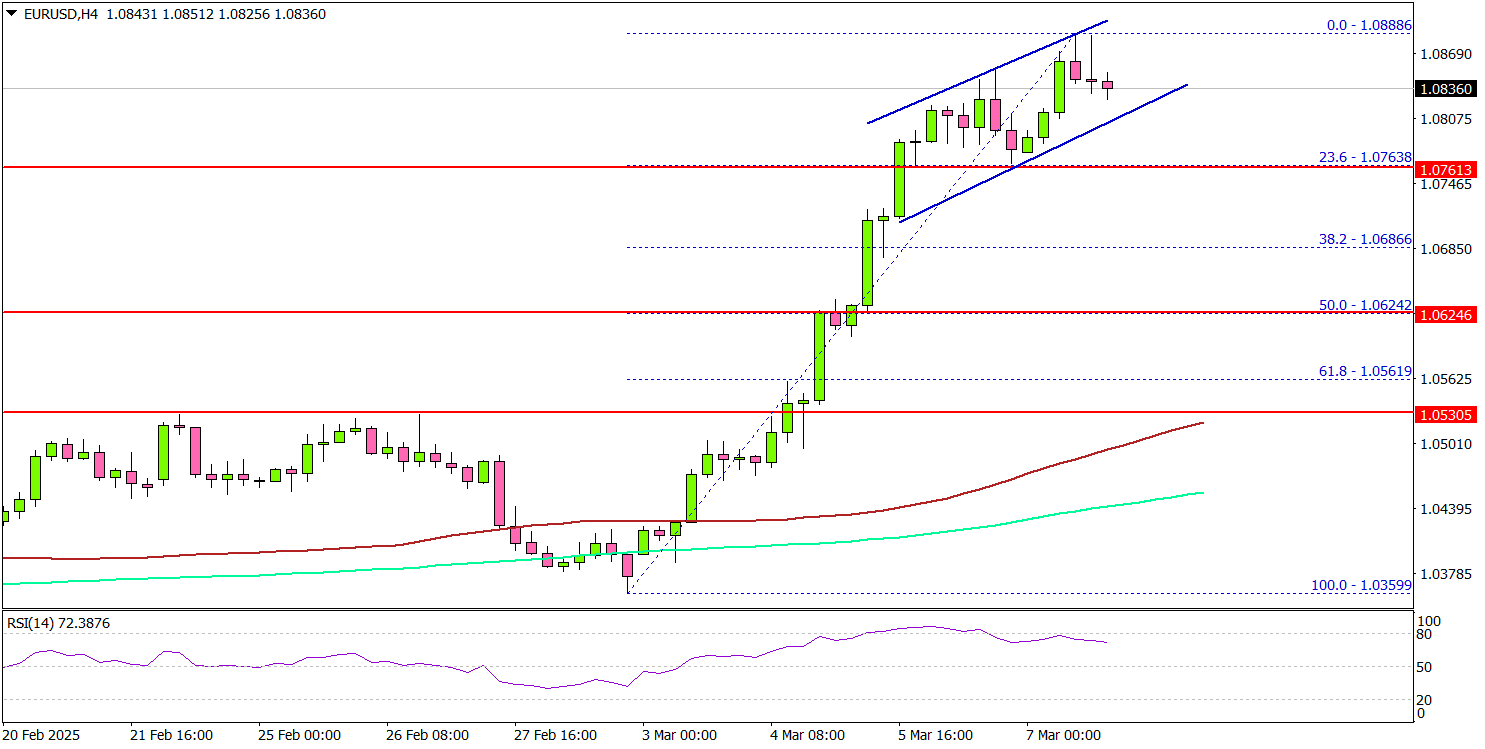
It tested the 1.0880 zone. On the upside, the pair seems to be facing hurdles near the 1.0880 level. The next major resistance is near the 1.0920 level.
The main resistance is now forming near the 1.0950 zone. Any more gains might send the pair toward the 1.1000 zone. On the downside, immediate support sits near the 1.0800 level. There is also a short-term rising channel with support at 1.0800 on the same chart.
The next key support sits near the 1.0765 level. Any more losses could send the pair toward the 1.0750 level. A close above the 1.0750 level could set the tone for another increase. In the stated case, the pair could even clear the 1.0720 resistance.
Looking at GBP/USD, the pair also started a decent increase and the pair even cleared the 1.2880 resistance zone.
Upcoming Economic Events:
- Germany’s Trade Balance for Jan 2025 - Forecast €21B, versus €20.7B previous.
Japan’s nominal wages rises 2.8% yoy in Jan, real wages fall -1.8% yoy
Japan’s labor cash earnings rose 2.8% yoy in January, falling short of market expectations of 3.2% yoy. Nominal wage growth remained positive for the 37th month.
Real wages, adjusted for inflation, fell -1.8% yoy, reversing two months of slight gains. The decline was largely driven by a sharp rise in consumer inflation.
The inflation rate used by the Ministry of Health, Labor and Welfare to calculate real wages—which includes fresh food prices but excludes rent—accelerated to 4.7% yoy, its highest level since January 2023.
Regular pay, or base salary, rose 3.1% yoy, the largest gain since 1992. This was overshadowed by a sharp -3.7% yoy decline in special payments, which consist largely of one-off bonuses.