Sample Category Title
XNG/USD Analysis: Natural Gas Price Hits Over Two-Year High
On 27 January, while analysing the natural gas chart, we noted that price fluctuations:
→ Were forming an ascending channel.
→ Identified $3.700 as a key resistance level.
As shown on the XNG/USD chart, bears had control in late January but failed to maintain their grip. Since then:
→ Natural gas prices have continued their upward trajectory.
→ The $3.700 level was breached, becoming part of a resistance zone with an upper boundary at $3.800, which later acted as support (as indicated by the arrow).
As a result, today, natural gas prices have surged to $4.800/MMBtu—the highest level since late December 2022.
Bullish Factors Driving the Market (According to Trading Economics):
→ Weather Conditions – A cold spell in the U.S. has increased demand for heating gas. Meteorologists predict a shift towards milder temperatures across 48 states in March.
→ LNG Exports – U.S. liquefied natural gas (LNG) exports have hit a record high of 15.6 billion cubic feet per day under the new administration. Meanwhile, trade uncertainties, including a potential slowdown in natural gas flows from Canada to the U.S., are raising concerns among market participants.
Technical Outlook for XNG/USD:
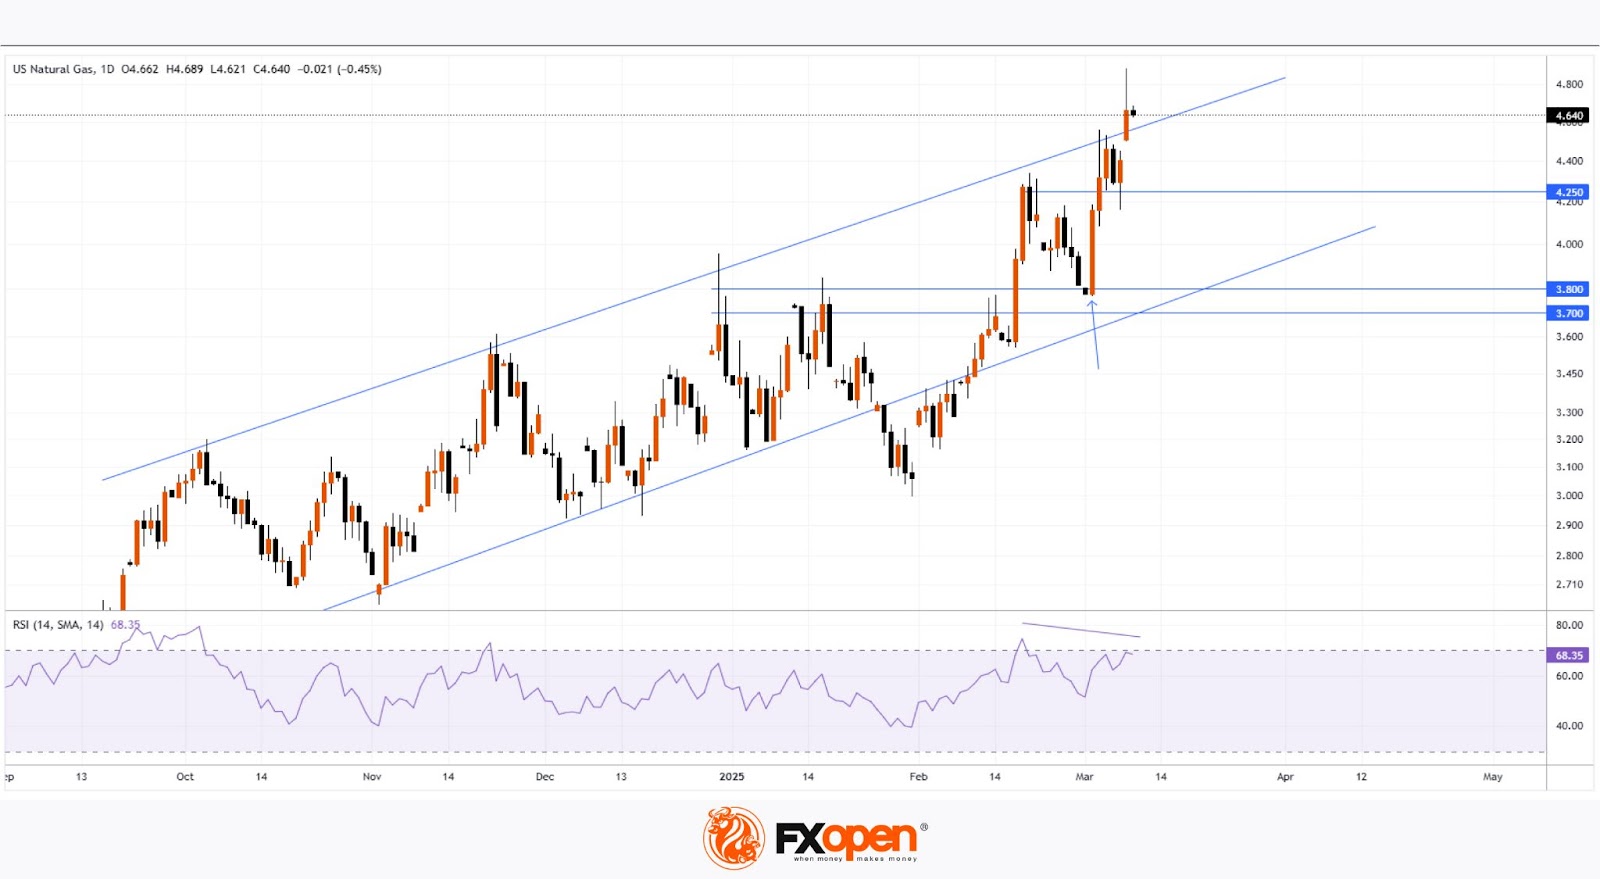
→ The market remains in an uptrend (indicated by blue lines), with the price now exceeding its upper boundary.
→ The RSI indicator is approaching overbought levels and may form a bearish divergence.
These observations suggest that the price is in a vulnerable position for a pullback. If this scenario unfolds, a test of the $4.250 area cannot be ruled out.
Start trading commodity CFDs with tight spreads. Open your trading account now or learn more about trading commodity CFDs with FXOpen.
This article represents the opinion of the Companies operating under the FXOpen brand only. It is not to be construed as an offer, solicitation, or recommendation with respect to products and services provided by the Companies operating under the FXOpen brand, nor is it to be considered financial advice.
AUD/USD and NZD/USD Could Continue Higher
AUD/USD is correcting gains from the 0.6365 zone. NZD/USD is showing positive signs and might attempt a fresh increase above 0.5720.
Important Takeaways for AUD USD and NZD USD Analysis Today
- The Aussie Dollar started a downside correction from 0.6365 against the US Dollar.
- There is a key bullish trend line forming with support at 0.6300 on the hourly chart of AUD/USD at FXOpen.
- NZD/USD is holding gains above the 0.5695 support zone.
- There was a break below a major bullish trend line with support at 0.5720 on the hourly chart of NZD/USD at FXOpen.
AUD/USD Technical Analysis
On the hourly chart of AUD/USD at FXOpen, the pair started a fresh increase from the 0.6185 support. The Aussie Dollar was able to clear the 0.62550 resistance to move into a positive zone against the US Dollar.
There was a close above the 0.6275 resistance and the 50-hour simple moving average. Finally, the pair tested the 0.6365 zone. A high was formed near 0.6363 and the pair is now correcting gains.
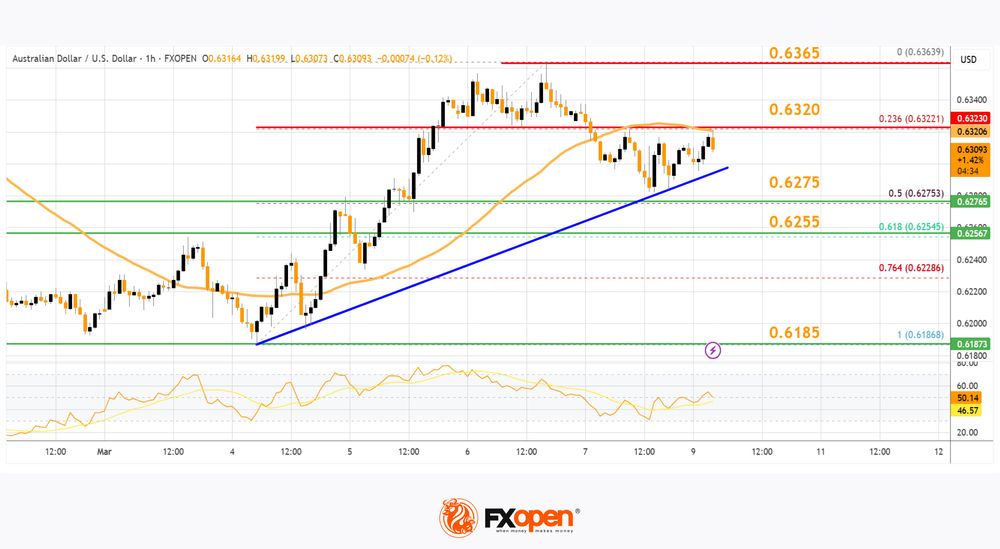
There was a move below the 0.6320 level. The pair declined below the 23.6% Fib retracement level of the upward move from the 0.6186 swing low to the 0.6363 high. On the downside, initial support is near a key bullish trend line at 0.6300.
The next major support is near the 50% Fib retracement level of the upward move from the 0.6186 swing low to the 0.6363 high at 0.6274.
If there is a downside break below the 0.6270 support, the pair could extend its decline toward the 0.6255 level. Any more losses might signal a move toward 0.6185.
On the upside, the AUD/USD chart indicates that the pair is now facing resistance near 0.6320. The first major resistance might be 0.6365. An upside break above the 0.6365 resistance might send the pair further higher.
The next major resistance is near the 0.6420 level. Any more gains could clear the path for a move toward the 0.6450 resistance zone.
NZD/USD Technical Analysis
On the hourly chart of NZD/USD on FXOpen, the pair started a steady increase from the 0.5585 zone. The New Zealand Dollar broke the 0.5635 resistance to start the recent increase against the US Dollar.
The pair settled above 0.5695 and the 50-hour simple moving average. It tested the 0.5760 zone and is currently correcting gains. The pair corrected lower below the 0.5720 level. The pair also traded below the 23.6% Fib retracement level of the upward wave from the 0.5595 swing low to the 0.5759 high.
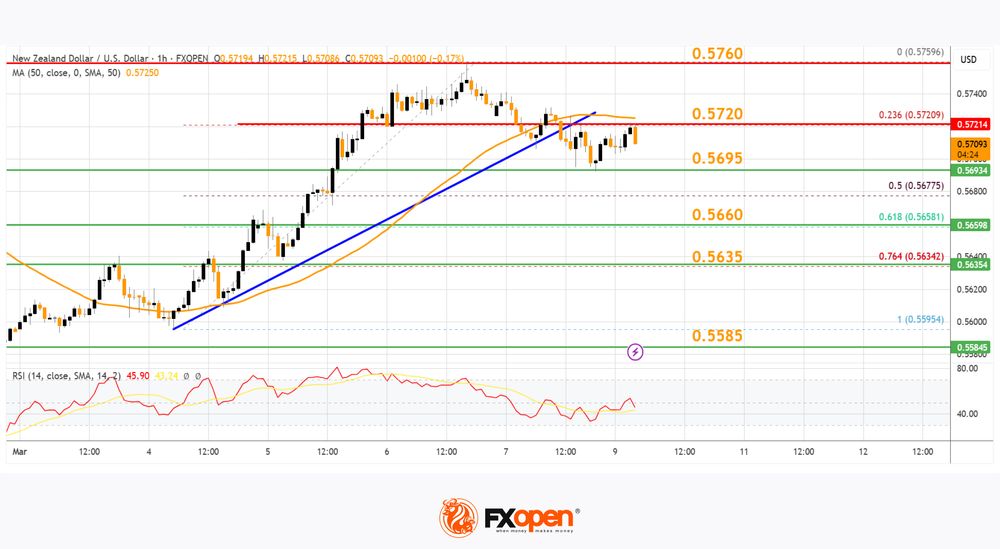
Besides, there was a break below a major bullish trend line with support at 0.5720. The NZD/USD chart suggests that the RSI is now below 50. On the downside, there is major support forming near 0.5695.
The next major support is near the 61.8% Fib retracement level of the upward wave from the 0.5595 swing low to the 0.5759 high at 0.5660.
If there is a downside break below the 0.5660 support, the pair might slide toward the 0.5635 support. Any more losses could lead NZD/USD in a bearish zone to 05585.
On the upside, the pair might struggle near 0.5720. The next major resistance is near the 0.5760 level. A clear move above the 0.5760 level might even push the pair toward the 0.5800 level. Any more gains might clear the path for a move toward the 0.5840 resistance zone in the coming days.
Trade over 50 forex markets 24 hours a day with FXOpen. Take advantage of low commissions, deep liquidity, and spreads from 0.0 pips. Open your FXOpen account now or learn more about trading forex with FXOpen.
This article represents the opinion of the Companies operating under the FXOpen brand only. It is not to be construed as an offer, solicitation, or recommendation with respect to products and services provided by the Companies operating under the FXOpen brand, nor is it to be considered financial advice.
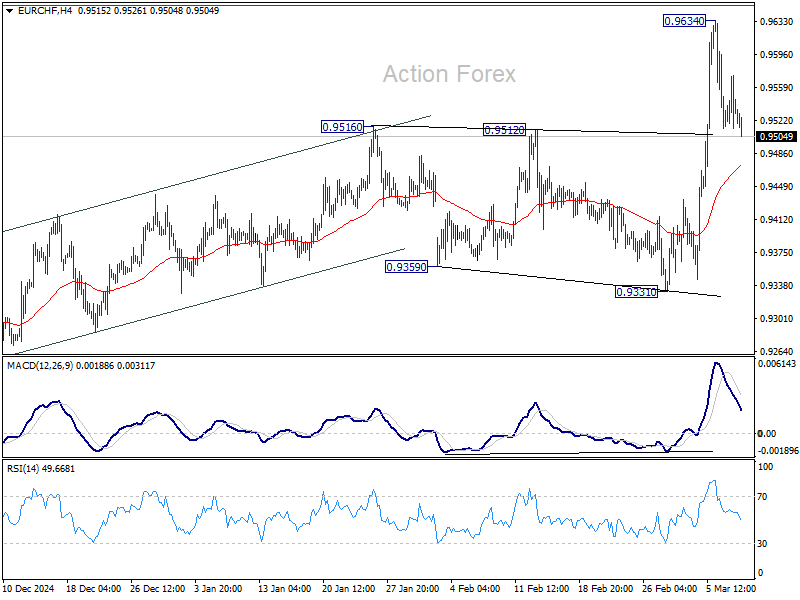
EUR/CHF Daily Outlook
Daily Pivots: (S1) 0.9484; (P) 0.9560; (R1) 0.9605; More....
Intraday bias in EUR/CHF remains neutral for consolidations below 0.9634. Further rally will be expected as long as 55 4H EMA (now at 0.9472) holds. On the upside, above 0.9634, and sustained trading above 0.9651 fibonacci level will pave the way back to 0.9928 key resistance next.
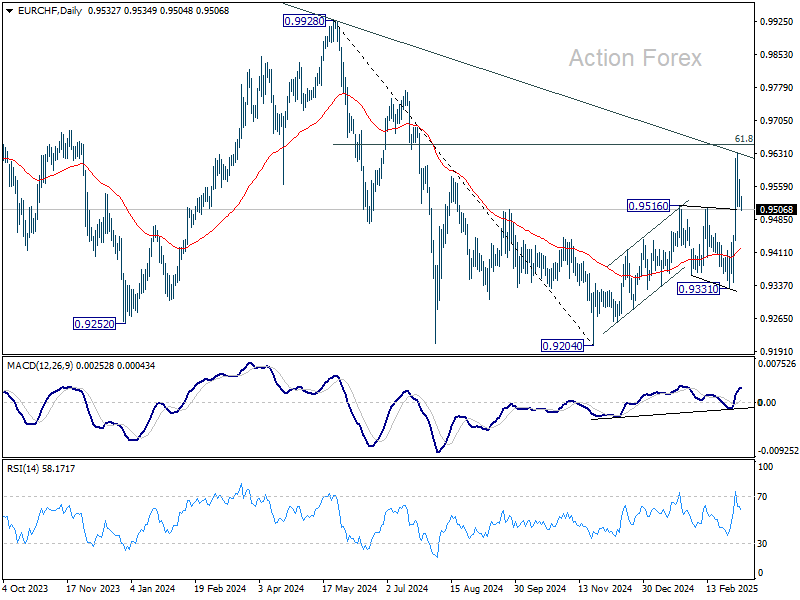
In the bigger picture, the strong break of 55 W EMA (now at 0.9482) is a medium term bullish sign. Sustained break trading above long-term falling channel resistance (at around 0.9620) would suggest that the downtrend from 1.2004 (2018 high) has bottomed at 0.9204. Stronger rally should then be see to 0.9928 key resistance at least.
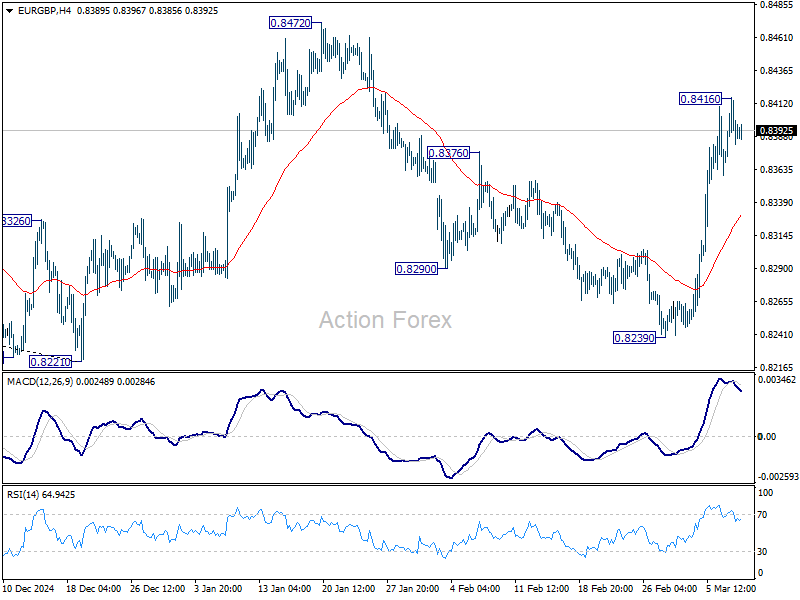
EUR/GBP Daily Outlook
Daily Pivots: (S1) 0.8361; (P) 0.8390; (R1) 0.8411; More...
Intraday bias in EUR/GBP stays neutral for consolidations below 0.8416 temporary top. Downside should be contained above 55 4H EMA (now at 0.8330) to bring another rise. Break of 0.8416 will resume the rally from 0.8239 to target 0.8472 resistance next.
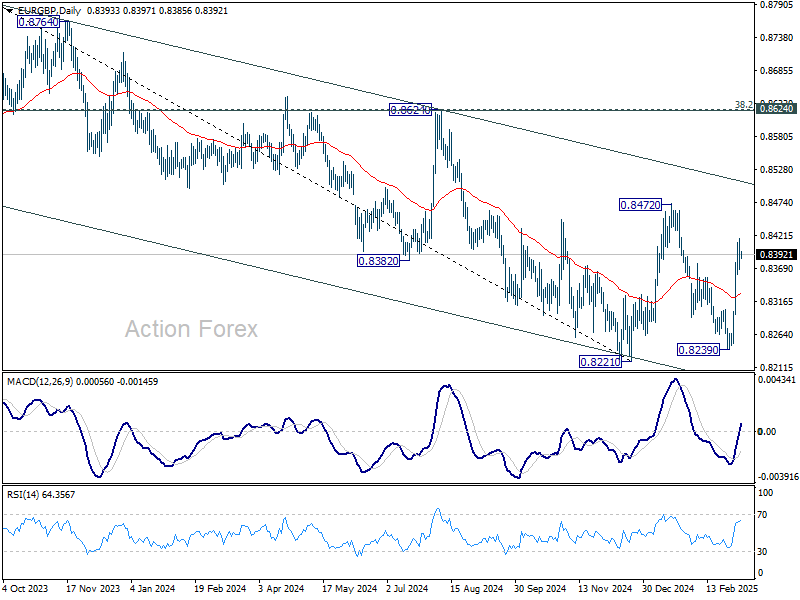
In the bigger picture, EUR/GBP is still bounded inside medium term falling channel. While rebound from 0.8221 might extend higher, it could still develop into a corrective pattern. Overall outlook will be neutral at best and down trend from 0.9267 (2022 high) could extend, at least until decisive break of channel resistance (now at 0.8511).
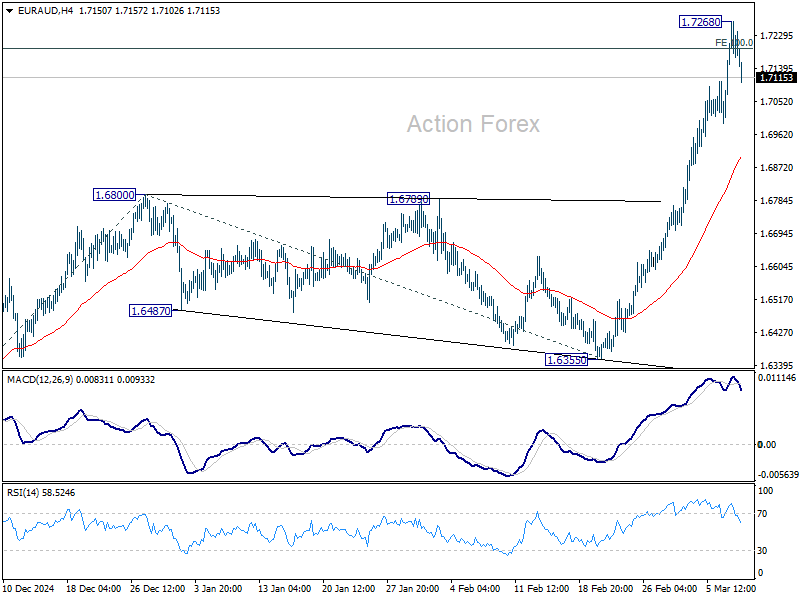
EUR/AUD Daily Outlook
Daily Pivots: (S1) 1.6944; (P) 1.7019; (R1) 1.7106; More...
A temporary top is formed at 1.7268 in EUR/AUD with current retreat and intraday bias is turned neutral for consolidations. downside should be contained by 55 4H EMA (now at 1.6902) to bring another rally. On the upside, sustained trading above 100% projection of 1.5963 to 1.6800 from 1.6355 at 1.7192 will target 161.8% projection at 1.7709 next.
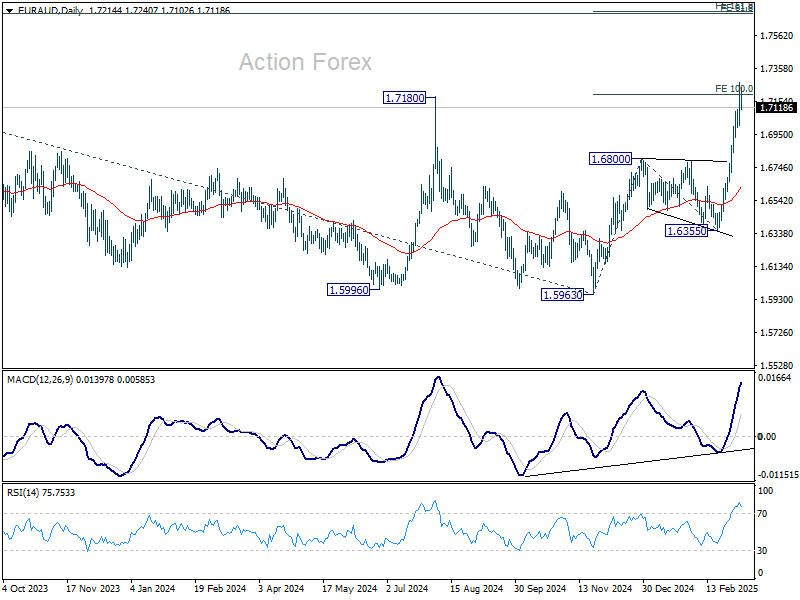
In the bigger picture, the breach of 1.7180 key resistance (2024 high) suggests that up trend from 1.4281 (2022 low) is resuming. Sustained trading above 1.7180 will confirm and target 61.8% projection of 1.4281 to 1.7062 from 1.5963 at 1.7682, which is also close to 61.8% retracement of 1.9799 (2020 high) to 1.4281 at 1.7691. For now, this will remain the favored case as long as 1.6355 support holds, even in case of deep pullback.
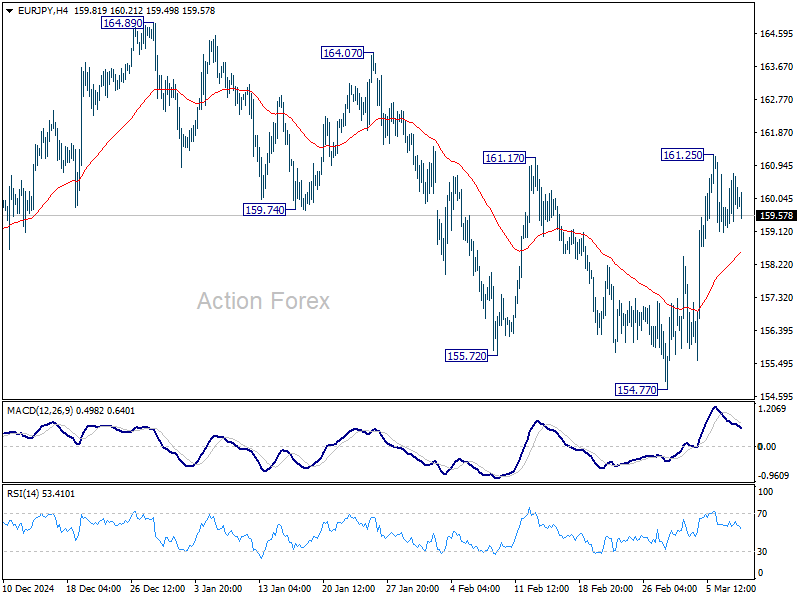
EUR/JPY Daily Outlook
Daily Pivots: (S1) 159.55; (P) 160.15; (R1) 161.03; More...
Intraday bias in EUR/JPY remains neutral for the moment. Overall development suggest that consolidation pattern from 154.40 is extending with another rising leg. On the upside, break of 161.25 will target 164.89 resistance.
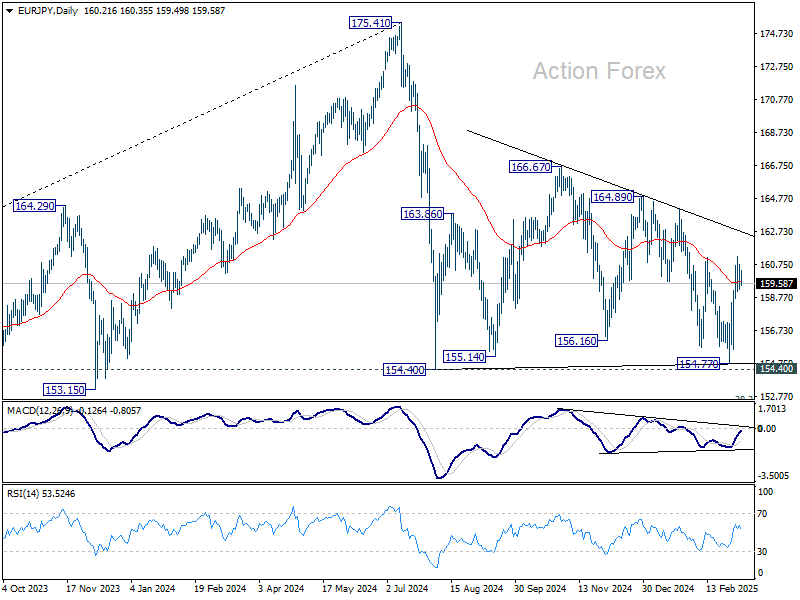
In the bigger picture, price actions from 175.41 are seen as correction to rally from 114.42 (2020 low). Strong support should be seen from 38.2% retracement of 114.42 to 175.41 at 152.11 to contain downside. However, sustained break of 152.11 will bring deeper fall even still as a correction.
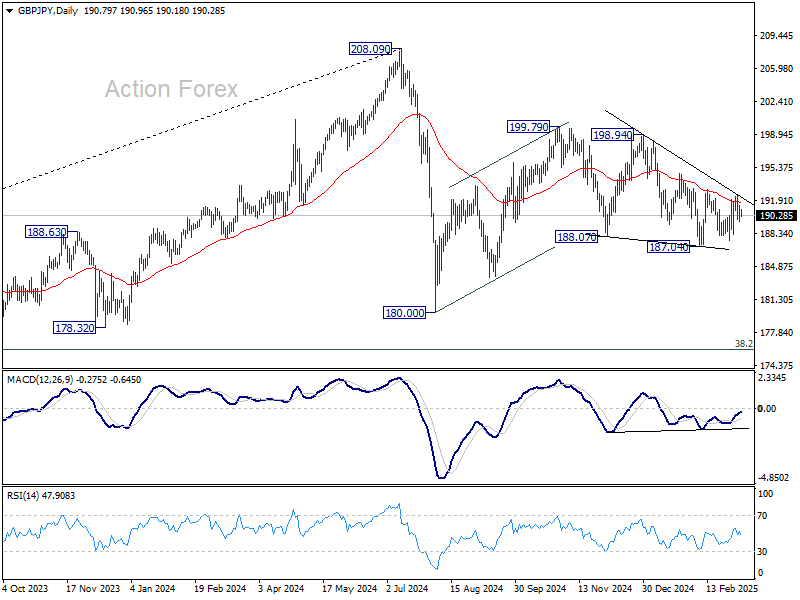
GBP/JPY Daily Outlook
Daily Pivots: (S1) 190.15; (P) 190.79; (R1) 191.93; More...
Intraday bias in GBP/JPY stays neutral as range trading continues. On the upside, firm break of 193.04 will resume the rebound from 187.04 to 194.73 resistance, and then 198.94. On the downside, firm break of 187.04 will extend the fall from 199.79 towards 180.00 support. Overall, corrective pattern from 180.00 might still be extending.
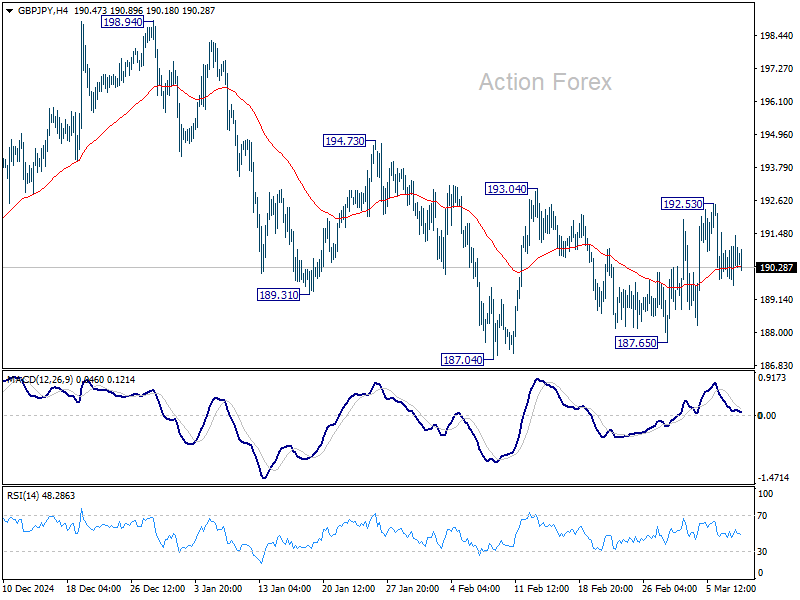
In the bigger picture, price actions from 208.09 are seen as a correction to rally from 123.94 (2020 low). Strong support should be seen from 38.2% retracement of 123.94 to 208.09 at 175.94 to contain downside. However, sustained break of 152.11 will bring deeper fall even still as a correction.
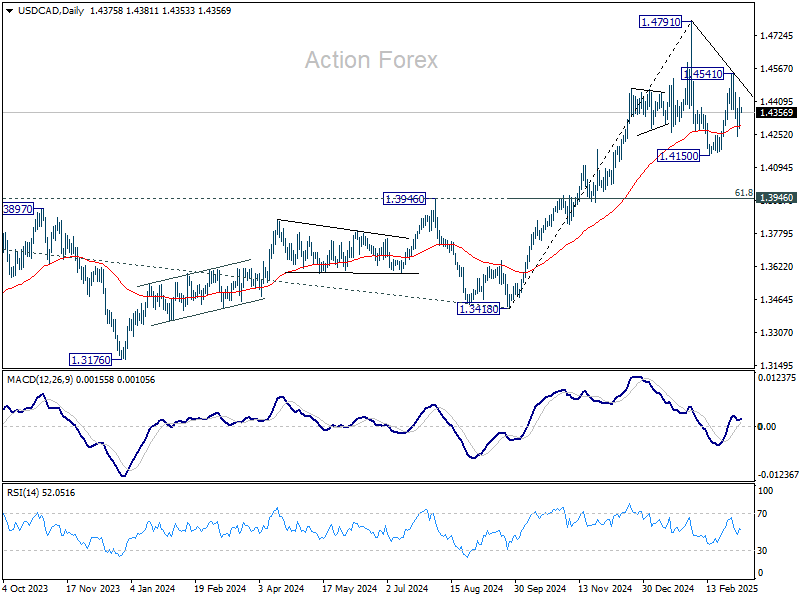
USD/CAD Daily Outlook
Daily Pivots: (S1) 1.4298; (P) 1.4362; (R1) 1.4445; More...
Intraday bias in USD/CAD remains neutral for the moment. Overall, corrective pattern from 1.4791 should still be extending. Break of 1.3248 will target 1.4150 support and possibly below. Meanwhile, break of 1.4541 will bring stronger rise back to retest 1.4791.
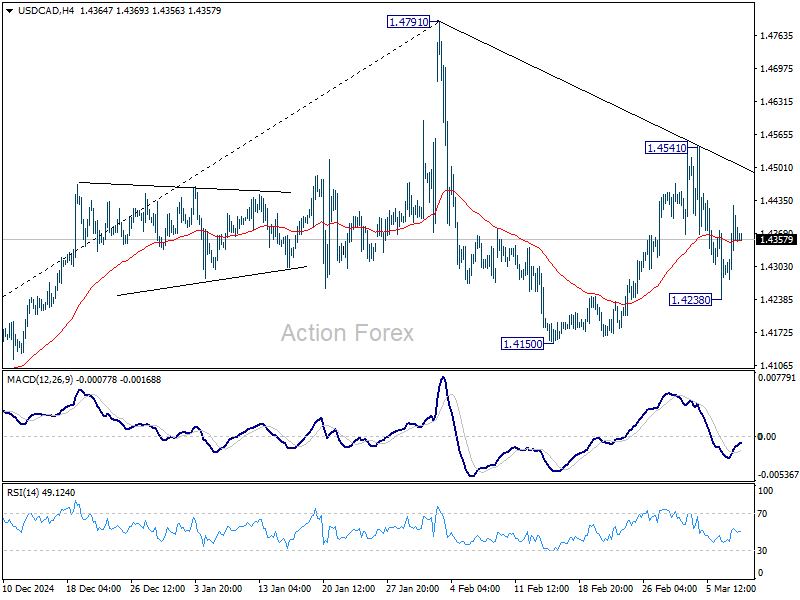
In the bigger picture, long term up trend is tentatively seen as resuming with prior breach of 1.4667/89 key resistance zone (2020/2015 highs). Next target is 100% projection of 1.2401 to 1.3976 from 1.3418 at 1.4993. This will remain the favored case as long as 1.3976 resistance turned support holds (2022 high), even in case of deep pullback.
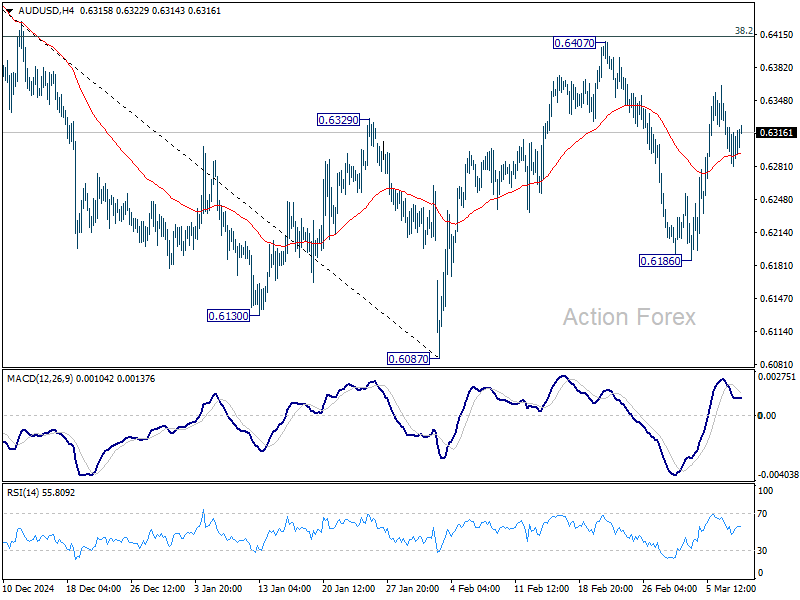
AUD/USD Daily Report
Daily Pivots: (S1) 0.6279; (P) 0.6308; (R1) 0.6335; More...
Intraday bias in AUD/USD remains neutral for the moment. On the downside, break of 0.6186 will target 0.6087 support first. Firm break there will resume whole decline from 0.6941. However, sustained trading above 38.2% retracement of 0.6941 to 0.6087 at 0.6413 will raise the chance of near term bullish reversal, and target 61.8% retracement at 0.6615 next.
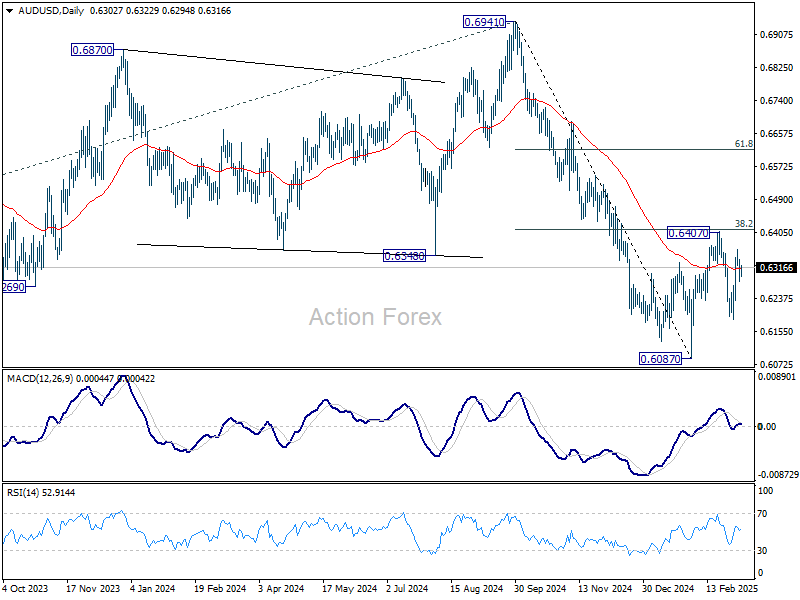
In the bigger picture, fall from 0.6941 (2024 high) is seen as part of the down trend from 0.8006 (2021 high). Next medium term target is 61.8% projection of 0.8006 to 0.6169 from 0.6941 at 0.5806. In any case, outlook will stay bearish as long as 55 W EMA (now at 0.6487) holds.
EUR/USD Daily Outlook
Daily Pivots: (S1) 1.0780; (P) 1.0834; (R1) 1.0888; More...
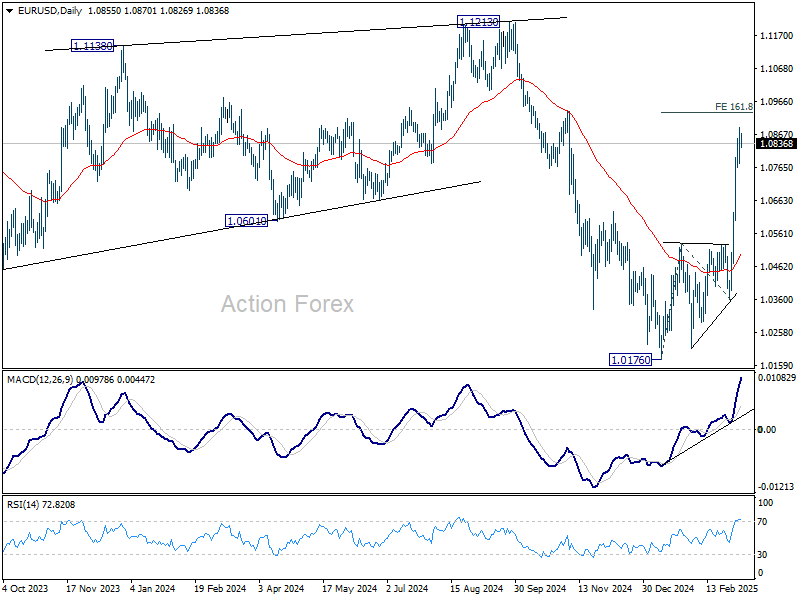
Intraday bias in EUR/USD remains mildly on the upside for the moment. Current rally from 1.0176 should target 161.8% projection of 1.0176 to 1.0531 from 1.0358 at 1.0932. Firm break there will pave the way back to 1.1274 key resistance next. On the downside, below 1.0764 minor support will turn bias neutral and bring consolidations, before staging another rise.
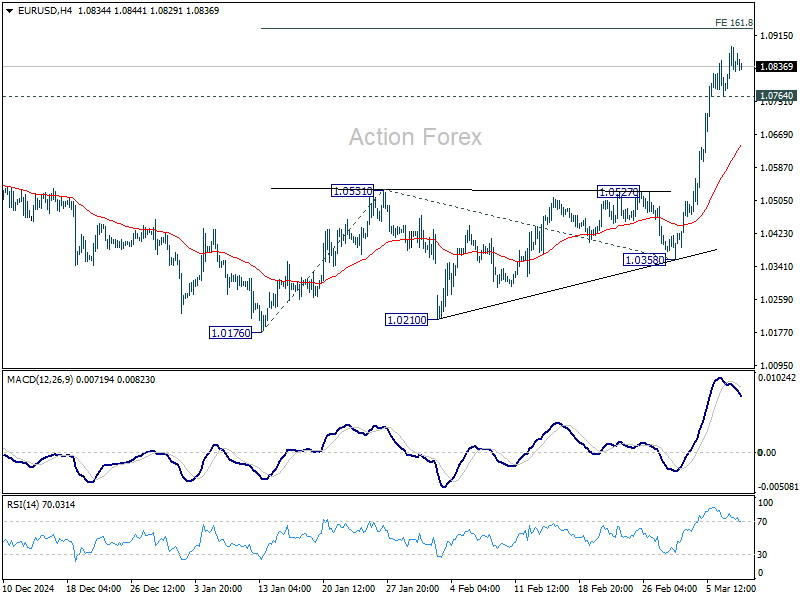
In the bigger picture, the strong break of 55 W EMA (now at 1.0675) suggests that fall from 1.1274 (2024 high) has completed as a three wave correction to 1.0176. Rise from 0.9534 is still intact, and might be ready to resume. Decisive break of 1.1274 will target 100% projection of 0.9534 to 1.1274 from 1.0176 at 1.1916. Also, that will send EUR/USD through a multi-decade channel resistance will carries larger bullish implication. This will now be the favored case as long as 1.0531 resistance turned support holds.