
Sample Category Title
From Bad to Worse
Donald Trump paused tariffs imposed on Canadian and Mexican imports two days after imposing 25% levies on its biggest trade partners’ products amid sanguine market reaction and resistance from trade partners. Beyond the politicians who refused to surrender, Walmart’s Chinese suppliers reportedly refused to take on a 10% price cut on their products while Europe is looking to replace Elon Musk’s Starlink in Ukraine by a European alternative, the French satellite operator Eutelsat, to make sure not to give the communication capabilities into the hands of a no-ally-anymore. Eutelsat’s stock price gained more than 500% in just a week. The European defense stocks consolidate gains near ATH levels as the European countries agreed to spend EUR 800bn for strengthening their defense and security – matching the amount Mario Draghi had suggested around last September to improve the continent’s tech, defense and green transition. On top, the European Central Bank (ECB) delivered another 25bp cut at yesterday’s meeting, as expected, but hinted that the rate cutting cycle could gently be coming to an end after six rate cuts as inflation is approaching their 2% policy target. Interestingly, the bank’s latest inflation and growth forecasts didn’t include the impact of the upcoming massive government spending – which should be balanced out by stricter-than-otherwise monetary policy to keep the price stability in check. The EURUSD advanced past the 61.8% Fibonacci retracement on the Trump selloff. The pair is now in a bullish trend with support to the latest rebound seen at 1.0725, the 200-DMA, 1.0678 - the minor 23.6% retracement and 1.0593 - the major 38.2% retracement above which the bullish trend will remain in play. On the equities front, the Stoxx 600 index closed yesterday near flat.
Across the Atlantic
Major US indices extended losses. The S&P500 lost 1.78%, tipped a toe below the 200-DMA and closed near this level, while the tech-heavy Nasdaq 100 slipped and closed below its own 200-DMA.. Is it a coincidence that Trump rolled back tariffs when the two major indices fell below their 200-DMA? Either way, the S&P500 is the worse performer among the world indices since his inauguration. Inside the US, the low volatility stocks amass capital, like Invesco’s QQLV ETF which includes names as Coca-Cola, Mondelez and AstraZeneca. The US dollar is on course for the biggest weekly drop in two years. The latest revision to Atlanta Fed’s GDPNow points at a 2.4% contraction in the US economy in Q1, and the recession bets are rising by the day. Polymarket now assigns a nearly 40% chance of a US recession this year, up from below 20% before Trump took office. Meanwhile, the Federal Reserve (Fed) is expected to cut rates more than previously expected to support the economy—as long as inflation allows. Will inflation allow? It’ll depend on tariffs.
Anyway, this morning, the market mood is a little bit better for the US equity futures. Broadcom jumped nearly 13% in the afterhours trading after announcing better-than-expected quarterly results and after giving a strong forecast. The announcement couldn’t come at a better time. The company’s stock price retreated to the 200-DMA yesterday on the back of a broad-based risk selloff that also pulled Nvidia to the lowest levels since September.
In China, Alibaba extended gains this week on claims that its new QwQ-32B model performs better than DeepSeek with less data. JD.com posted the biggest revenue growth in almost 3 years. And China announced the creation of a new bond platform to help the tech firms to issue onshore debt in a move to facilitate these firms access to capital. The CSI 300 is preparing the close the week on a positive note despite the tariff jitters.
Jobs day
Investors will be closely watching the US jobs data this Friday. The data is expected to print 159K new nonfarm job additions in February, with slowing wages growth on a monthly basis and a stable unemployment rate at 4%. But the risks are tilted to the downside due to the mass firing at the federal agencies and their implications for the broader economy. A set of softer-than-expected jobs figures could further weigh on the US dollar, while the worse-case-scenario for the markets would be a lower-than-expected NFP print combined with higher-than-expected wages growth – a combination that would leave the Fed facing a slowing economy with limited room to give support.
Trump Extends Temporary Tariff Exemption for Canada and Mexico
In focus today
In the euro area, we receive the final national accounts data for Q4, where attention will centre around the first release on hours worked and private consumption.
In the US, focus turns to the February Jobs Report. We forecast NFP growth to slow down to +120k (Jan. +143k) due to negative seasonality, federal layoffs and slowing immigration constraining the growth of labour supply.
In Denmark, January's industrial production figures are due, following a 4% increase in December, resulting in 8.6% annual growth in 2024. Unlike the broader European trend, Danish manufacturing remains strong, even excluding pharmaceuticals.
In Norway, January's manufacturing production figures are released. After a significant drop following the summer of last year, we experienced a sharp correction on the upside in December. Relatively weak leading indicators, such as the PMI and the Confidence indicator, mean that this may look like noise. The January figures will therefore provide us with important information on whether we will see a lift in activity into 2025 or if the leading indicators are correct.
In Sweden, the market will continue to digest the implications of the second consecutive monthly upside surprise to inflation which has lifted both CPIF and CPIF excl. Energy way above Riksbank's forecasts. This morning, the Debt Office releases the February borrowing requirement. So far, DO borrowing has been close to SEK 18bn higher than forecast in the November outlook.
China releases CPI for February on Sunday which is expected by consensus to drop to -0.4% y/y from 0.5% y/y in January. It will likely create some deflation headlines, but it is mostly due to effects from the Chinese New Year, which lifted some prices in January that then fall back in February again. Still no doubt, price pressures are still low in China. PPI is expected to stay in deflation with a drop of 2.1% in February from -2.3% in January.
Economic and market news
What happened yesterday
In the euro area, the ECB lowered its monetary policy rate by 25bp from 2.75% to 2.50%, as expected. Market focus is now on future meetings, with some ECB members expressing doubts about further rate cuts. The key here is the central bank's statement suggesting monetary policy is less restrictive, hinting that the end of rate cuts may be near, but uncertainty remains due to geopolitical tensions and economic factors. Inflation trends downwards, but low inflation could still be a concern. We expect the ECB to continue rate cuts at every meeting until September, lowering the rate to 1.5%, which is below market expectations. However, uncertainty has increased in the light of fiscal policy uncertainty in Europe.
In the US, initial jobless claims data fell -21k to 221k in March, thus coming in well below market expectation. Recurring claims rose 42k to 1.897m in the same period, close to expectation. This indicates that the US continues to host a relatively tight labour market.
In China, imports surprised to the downside, shrinking 8.4% in February, well below market expectations of an increase of 1%. Exports grew 2.3%, also below market expectation of 5.0%. The numbers reflect escalating trade tensions with the US as well as subdued activity during the Lunar New Year festival.
In Sweden, the topside surprise for flash CPIF ex energy (3.0% vs consensus, DB 2.7% and RB 2.4%), sent EUR/SEK further below the previous support area around 11.00. The market is increasingly drawing the conclusion that the Swedish easing cycle is over and done. That said, the main drivers for the krona recently are related to geopolitical events and potential US-EU rotation flows alongside US-Europe rates convergence, which we have discussed extensively in recent Reading the Markets Sweden. In all, it is hard to argue that the larger-than-anticipated SEK recovery vs the USD (and the EUR) is not aligned with the recent shift in fundamentals.
In Denmark, February's bankruptcy statistics showed an 8.8% decrease in bankruptcies compared to January. This corresponds to a decrease of 0.8% m/m in the 12-month moving average. The number of bankruptcies today is on par with the levels we saw in the years leading up to the pandemic, thus not ringing the alarm bells. Furthermore, following ECB's rate cut, Nationalbanken cut its key rate by 25bp bringing it to 2.10%, thereby keeping the yield spread fixed.
In geopolitics, President Trump has temporarily delayed import tariffs for all USMCA-compliant goods for Canada and Mexico under a new North American trade pact. The exemption is effective until 2 April. Earlier announced import tariffs of 25% on steel and aluminium are still scheduled to take effect on 12 March. On another note, Russia has warned French President Emmanuel Macron against using nuclear rhetoric and rejected European proposals to send NATO peacekeepers to Ukraine, viewing them as confrontational.
Equities: Global equities declined yesterday, led by the US, while Europe posted gains. This trend is familiar, as Europe has consistently outperformed the US year to date, a fact now widely acknowledged. However, there is more to this narrative. At least three significant forces are at play, and this does not include the ECB, who's meeting yesterday was uneventful. The focus is on US and European politics, which are moving in opposite directions. Investor confidence in politicians is shifting from the US to Europe - a trend that has just begun and may continue for some time. Furthermore, the macroeconomic environment remains stable, prompting investors to consider whether US politics will alter this situation. This has been the primary question for the past two weeks and will remain so in the coming period.
While headline figures for major equities highlight the current disparity between the US and Europe, the movements within underlying sectors reveal a more complex picture. In Europe, cyclical stocks are advancing, while defensives are declining, with industrial-related sectors outperforming due to anticipated infrastructure spending. Banks are significantly outperforming REITs with the two sectors find themselves at opposite ends of the performance spectrum, driven by the substantial rise in yields, which benefits banks but adversely affects REITs.
Conversely, in the US, defensives outperformed cyclicals by 2% yesterday and nearly 9% over the last month. Despite the perception that US equities are plummeting, it is important to note that defensive stocks have gained over the past month. This reflects the uncertainty associated with Trump's political approach and the fact that the macroeconomic environment has not deteriorated drastically. If the macroeconomic situation were truly weak, defensives would also be selling off. In the US yesterday, the Dow was down 0.99%, the S&P 500 fell by 1.8%, the Nasdaq declined by 2.6%, and the Russell 2000 decreased by 1.6%. This morning in Asia, the European/US dynamic described could be applied to Asia as well. Although the politics differ in form, goals, and intentions, the outcomes and conclusions regarding the starting point and potential for growth remains and equity markets the same. Consequently, Chinese and China-related equities are higher this morning, while Japanese equities are under pressure from the strong yen. European futures are lower this morning, aligning with the US movements after the European cash close yesterday. Meanwhile, US futures are higher.
FI: Rates markets recorded yet another volatile session yesterday, after the brutal sell-off on Wednesday. 10y Bunds touched above 2.9% in the morning but ended the day at 2.83% after a "last minute rally", which was just a couple of bp higher than Thursday's close. The ECB meeting yesterday was slightly more hawkish than expected, leaving all options for April, where we do not identify a preferred option at this stage. Markets are pricing 12bp for the April meeting and 44bp seen through the end of the year. Markets have repriced the terminal rate 20bp higher this week.
FX: EUR/USD has largely stabilized around the 1.08 mark following this week's rally, driven by the seismic shift in fiscal spending in the euro area. As expected, the ECB meeting had a limited impact after the widely anticipated 25bp rate cut. The topside surprise to Swedish inflation sent EUR/SEK further below the previous support area around 11.00. EUR/CHF erased some of Wednesday's significant gains alongside USD/JPY breaking back below 148. GBP continues to struggle in an environment characterised by elevated uncertainty and high volatility.
USD/CAD Daily Outlook
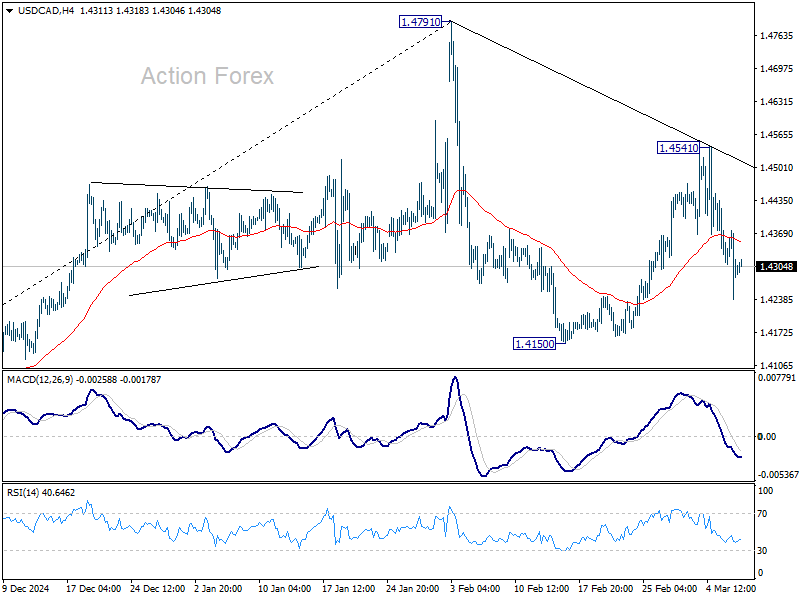
Daily Pivots: (S1) 1.4230; (P) 1.4303; (R1) 1.4368; More...
Intraday bias in USD/CAD remains mildly on the downside for the moment. Fall from 1.4541 is seen as the third leg of the corrective pattern from 1.4791. Deeper decline would be seen to 1.4150 low next. On the upside, though, above 1.4541 will resume the rebound from 1.4150 to retest 1.4791 high.
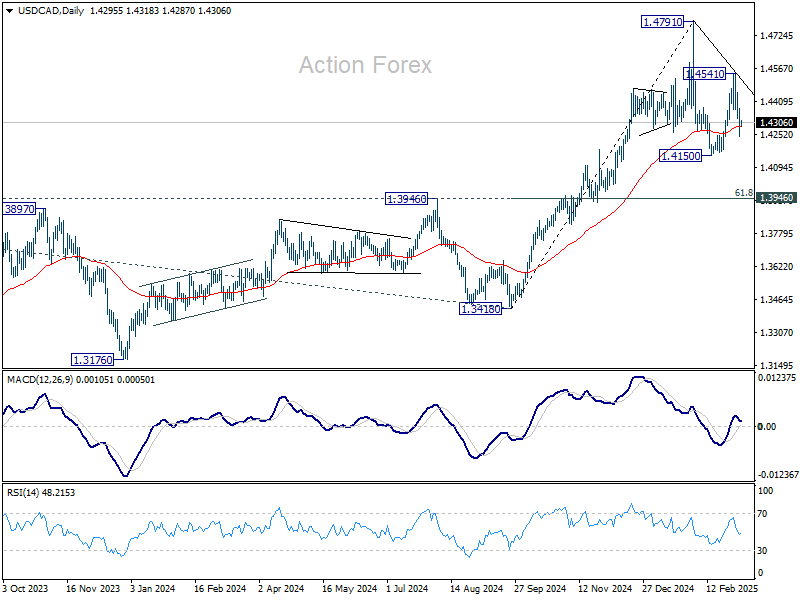
In the bigger picture, long term up trend is tentatively seen as resuming with prior breach of 1.4667/89 key resistance zone (2020/2015 highs). Next target is 100% projection of 1.2401 to 1.3976 from 1.3418 at 1.4993. This will remain the favored case as long as 1.3976 resistance turned support holds (2022 high), even in case of deep pullback.
AUD/USD Daily Report
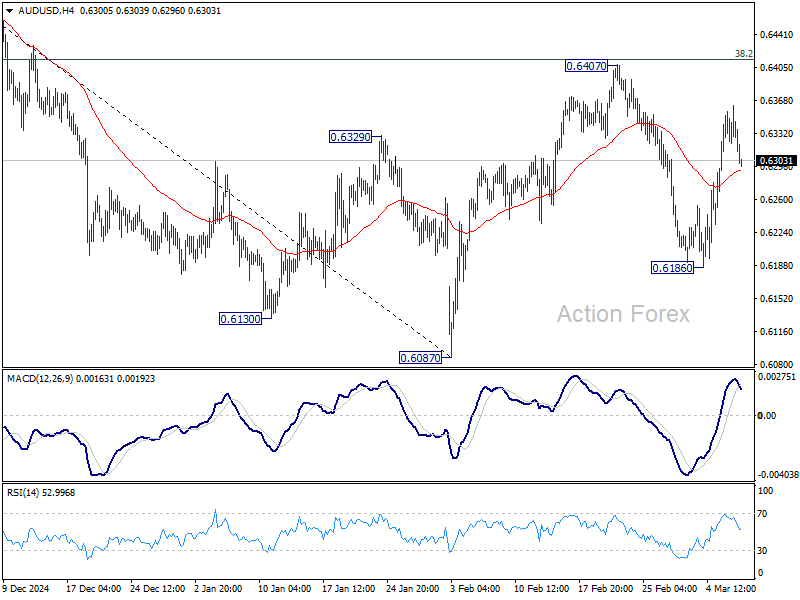
Daily Pivots: (S1) 0.6316; (P) 0.6340; (R1) 0.6357; More...
No change in AUD/USD's outlook as range trading continues. Intraday bias stays neutral for the moment. On the downside, below 0.6186 will resume the fall from 0.6407 to retest 0.6087 low. However, sustained trading above 38.2% retracement of 0.6941 to 0.6087 at 0.6413 will raise the chance of near term bullish reversal, and target 61.8% retracement at 0.6615 next.
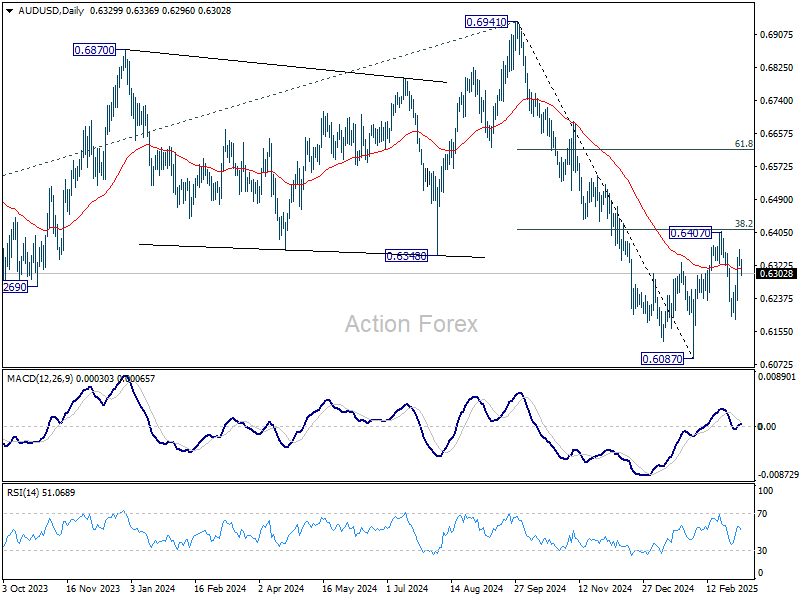
In the bigger picture, fall from 0.6941 (2024 high) is seen as part of the down trend from 0.8006 (2021 high). Next medium term target is 61.8% projection of 0.8006 to 0.6169 from 0.6941 at 0.5806. In any case, outlook will stay bearish as long as 55 W EMA (now at 0.6494) holds.
EUR/USD Daily Outlook
Daily Pivots: (S1) 1.0749; (P) 1.0801; (R1) 1.0837; More...
EUR/USD is losing upside momentum after hitting 1.0853 and intraday bias is turned neutral first. Downside of retreat should be contained above 55 4H EMA (now at 1.0593) to bring another rally. Above 1.0853 will resume the rise from 1.0176 to 161.8% projection of 1.0176 to 1.0531 from 1.0358 at 1.0932 next.
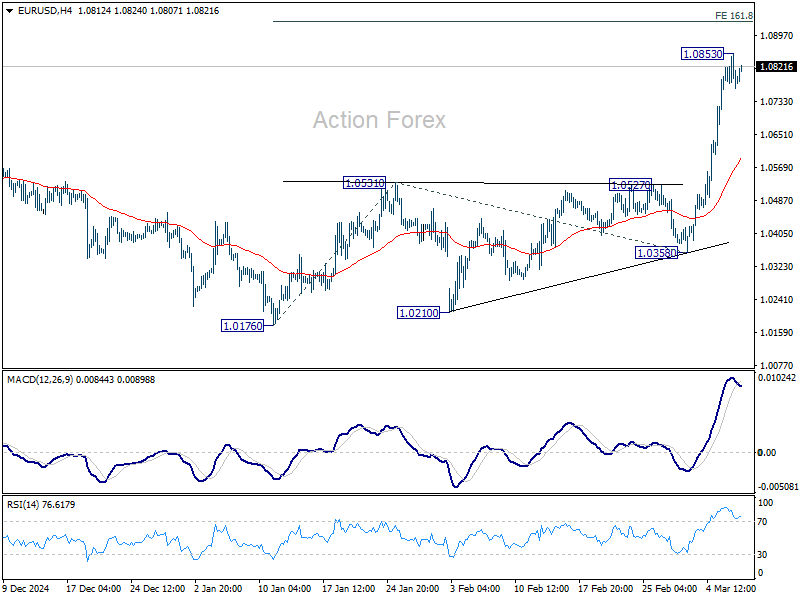
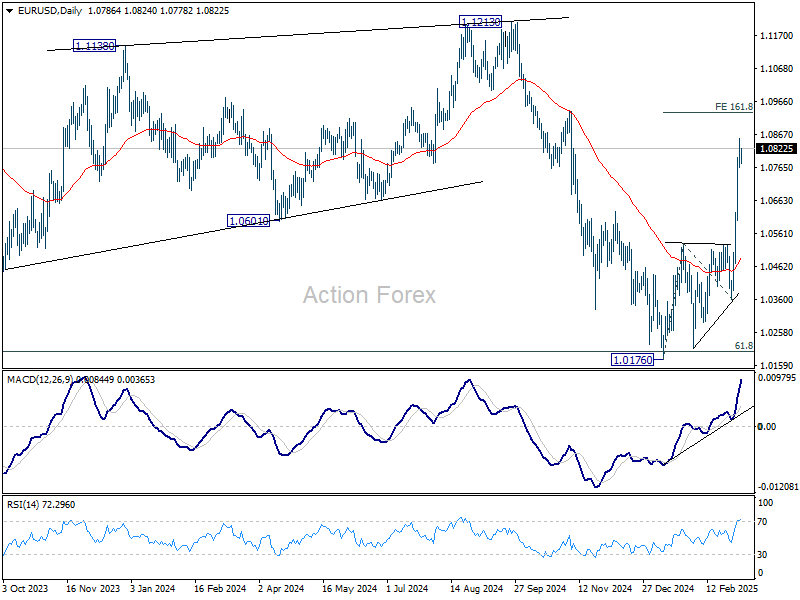
In the bigger picture, the strong break of 55 W EMA (now at 1.0668) suggests that fall from 1.1274 (2024 high) has completed as a three wave correction to 1.0176. That came after drawing support from 0.9534 (2022 low) to 1.1274 at 1.0199. Rise from 0.9534 is still intact, and might be ready to resume through 1.1274. This will now be the favored case as long as 1.0531 resistance turned support holds.
GBP/USD Daily Outlook
Daily Pivots: (S1) 1.2857; (P) 1.2891; (R1) 1.2915; More...
GBP/USD is losing momentum ahead of 61.8% retracement of 1.3433 to 1.2099 at 1.2923 and intraday bias is turned neutral first. Downside of retreat should be contained by 1.2715 resistance turned support to bring another rally. Sustained break of 1.2923 will pave the way back to 1.3433 high.
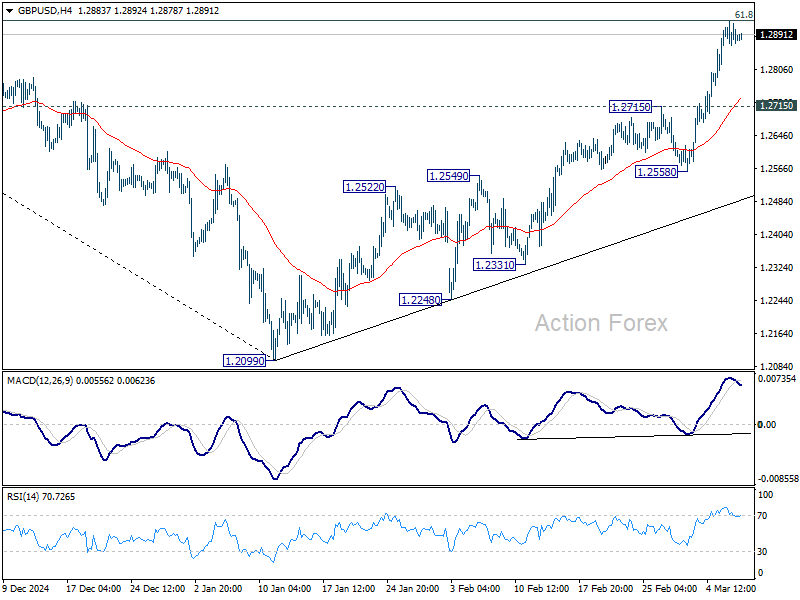
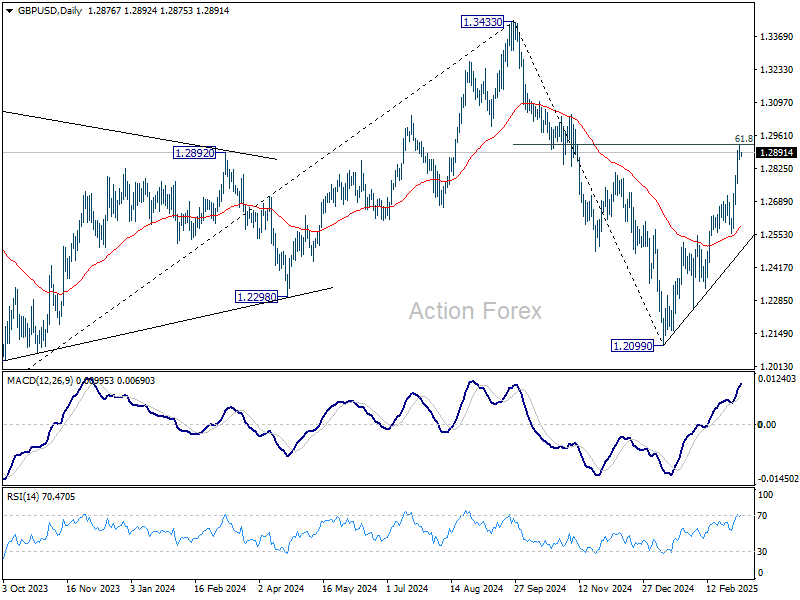
In the bigger picture, fall from 1.3433 (2024 high) should have completed at 1.2099 as a corrective move. Up trend from 1.3051 (2022 low) is still in progress but it's too early to say that it's resuming. Corrective pattern from 1.3433 could extend with one more down leg. But after all, eventual upside breakout is expected at a later stage.
USD/JPY Daily Outlook
Daily Pivots: (S1) 147.09; (P) 148.21; (R1) 149.11; More...
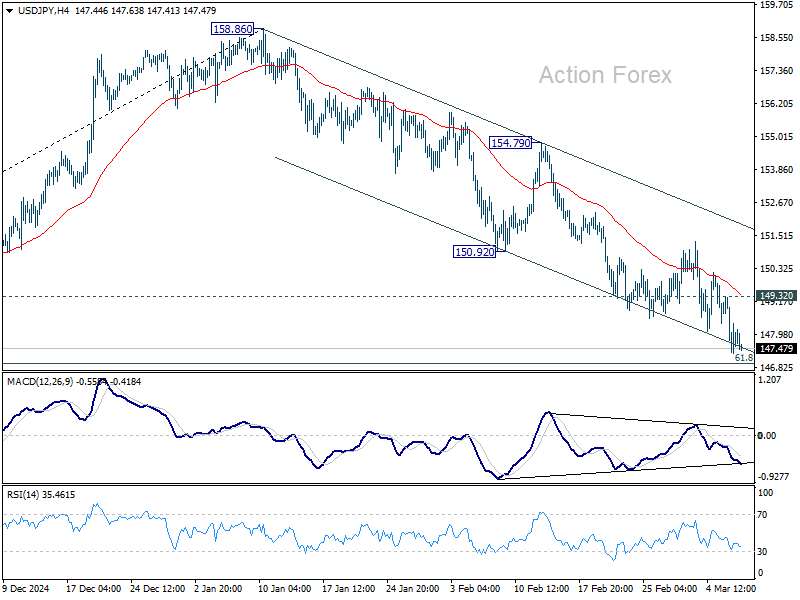
Intraday bias in USD/JPY remains on the downside for the moment. Fall from 158.86, as the third leg of the corrective pattern from 161.94 high, is in progress for 61.8% retracement of 139.57 to 158.86 at 146.32. Sustained break there will pave the way back to 139.57 low. On the upside, 149.32 minor resistance will turn intraday bias neutral and bring consolidations again, before staging another fall.
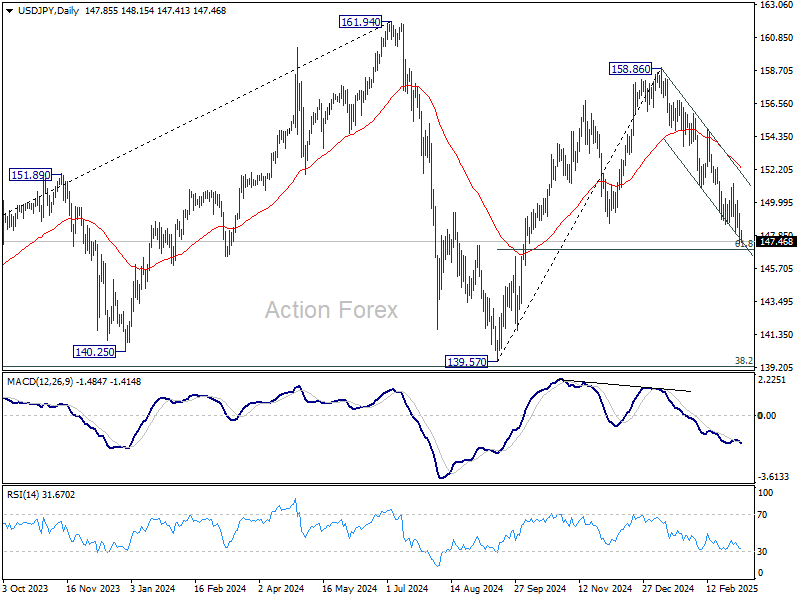
In the bigger picture, price actions from 161.94 are seen as a corrective pattern to rise from 102.58 (2021 low). In case of another fall, strong support should be seen from 38.2% retracement of 102.58 to 161.94 at 139.26 to bring rebound. However, sustained break of 139.26 would open up deeper medium term decline to 61.8% retracement at 125.25.
USD/CHF Daily Outlook
Daily Pivots: (S1) 0.8800; (P) 0.8863; (R1) 0.8900; More…
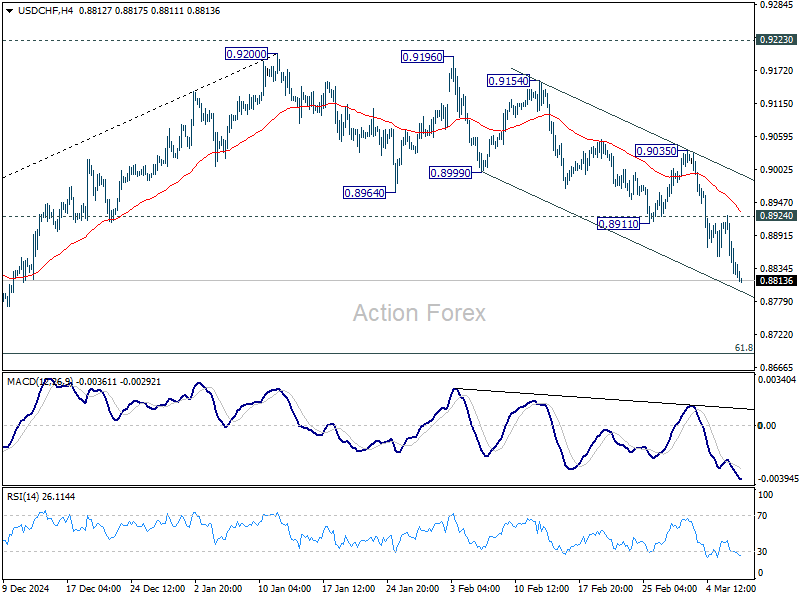
Intraday bias in USD/CHF remains on the downside for the moment. Rise from 0.8374 should have completed at 0.9222, after rejection by 0.9223 key resistance. Deeper fall should be seen to 61.8% retracement of 0.8374 to 0.9200 at 0.8690 next. On the upside, above 0.8924 minor resistance will turn intraday bias neutral first. But rise will now stay on the downside as long as 0.9035 resistance holds, in case of recovery.
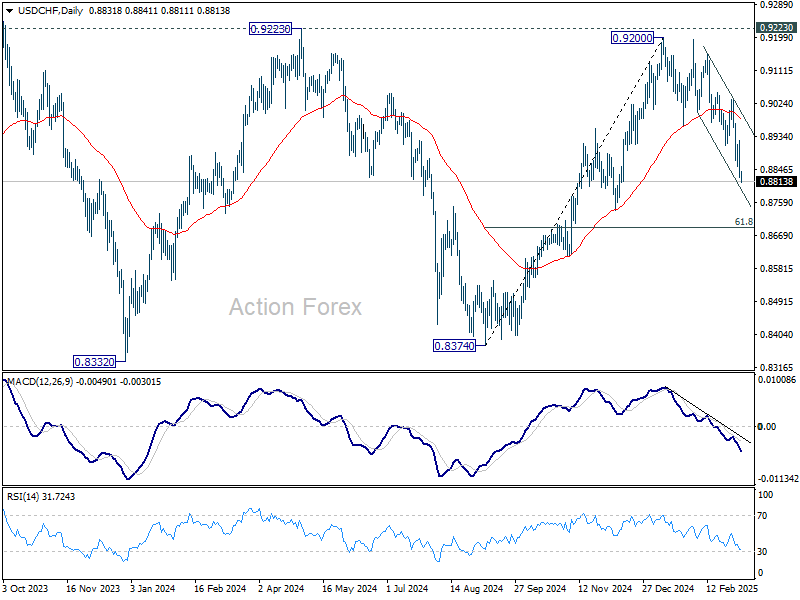
In the bigger picture, rejection by 0.9223 key resistance keep medium term outlook bearish. That is, larger fall from 1.0342 (2017 high) is not completed yet. Firm break of 0.8332 (2023 low) will confirm down trend resumption.
Risk Aversion Creeps Back as Markets Unconvinced by Trump’s Temporary Tariff Exemptions
Risk sentiment in the forex markets appears to be tilting towards risk aversion in Asian trading, marking a shift from the broad Dollar selloff earlier in the week. Overnight, US President Donald Trump granted temporary tariff exemptions for Canadian and Mexican goods under the USMCA, delaying a full-scale implementation until April 2. While this provided some relief for Canadian Dollar, overall market sentiment remained fragile, with major US equity indexes closing in the red, led by losses in NASDAQ.
The temporary exemption covers roughly 50% of Mexican imports and 38% of Canadian imports. However, Trump's move has done little to inspire confidence, as markets remain skeptical about his erratic trade policies. Investors have become wary of his inconsistent messaging—one day insisting on strict tariff enforcement, the next day granting exemptions. This unpredictability has left traders cautious, unsure of how to position for potential future shifts in trade policy.
Despite the tariff delay, risk-sensitive currencies like Australian and New Zealand Dollars have come under renewed selling pressure in Asia. The broader market focus has shifted toward the April 2 deadline, when Trump’s proposed “reciprocal tariffs” are set to take effect. These tariffs will target foreign nations that impose import taxes on US goods, keeping trade war fears firmly in play.
Adding to market unease is the upcoming US non-farm payrolls report. With sentiment already on shaky ground, any significant weakness in the jobs data could deepen risk aversion. While a weaker NFP might increase expectations for a Fed rate cut, traders are growing concerned that deteriorating labor market conditions could signal a sharper economic slowdown. This dynamic suggests that even rising Fed cut bets may not be enough to offset broader recession fears.
So far for the week, Dollar remains the worst-performing currency, struggling to find any solid footing. Canadian Dollar follows closely as the second weakest, alongside Australian Dollar. On the stronger side, Euro continues to outperform, driven by optimism over fiscal expansion plans in Europe. Sterling and Swiss Franc are also holding firm, while Yen and Kiwi are settling in the middle.
In Asia, the time of writing, Nikkei is down -2.07%. Hong Kong HSI is down -0.06%. China Shanghai SSE is up 0.15%. Singapore Strait Times is down -0.01%. Japan 10-year JGB yield is up 0.023 at 1.535. Overnight, DOW fell -0.99%. S&P 500 fell -1.78%. NASDAQ fell -2.61%. 10-year yield rose 0.021 to 4.286.
NFP in focus: NASDAQ and S&P 500 at risk of deeper correction
US markets are standing on precarious footing, with investors attention on the February non-farm payrolls report due later in the day. There has been noticeable anxieties surrounding the impact of fiscal and trade policies changes. A set of weaker-than-expected NFP data could be taken as another signal of swift deceleration in the economy and rattle market sentiment further.
Cooldown in the job market might prompt Fed to resume rate cuts earlier. Markets are currently pricing in 53% chance of a 25bps rate cut in March, reflecting growing belief that Fed will need to act sooner rather than later. However, the immediate market response to downside surprises may not be relief over monetary easing but rather heightened concerns about the pace of economic weakening, given recent policy uncertainties and trade disruptions.
Markets anticipate 156k increase in NFP for February, up from 143k in January. The unemployment rate is forecast to remain at 4.0%, while average hourly earnings should hold steady at 0.3% m/m.
The latest indicators paint a mixed picture: ISM Manufacturing PMI Employment subindex dropped to 47.6 from 50.3, while ISM Services PMI Employment inched up to 53.9 from 52.3. Meanwhile, ADP Employment reading of 77k missed last month’s 186k, and the 4-week moving average of jobless claims rose to 224k—its highest level so far this year.
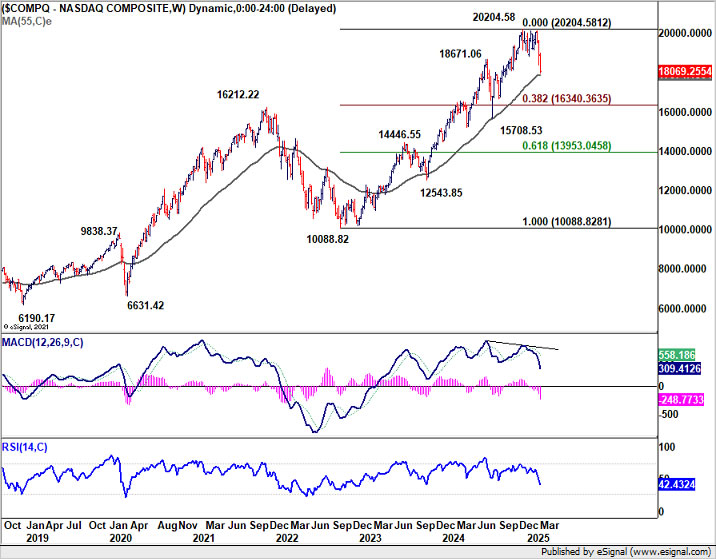
Technically, NASDAQ has been sliding for two consecutive weeks, now testing its 55-week EMA at 17,874.13. A decisive break below this level would confirm that the index is at least in a correction relative to the broader uptrend from the 10,088.82 low in 2022. The next key support to watch is the 38.2% Fibonacci retracement of 10,088.82 to 20,204.58, which comes in at 16,340.36. Extended losses here could set a negative tone for broader U.S. equities.
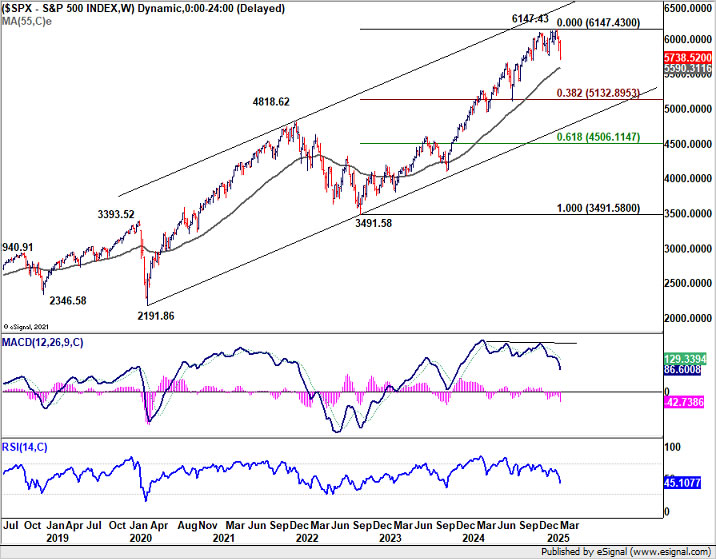
The S&P 500, still trading comfortably above its 55-week EMA at 5,590.31, may follow in the NASDAQ’s footsteps if sentiment sours further. Should the index breach this EMA convincingly, it would likely confirm that the fall from 6,147.43 is a correction of the uptrend from the 3,491.58 low in 2022. This scenario would set a 38.2% retracement target around 5,132.89, marking a significant downside pivot.
Overall, whether today’s NFP meets, misses, or exceeds expectations, the market’s reaction will hinge on how investors interpret the labor data in the context of looming trade uncertainties and weakening growth momentum. A softer reading could drive near-term Fed cut bets higher but might also deepen concerns that the U.S. economy is losing steam, thereby raising the stakes for traders and policymakers alike.
Technically, NASDAQ is now eyeing 55 W EMA (now at 17874.13) with the extended decline in the past two weeks. Sustained break there will confirm that it's at least in correction to the up trend from 10088.82 (2022 low). Next target will be 38.2% retracement of 10088.82 to 20204.58 at 16340.36.
Extended selloff in NASDAQ could be a prelude to the similar development in S&P 500. While it's still well above 55 W EMA (now at 5590.31), sustained break there will align the outlook with NASDAQ. Fall from 6147.43 would then be correcting the up trend from 3491.58 (2022 low) at least, and target 38.2% retracement of 3491.58 to 6147.43 at 5132.89.
Fed’s Waller: No immediate rate cut, but open to future easing
Fed Governor Christopher Waller suggested that another rate cut at the next FOMC meeting is unlikely, but he remains open to further easing down the line.
“I would’t say at the next meeting, but could certainly see [cuts] going forward," he noted. Waller particularly highlighted the February inflation report and the evolving impact of trade policies as key factors in shaping the Fed’s outlook.
Waller acknowledged the challenges in assessing the economic effects of tariffs, citing changing economic conditions and President Trump’s harder trade stance as factors complicating policy decisions.
He noted that evaluating the impact of tariffs is more difficult this time, adding, “It’s very hard to eat a 25% tariff out of the profit margins.”
Fed’s Bostic: Economy in flux, no rush to adjust policy
Atlanta Fed President Raphael Bostic emphasized the high level of uncertainty in the US economy due to evolving policies under the Trump administration. With inflation, trade policies, and government spending all in flux, he suggested that meaningful clarity may not emerge until "late spring or summer". Given this, he reiterated "We'll have to just sort of really be patient."
Speaking overnight, he described the situation as being in "incredible flux," with rapid shifts in trade and fiscal policies making it difficult to predict economic trends. Given this backdrop, Bostic urged caution, stating, "You've got to be patient and not want to get too far ahead."
He noted that just this week, there have been significant swings in expectations regarding economic policy. "If I was waiting before to see and get a clear signal about where the economy is going to go, I'm definitely waiting now," he said.
BoE’s Mann: Larger rate cuts needed as global spillovers worsen
BoE MPC member Catherine Mann argued that recent monetary policy actions have been overshadowed by “international spillovers.” Financial market volatility, particularly from cross-border shocks, has disrupted traditional policy signals, making "founding premise for a gradualist approach to monetary policy is no longer valid".
Mann said that larger rate cuts, like the 50bps reduction she supported at the last BoE meeting, would better "cut through this turbulence" and provide clearer guidance to the economy.
She believes that a more decisive policy stance would help steer inflation expectations and stabilize economic conditions, rather than allowing uncertainty to linger with smaller, incremental moves.
Despite her stance, the BoE opted for a smaller 25bps rate cut in its latest decision, with Mann and dovish member Swati Dhingra being outvoted 7-2.
China’s exports rise 2.3% yoy, imports fall -8.4% yoy
China’s exports rose just 2.3% yoy to USD 539.9B in the January–February period, coming in below forecasts of 5.0% yoy and down sharply from December’s 10.7% yoy.
Meanwhile, imports sank -8.4% yoy to USD 369.4B, missing expectations of 1.0% yoy growth and marking a noticeable drop from December’s 1.0% yoy.
As a result, trade balance resulted in USD 170.5B surplus exceeding projections of USD 147.5B.
Looking ahead
Germany factory orders, Swiss foreign currency reserves and Eurozone GDP revision will be released in European session. Later in the day, Canada employment will also be published alongside US NFP.
USD/CHF Daily Outlook
Daily Pivots: (S1) 0.8800; (P) 0.8863; (R1) 0.8900; More…
Intraday bias in USD/CHF remains on the downside for the moment. Rise from 0.8374 should have completed at 0.9222, after rejection by 0.9223 key resistance. Deeper fall should be seen to 61.8% retracement of 0.8374 to 0.9200 at 0.8690 next. On the upside, above 0.8924 minor resistance will turn intraday bias neutral first. But rise will now stay on the downside as long as 0.9035 resistance holds, in case of recovery.
In the bigger picture, rejection by 0.9223 key resistance keep medium term outlook bearish. That is, larger fall from 1.0342 (2017 high) is not completed yet. Firm break of 0.8332 (2023 low) will confirm down trend resumption.
NFP in focus: NASDAQ and S&P 500 at risk of deeper correction
US markets are standing on precarious footing, with investors attention on the February non-farm payrolls report due later in the day. There has been noticeable anxieties surrounding the impact of fiscal and trade policies changes. A set of weaker-than-expected NFP data could be taken as another signal of swift deceleration in the economy and rattle market sentiment further.
Cooldown in the job market might prompt Fed to resume rate cuts earlier. Markets are currently pricing in 53% chance of a 25bps rate cut in March, reflecting growing belief that Fed will need to act sooner rather than later. However, the immediate market response to downside surprises may not be relief over monetary easing but rather heightened concerns about the pace of economic weakening, given recent policy uncertainties and trade disruptions.
Markets anticipate 156k increase in NFP for February, up from 143k in January. The unemployment rate is forecast to remain at 4.0%, while average hourly earnings should hold steady at 0.3% m/m.
The latest indicators paint a mixed picture: ISM Manufacturing PMI Employment subindex dropped to 47.6 from 50.3, while ISM Services PMI Employment inched up to 53.9 from 52.3. Meanwhile, ADP Employment reading of 77k missed last month’s 186k, and the 4-week moving average of jobless claims rose to 224k—its highest level so far this year.
Technically, NASDAQ has been sliding for two consecutive weeks, now testing its 55-week EMA at 17,874.13. A decisive break below this level would confirm that the index is at least in a correction relative to the broader uptrend from the 10,088.82 low in 2022. The next key support to watch is the 38.2% Fibonacci retracement of 10,088.82 to 20,204.58, which comes in at 16,340.36. Extended losses here could set a negative tone for broader U.S. equities.
The S&P 500, still trading comfortably above its 55-week EMA at 5,590.31, may follow in the NASDAQ’s footsteps if sentiment sours further. Should the index breach this EMA convincingly, it would likely confirm that the fall from 6,147.43 is a correction of the uptrend from the 3,491.58 low in 2022. This scenario would set a 38.2% retracement target around 5,132.89, marking a significant downside pivot.
Overall, whether today’s NFP meets, misses, or exceeds expectations, the market’s reaction will hinge on how investors interpret the labor data in the context of looming trade uncertainties and weakening growth momentum. A softer reading could drive near-term Fed cut bets higher but might also deepen concerns that the U.S. economy is losing steam, thereby raising the stakes for traders and policymakers alike.
Technically, NASDAQ is now eyeing 55 W EMA (now at 17874.13) with the extended decline in the past two weeks. Sustained break there will confirm that it's at least in correction to the up trend from 10088.82 (2022 low). Next target will be 38.2% retracement of 10088.82 to 20204.58 at 16340.36.
Extended selloff in NASDAQ could be a prelude to similar development in S&P 500. While it's still well above 55 W EMA (now at 5590.31), sustained break there will align the outlook with NASDAQ. Fall from 6147.43 would then be correcting the up trend from 3491.58 (2022 low) at least, and target 38.2% retracement of 3491.58 to 6147.43 at 5132.89.