
Sample Category Title
China’s exports rise 2.3% yoy, imports fall -8.4% yoy
China’s exports rose just 2.3% yoy to USD 539.9B in the January–February period, coming in below forecasts of 5.0% yoy and down sharply from December’s 10.7% yoy.
Meanwhile, imports sank -8.4% yoy to USD 369.4B, missing expectations of 1.0% yoy growth and marking a noticeable drop from December’s 1.0% yoy.
As a result, trade balance resulted in USD 170.5B surplus exceeding projections of USD 147.5B.
Fed’s Bostic: Economy in flux, no rush to adjust policy
Atlanta Fed President Raphael Bostic emphasized the high level of uncertainty in the US economy due to evolving policies under the Trump administration. With inflation, trade policies, and government spending all in flux, he suggested that meaningful clarity may not emerge until "late spring or summer". Given this, he reiterated "We'll have to just sort of really be patient."
Speaking overnight, he described the situation as being in "incredible flux," with rapid shifts in trade and fiscal policies making it difficult to predict economic trends. Given this backdrop, Bostic urged caution, stating, "You've got to be patient and not want to get too far ahead."
He noted that just this week, there have been significant swings in expectations regarding economic policy. "If I was waiting before to see and get a clear signal about where the economy is going to go, I'm definitely waiting now," he said.
USD/JPY Under Pressure—Recovery Could Be Capped by Resistance
Key Highlights
- USD/JPY extended losses and traded below the 149.20 support.
- A key bearish trend line is forming with resistance at 149.30 on the 4-hour chart.
- GBP/USD surged above the 1.2800 and 1.2850 resistance levels.
- The US nonfarm payrolls could change by 160K in Feb 2025.
USD/JPY Technical Analysis
The US Dollar remained in a bearish zone below 150.00 against the Japanese Yen. USD/JPY extended losses below 149.20 to move further in a bearish zone.
Looking at the 4-hour chart, the pair settled below the 149.20 level, the 100 simple moving average (red, 4-hour), and the 200 simple moving average (green, 4-hour). The pair even dived below the 148.50 support zone.
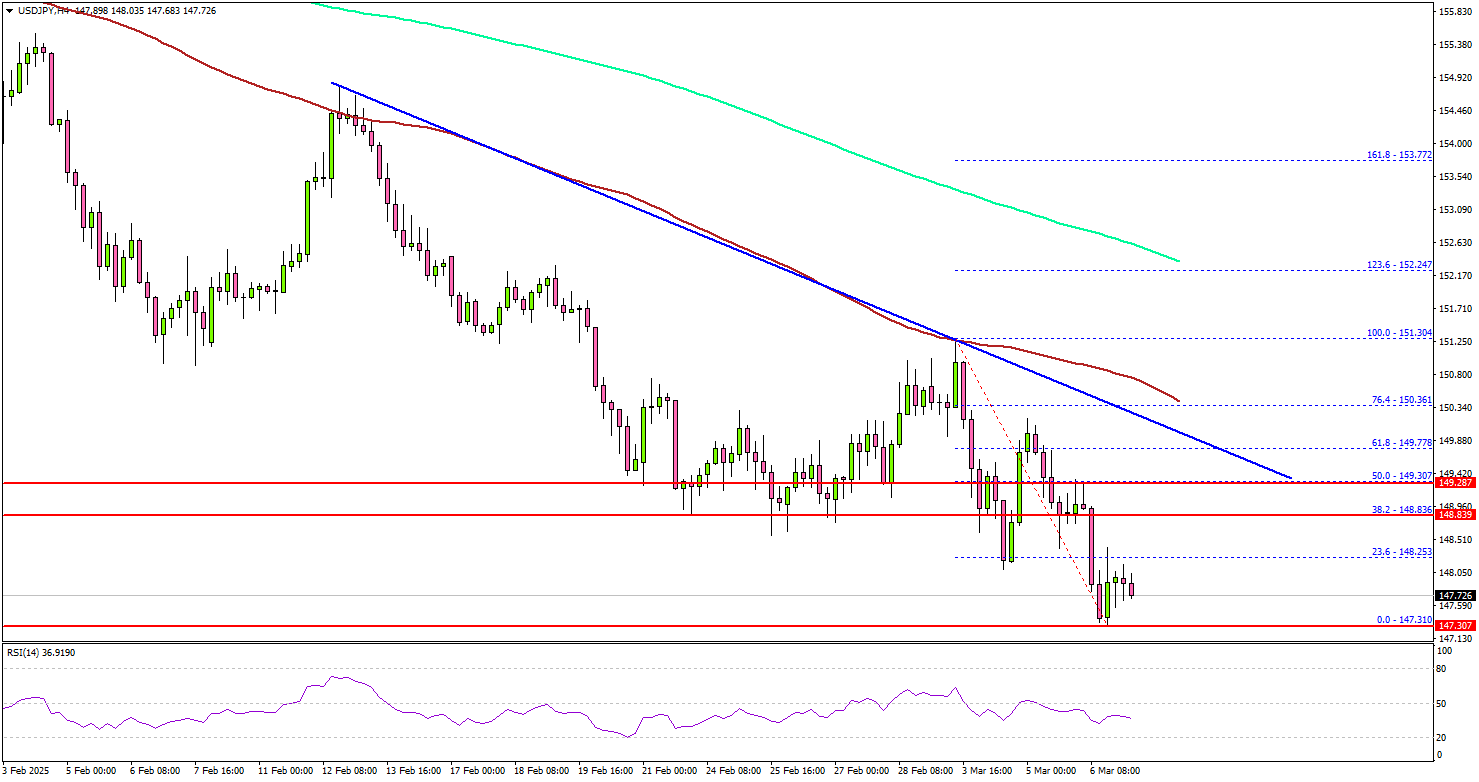
It tested the 147.30 zone. On the downside, immediate support sits near the 147.20 level. The next key support sits near the 146.50 level. Any more losses could send the pair toward the 145.00 level.
On the upside, the pair seems to be facing hurdles near the 148.25 level. The next major resistance is near the 148.50 level. The main resistance is now forming near the 149.20 zone. There is also a key bearish trend line forming with resistance at 149.30 on the same chart.
A close above the 149.30 level could set the tone for another increase. In the stated case, the pair could even clear the 150.00 resistance.
Looking at GBP/USD, the pair also started a decent increase and the pair even cleared the 1.2850 resistance zone.
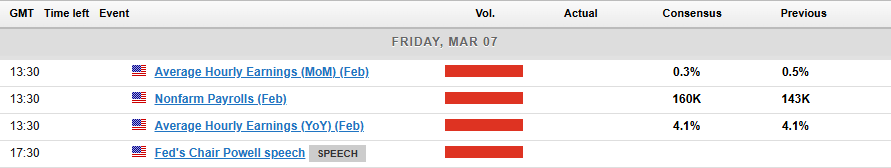
Upcoming Economic Events:
- US nonfarm payrolls for Feb 2025 – Forecast 160K, versus 143K previous.
- US Unemployment Rate April 2025 - Forecast 4.0%, versus 4.0% previous.
Fed’s Waller: No immediate rate cut, but open to future easing
Fed Governor Christopher Waller suggested that another rate cut at the next FOMC meeting is unlikely, but he remains open to further easing down the line.
“I would’t say at the next meeting, but could certainly see [cuts] going forward," he noted. Waller particularly highlighted the February inflation report and the evolving impact of trade policies as key factors in shaping the Fed’s outlook.
Waller acknowledged the challenges in assessing the economic effects of tariffs, citing changing economic conditions and President Trump’s harder trade stance as factors complicating policy decisions.
He noted that evaluating the impact of tariffs is more difficult this time, adding, “It’s very hard to eat a 25% tariff out of the profit margins.”
BoE’s Mann: Larger rate cuts needed as global spillovers worsen
BoE MPC member Catherine Mann argued that recent monetary policy actions have been overshadowed by “international spillovers.” Financial market volatility, particularly from cross-border shocks, has disrupted traditional policy signals, making "founding premise for a gradualist approach to monetary policy is no longer valid".
Mann said that larger rate cuts, like the 50bps reduction she supported at the last BoE meeting, would better "cut through this turbulence" and provide clearer guidance to the economy.
She believes that a more decisive policy stance would help steer inflation expectations and stabilize economic conditions, rather than allowing uncertainty to linger with smaller, incremental moves.
Despite her stance, the BoE opted for a smaller 25bps rate cut in its latest decision, with Mann and dovish member Swati Dhingra being outvoted 7-2.
Ancient History Rhyming
Parallels between the current situation and the late 2010s highlight the risks of undershooting the inflation target should a major global shock hit – something that is all too plausible now.
The national accounts and other recent key data have broadly tracked as expected. Growth is starting to improve as household incomes recover, though only modestly. Inflation and wages growth continue to decline a little faster than previously expected. Productivity growth disappointed and the labour market remained tight, both partly driven by the expansion in the care economy. Some elements of this set of outcomes are reminiscent of the period immediately before the pandemic. There are also important differences, and it might seem like B.C. (Before COVID) is ancient history. So this is probably a case of history rhyming rather than repeating. The parallels with those years may nonetheless point to some important risks around the outlook.
The late 2010s were not a great time for the Australian economy. Growth was disappointing, and inflation persistently undershot the RBA’s 2–3% target range, despite very low interest rates. Household demand was weak, with a rising tax take squeezing household incomes as the then federal government engaged in fiscal consolidation. Productivity growth was extremely weak in 2017/18 and 2018/19: as a graph in a recent speech by RBA Head of Economic Analysis Michael Plumb showed, much weaker than in the years either side of those two. And like the most recent few months, labour force participation reached a new peak in 2019, at the time the highest rate since records began in 1910.
Along with the drag from tax and fiscal consolidation, a few underlying causes of the sogginess in the late 2010s data suggest themselves. First, with wages growth low and high participation rates making labour plentiful, there just wasn’t much incentive for firms to economise on labour-saving technology, so of course labour productivity growth lagged. Second, the non-mining part of the economy had been squeezed to fit the mining investment boom. That boom was well and truly rolling off by 2018 – WA was effectively in recession. However, the rest of the economy simply could not bounce back quickly enough to fill the gap.
Turning to the current situation, we could see a similar failure to bounce back occurring as the ramp-up in the care economy ends. That suggests a risk to growth beyond the very near term. Judging by the minutes of its February meeting, the RBA Board seems to be alive to this risk. More broadly, the minutes seem to hint that the Board put more weight on the downside risks to growth beyond the very near term than the staff did. And whether they saw the parallels with the pre-pandemic period or not, the Board also seemed to understand the risks of undershooting the target when inflation had already surprised on the downside.
That risk of undershooting also helped drive the Board’s decision to cut the cash rate in February. The minutes and the Deputy Governor’s speech this week both described the results of a scenario where the cash rate was held unchanged at 4.35%, and inflation settled between 2.3% and 2.5%. This result was first noted in Deputy Governor Hauser’s Bloomberg TV interview, and the RBA probably wishes it was included in the Statement on Monetary Policy in the first place. It would certainly have clarified the explanation of the decision to cut despite not agreeing with the market path.
Notice, though, that the base-case was the staff forecasts, which are not entirely model-driven, while the ‘red swathe’ of the unchanged-rates scenario was the span of two very different economic models. So while the difference between 2.7% with 90bp of cuts and roughly 2.3% with no cuts seems like a lot of inflation sensitivity relative to history, perhaps the answer is that the staff forecast using the market path involved some upward judgement that the models did not incorporate.
All of this smacks of fine-tuning, as we have previously discussed. In his speech this week, Deputy Governor Hauser acknowledged the point and – as we had also highlighted – conceded that this was an outworking of the wording of the latest Statement on the Conduct of Monetary Policy. He also repeated the Governor’s comment in Parliament that aiming for the exact midpoint of the target range maximises the chances of actually landing in that range. This, too, is reminiscent of the late 2010s, when some commentators advocated ever more aggressive monetary policy action (fiscal and other levers never came into the discussion) to get inflation right to the midpoint.
As is usually the case though, this interpretation is based on a few unstated assumptions. First, it assumes that the risks around that forecast are symmetric. This is far from assured. Second, it assumes that the base-case forecast is unbiased. A bias need not be intentional: forecasting is hard, models are imperfect, and it is possible that when the wind blows one way, the monetary policy gunsight veers off-centre and needs correction.
Third, it assumes that the appropriate horizon over which to hit the target is the existing forecast horizon. But the length of the forecast horizon is typically determined by how far out your current (or past) approach produces reasonable forecasts. It could also be the optimal horizon to return inflation exactly to 2½% following a shock, taking the nature and duration of the shock and all other policy considerations into account. But if it were, that would be quite a coincidence.
With all those caveats in mind, the reality is that a lot of energy is going into finessing the last 0.2ppt of disinflation. As Deputy Governor Hauser also acknowledged this week, there are plenty of other uncertainties facing Australia that are way bigger than this one. This week marked the moment the US-led trade war went live, along with a major geopolitical realignment around Ukraine. Confidence in the US is already starting to crack, as both financial markets and consumer surveys show. That said, Australia is a small direct target for US tariff policy, and China is likely to stimulate its own economy to offset the tariff hit. The situation is incredibly fluid, though, and – more likely than not – negative for global growth. One wonders if an institution focused on fine-tuning will pivot quickly enough should the situation require it.
NFP Preview: February 2025 Jobs Report and US Dollar Impact
- The US Bureau of Labor Statistics will release the non-farm payroll (NFP) and jobs data for February 2025 on Friday, March 7th, 2025.
- Economists are predicting 170,000 jobs added and the unemployment rate holding steady at 4.0%.
- Key factors influencing February’s jobs report include potential federal job cuts, changes in trade policies, a strong services sector, and mild weather conditions.
- Technical analysis of the US Dollar Index (DXY) shows it at a crossroads, where to next?
The US Bureau of Labor Statistics is set to release the non-farm payroll and jobs data for February 2025 on Friday, March 7th, 2025.
Job Market Expectations for February
Economists predict 170,000 jobs were added in February, showing some improvement from January’s weaker result of 143,000 jobs. The unemployment rate is expected to stay at 4.0%, which is considered a healthy level given the current economic situation.
However, private payroll data raised concerns by showing only 77,000 new jobs, which fell short of expectations. This might mean the overall jobs report could also disappoint.
Average hourly earnings are expected to grow by 0.3% compared to the previous month, continuing the steady increase seen before. Wage growth is an important factor for policymakers because it shows how much pressure there is on inflation in the economy.
There are challenges ahead with concerns that tariff uncertainty and growth worries may lead to a cautious approach toward hiring in the first part of 2025. It will be interesting to see if these concerns come to fruition and we see any cooling of the labor market and a drop in hiring.
Key Influences on February’s Jobs Report
Federal Job Cuts
The Department of Government Efficiency (DOGE) recently announced plans to cut 10,000 federal jobs. However, because of the timing, these cuts may not fully show up in February’s jobs report but could have a bigger impact in future months.
Changes in Trade Policies
New trade tariffs on goods from Mexico, Canada, and China are affecting how businesses hire. Some industries are benefiting, but others, like manufacturing, are facing challenges as they deal with higher costs and supply chain adjustments.
Strong Services Sector
The services industry continues to grow. The ISM’s non-manufacturing PMI rose to 53.5 in February from 52.8 in January. This is a good sign for jobs in areas like healthcare, hospitality, and professional services.
Mild Weather’s Impact
Warmer-than-usual weather in February likely boosted jobs in construction and other outdoor industries. This seasonal factor might slightly raise the overall job numbers for the month.
Potential Impact and Scenarios
Here’s how the market might respond to different outcomes in February’s job numbers:
Stronger-Than-Expected Job Growth
If the report shows more than 195,000 jobs added, we could see these effects:
- Higher Bond Yields
A strong labor market might make the Federal Reserve less likely to cut rates soon, pushing bond yields up.
- A Stronger Dollar
The U.S. dollar (USD) could strengthen against currencies like the euro (EUR) or the British pound (GBP) as traders expect less rate-cutting from the Fed.
- Stock Market Weakness
Oddly, good job numbers might hurt stock markets. With less chance of rate cuts, investors could shy away from riskier assets like stocks.
Weaker-Than-Expected Job Growth
If the report shows fewer than 135,000 jobs added, the market may react this way:
- Risk-Off Reactions
Investors might move to safe-haven assets like gold or currencies such as the Japanese yen (JPY) or Swiss franc (CHF), fearing wider economic troubles.
- Talk of Rate Cuts
A weak report could raise expectations that the Fed might cut rates later in 2025, lowering the value of the USD.
Neutral or Expected Job Numbers
If the data is close to projections, around 170,000 jobs added, reactions might depend on smaller details, like:
- Revisions to Old Data
Changes to previous job numbers could shape market responses.
- Pay Growth
Wages growing faster than expected might revive concerns about inflation.
- Services Sector Strength
Solid growth in services jobs could provide some optimism for markets.
How the market reacts will greatly depend on these scenarios and the finer details of the report.
Potential Impact on the US Dollar Based on the Data Released
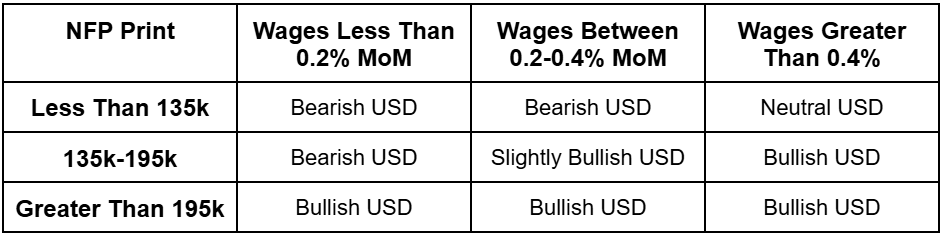
Source: LSEG, TradingEconomics. Table Created by Zain Vawda
Markets will be paying close attention to US labor data following a string of underwhelming data releases. The data of late has been one of a slowing economy, coupled with tariff uncertainty sets a perfect mixture for a potential recession.
This will have a knock on effect globally which makes US data and the performance of the economy key in the months ahead.
Technical Analysis – US Dollar Index (DXY)
Looking at the US Dollar Index and it is now trading at the levels it did before the US election.
Any gains made since the election of President Trump has been wiped away with the DXY peaking at 110.176 on January 13 before beginning its descent. Tariff announcements and chatter have attempted to push the Dollar higher but follow through has not been forthcoming as concerns linger about the impact tariffs may have on the USD as well.
This leaves the US Dollar Index (DXY) at a crossroads with a break below the swing low at 103.37 likely opening up further downside.
The silver lining may be that the DXY has lost a significant amount of value this week and could be due for a pullback. Potential profit taking ahead of the NFP release could also help.
If a move higher comes to fruition, initial resistance rests at 105.00 which houses the 200-day MA and could prove to be a tough nut to crack. A move above 105.00 opens up a retest of 105.63 and the previous swing low (Feb 26) at 106.130.
US Dollar Index (DXY) Daily Chart, March 6, 2024
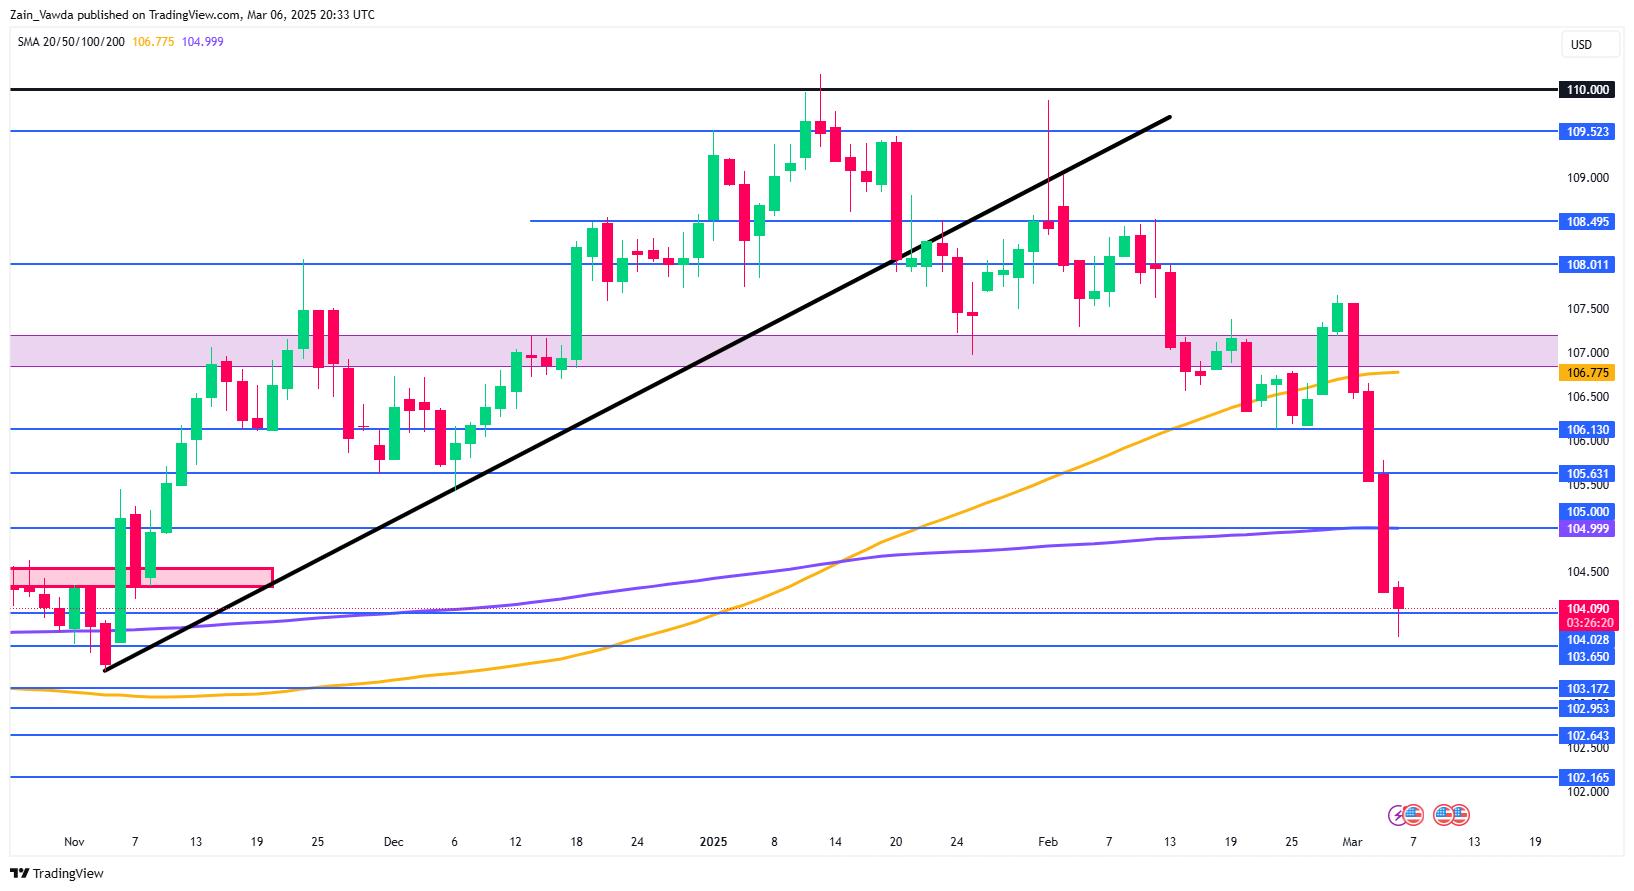
Source: TradingView (click to enlarge)
Support
- 103.65
- 103.37
- 103.17
Resistance
- 105.00
- 105.63
- 106.13
AUDUSD Rallies Ahead of NFP Report
Key Fundamental Factors:
- US Trade Policy:
- President Trump temporarily exempts automakers in Mexico and Canada from tariffs for one month.
- He is also considering removing tariffs on certain agricultural products from both countries.
- Australian Economic Data:
- Trade surplus rose to 5,620 million in January (higher than expected).
- Exports increased 1.3%, reaching an 11-month high, while imports fell 0.3%.
- Building permits surged 6.3%, marking the second month of growth.
- GDP growth in Q4 2024 was 0.6% (higher than expected).
- US Economic Factors:
- The US Dollar (DXY) is at 104.30, struggling due to concerns about slowing growth.
- US job market slowdown: ADP reported 77K new jobs in February (far below the 140K forecast).
- Traders await Friday’s Nonfarm Payrolls (NFP) report, showing 160K job gains.
- US Manufacturing PMI dropped to 50.3 (slightly below expectations).
- China’s Economic Impact:
- China’s Services PMI rose to 51.4, signaling steady economic activity.
- China cleared $530 billion in bad loans and plans to prioritize real estate recovery in 2025.
- China targets 5% economic growth for 2025 while stabilizing the stock and property markets.
- Geopolitical Risks:
- China threatens a strong response to Trump’s tariff hikes, which may affect the Australian dollar due to Australia’s trade reliance on China.
- RBA Deputy Governor Andrew Hauser warns that global trade uncertainty is at a 50-year high, which could impact business and investment confidence.
Key Takeaway for Traders:
- AUDUSD shows short-term bullish momentum but faces resistance near 0.6380 and 0.6408.
- The US Dollar remains under pressure, but economic data (NFP report) could shift sentiment.
- Keep an eye on China’s trade policies and US tariffs, as they could influence AUD’s strength.
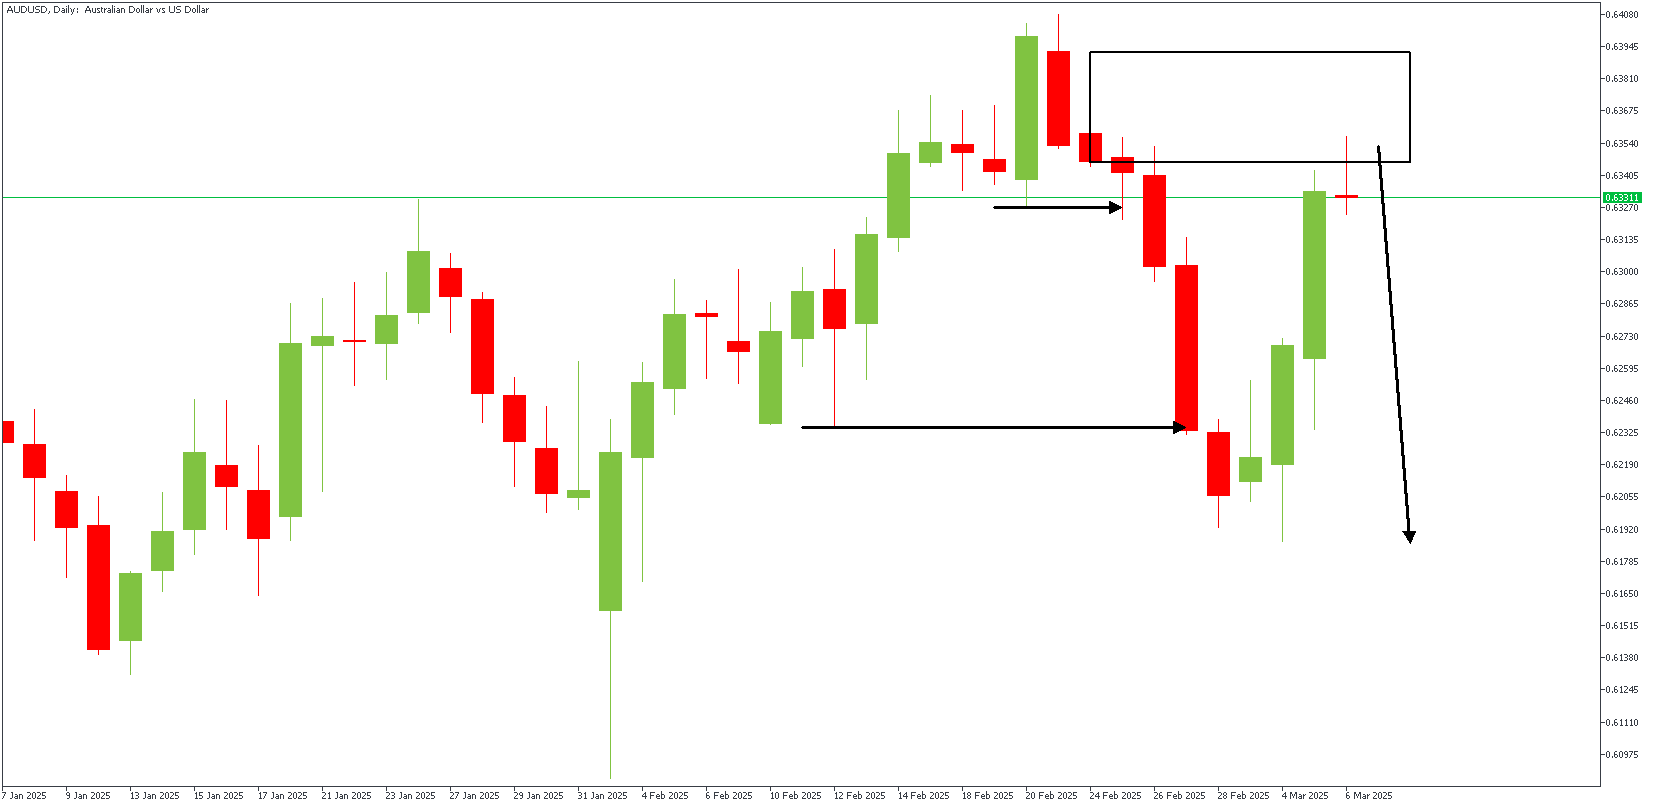
AUDUSD – D1 Timeframe
The price recently broke below the previous lows on the daily timeframe chart of AUDUSD, followed by a quick retracement. The retracement has now reached the supply zone and is expected to come under bearish pressure soon. Let’s take a look at the price action on the lower timeframe, though.
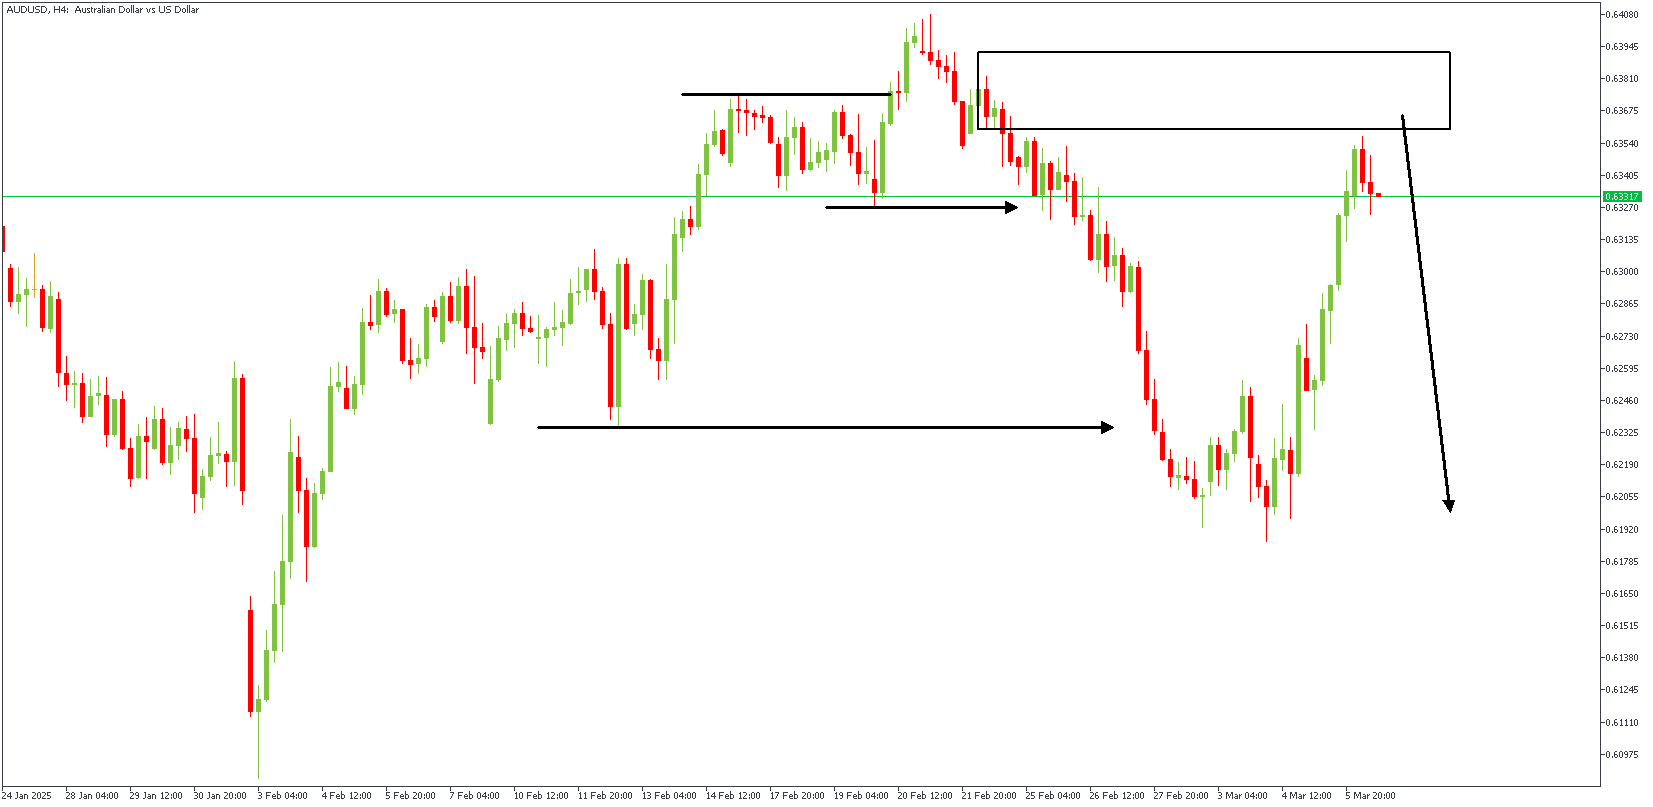
AUDUSD – H4 Timeframe
The price action on the 4-hour timeframe chart of AUDUSD falls perfectly in line with the bearish sentiment already described above. In addition to the supply zone occurring at the 88% Fibonacci retracement level, there is also a confluence from the SBR pattern, as highlighted in the 4-hour timeframe chart attached above.
Analyst’s Expectations:
- Direction: Bearish
- Invalidation- 0.64109
- Target- 0.62313
EURUSD Continues to Trend Higher, on Track for the Biggest Weekly Gain in Five Years
The Euro rose above 1.08 level and hit the highest in four months on Thursday after ECB’s widely expected decision to cut interest rates by 25 bp to 2.5%, in its sixth rate cut since June.
The central bank stated that monetary policy is becoming meaningfully less restrictive and left the door open for further easing, repeating their standard phrase that future action will be depending on the incoming economic data.
The single currency holds in sharp bullish acceleration for the fourth consecutive day, underpinned by weakening dollar and the most significant factor, signals that Germany’s next government is to create a 500 billion euro fund to boost military and revive economic growth of the EU’s largest economy which is in recession for the second year.
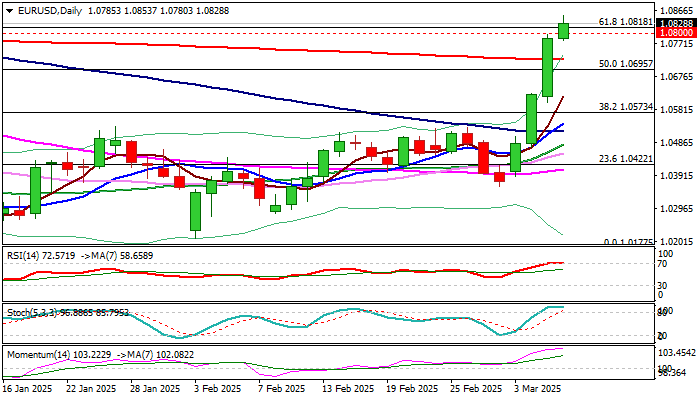
The latest sharp rally (EURUSD is on track for the biggest weekly gain since the third week of March 2020) has significantly improved technical picture on daily chart however, overstretched momentum and stochastic indicators suggest that bulls may start losing traction, which would prompt partial profit-taking.
Near-term outlook is expected to remain positive, as the action is underpinned by strongly favorable fundamentals and bullish technical studies, with likely scenario of limited dips (to be ideally contained by 200DMA / broken Fibo 50%) to offer better levels to re-join bullish market for extension towards 1.0872 (200WMA) and 1.0969/1.1000 targets (Fibo 76.4% of 1.1214/1.0177 / psychological) in extension.
Res: 1.0853; 1.0872; 1.0900; 1.0969
Sup: 1.0800; 1.0725; 1.0695; 1.0630
USDJPY Wave Analysis
- USDJPY under bearish pressure
- Likely to fall to support level 146.00
USDJPY currency pair is under bearish pressure after the earlier breakout of the support zone between the support level 148.60 (the former monthly low from December) and the 50% Fibonacci correction of the upward impulse from September.
The breakout of this support zone accelerated the C-wave of the active ABC correction (2) from the start of January.
Given the strongly bullish yen sentiment seen today, USDJPY currency pair can be expected to fall to the next support level 146.00, the target for the completion of the active ABC correction (2).
