Sample Category Title
EUR/JPY Daily Outlook
Daily Pivots: (S1) 156.79; (P) 158.00; (R1) 160.41; More...
EUR/JPY's rebound from 154.77 resumed and break of 158.45 indicates short term bottoming. Intraday bias is back on the upside. Sustained break of 55 D EMA (now at 159.55) will argue that corrective pattern from 154.40 has started another rising leg, and target 161.17 resistance and above.
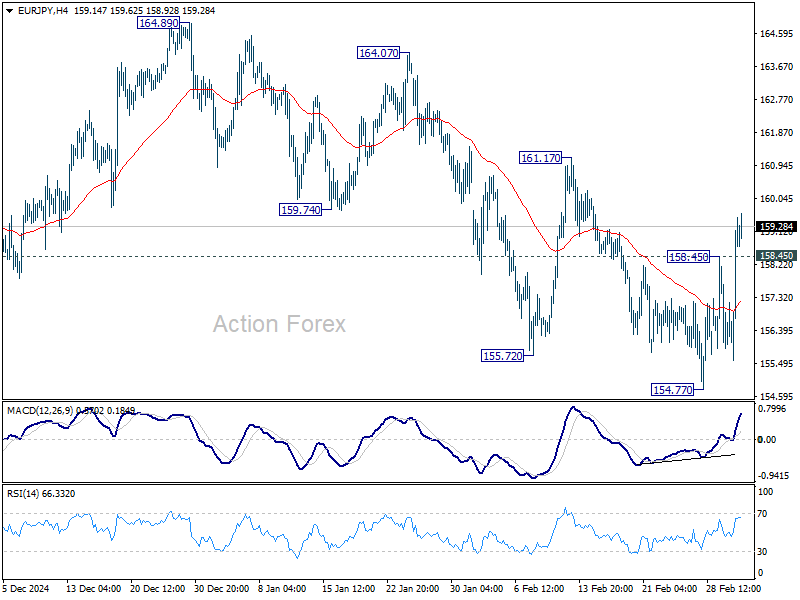
In the bigger picture, price actions from 175.41 are seen as correction to rally from 114.42 (2020 low). Strong support should be seen from 38.2% retracement of 114.42 to 175.41 at 152.11 to contain downside. However, sustained break of 152.11 will bring deeper fall even still as a correction. Next target will be 100% projection of 175.41 to 154.40 from 166.67 at 145.66.

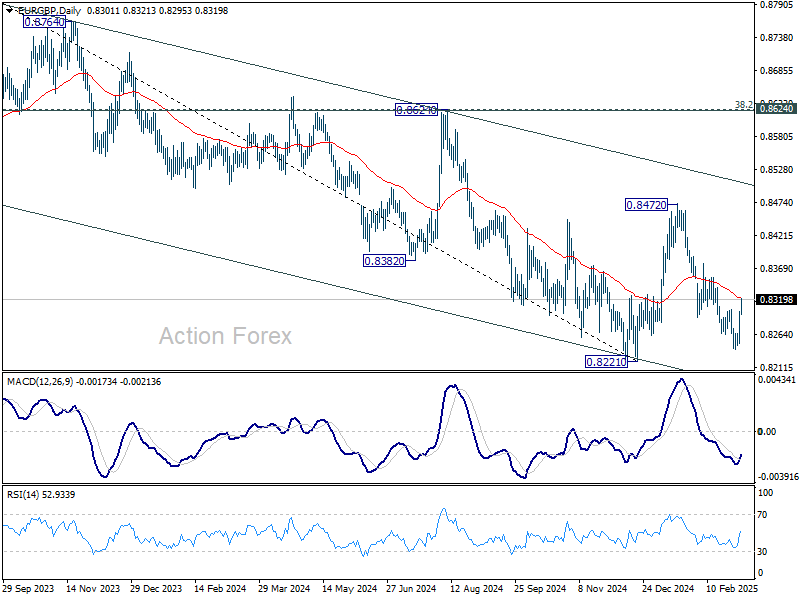
EUR/GBP Daily Outlook
Daily Pivots: (S1) 0.8268; (P) 0.8287; (R1) 0.8323; More...
A short term bottom is in place in EUR/GBP with break of 0.8239 resistance. Intraday bias is back on the upside for 38.2% retracement of 0.8472 to 0.8239 at 0.8328. Sustained break there will argue that whole fall from 0.8472 has completed and target 61.8% retracement at 0.8383. However, rejection by 0.8328 will bring another decline through 0.8239 support.
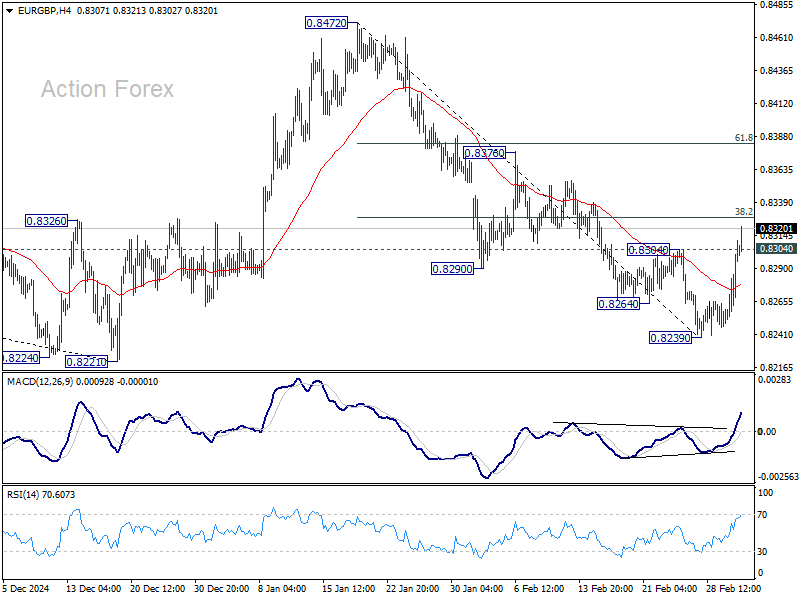
In the bigger picture, the medium term down trend remains intact with EUR/GBP staying well inside the falling channel. Prior rejection by 55 W EMA (now at 0.8414) also affirm bearishness. Decisive break of 0.8201/8221 support zone will resume whole down trend from 0.9449 (2020 high) and carry larger bearish implications.
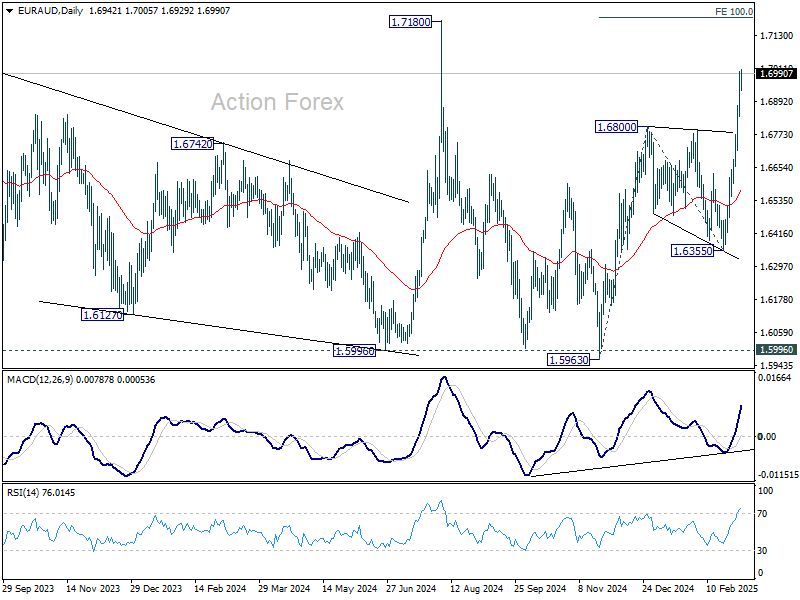
EUR/AUD Daily Outlook
Daily Pivots: (S1) 1.6855; (P) 1.6929; (R1) 1.7016; More...
Intraday bias in EUR/AUD remains on the upside for the moment. Current rise from 1.5963 should target 100% projection of 1.5963 to 1.6800 from 1.6355 at 1.7192, which is close to 1.7180 high. On the downside, below 1.6884 minor support will turn intraday bias neutral and bring consolidations first, before staging another rally.
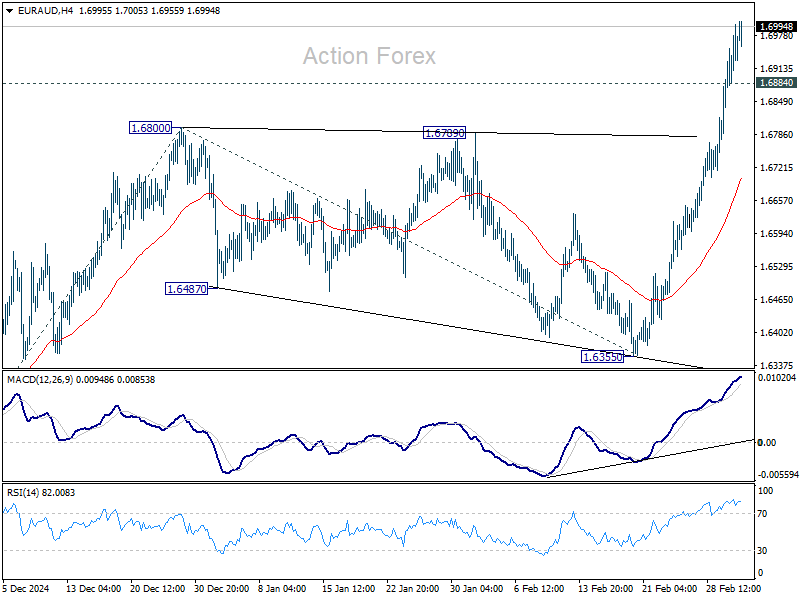
In the bigger picture, with 1.5996 key support (2024 low) intact, larger up trend from 1.4281 (2022 low) is still in favor to resume through 1.7180 at a later stage. Nevertheless, sustained break of 1.5996 will indicate that such up trend has completed and deeper decline would be seen.
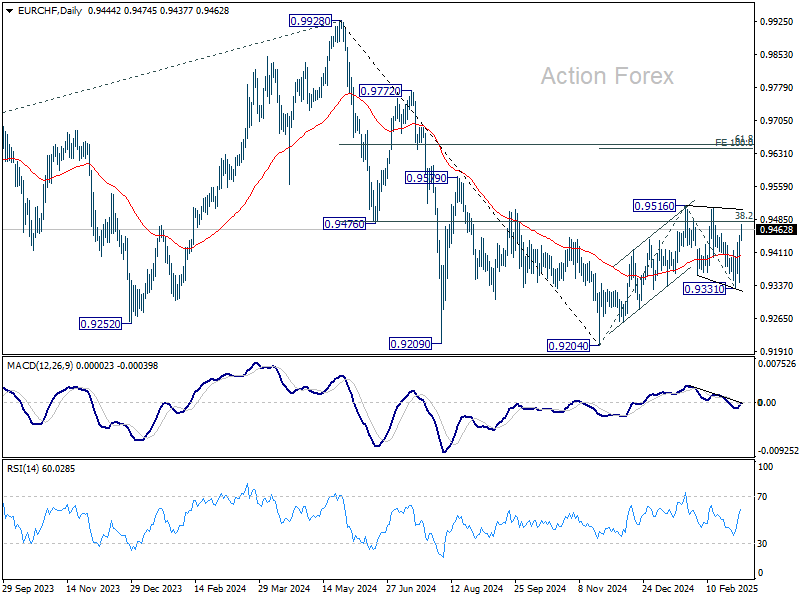
EUR/CHF Daily Outlook
Daily Pivots: (S1) 0.9381; (P) 0.9417; (R1) 0.9489; More....
Range trading continues in EUR/CHF and intraday bias stays neutral. On the upside, firm break of 0.95167 will resume the rebound from 0.9204 and target 100% projection of 0.8204 to 0.9516 from 0.9331 at 0.9643. Nevertheless, break of 0.9331 will resume the fall from 0.9516 to retest 0.9204 low.
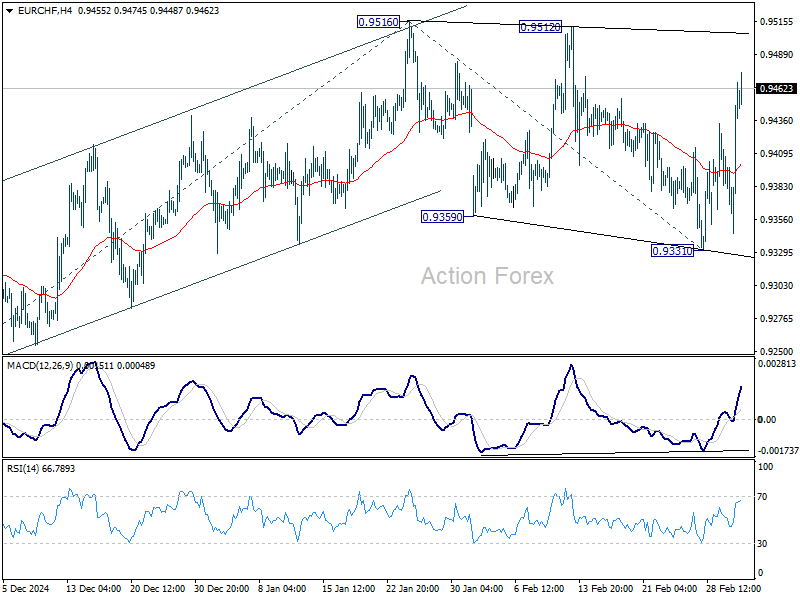
In the bigger picture, sustained trading above 38.2% retracement of 0.9928 to 0.9204 at 0.9481 should confirm that whole fall from 0.9928 (2024 high) has completed at 0.9204. Further rally should then be seen back to 61.8% retracement at 0.9651 and above. However, another rejection by 0.9481 will keep outlook bearish for extending larger down trend through 0.9204 at a later stage.
Germany’s Change of Heart on Expansive Budgetary Politics Triggers More Spectacle on Financial Markets
Markets
German Chancellor-to-be Merz vowed to do “whatever it takes” to fend off threats to freedom and peace in Europe. In a reference to ECB Draghi’s 2012 speech that turned the tide in the EMU debt crisis, Merz now pledges to go all-in fiscally. At a joint press conference between CDU/CSU and SPD leaders, Merz said that future coalition partners will use the outgoing parliament to set up a €500bn fund for infrastructure (which will run for 10 years) via a constitutional amendment, loosen debt rules for states and exempt defense spending above 1% of GDP from the debt brake. The latter is actually a blank cheque to raise debt to strengthen the army and provide assistance to Ukraine. The bills will be brought to parliament next week and need a two-thirds majority which in the old constellation is possible with the support of the Greens. They have been in favour of changing the constitutional debt brake rule (keeping the structural deficit at 0.35% of GDP) for longer. The official German U-turn on fiscal spending comes on the eve of a EU Council Summit at which European leaders will explore more options to Re-arm Europe as EC von der Leyen labelled it. In a letter to EU leaders, she outlines five potential measures to massively boost defense spending. They include a new €150bn loan instrument to finance joint defense investments and €650bn from individual member states increasing defense spending by 1.5% of GDP on average and for which fiscal discipline rules will be once again lifted.
Germany’s change of heart on expansive budgetary politics triggers more spectacle on financial markets. European equity futures point to opening gains in excess of 1.5% with German Bunds massively selling off with the long end of the curve obviously underperforming. Resistance for the German 10-yr yield stands at 2.65% (2025 top) and 2.71% (2024 top). The euro succeeded a technical break through first resistance levels at 1.0533 (previous YTD top) and 1.0551 (38% retracement on Sep24-Feb25 decline) as spending efforts will boost growth. The dollar shows more sings of weakness (US recession fears) as Trump’s explosive policy mix risks backfiring. The US government seems to be playing playing good cop, bad cop on topics like tariffs and Ukraine. Most recent messages are again somewhat more positive with Trump signaling a potential revival of the mineral-deal after receiving a letter from Ukrainian president Zelensky and Commerce secretary Lutnick saying that the administration may soon announce a pathway to tariff relief for Mexico and Canada. US Treasuries seem to be losing steam after their stellar run since mid-February. Today’s ADP employment report and US services ISM will be interesting in this respect. Failure to take out yesterday’s highs in US Treasuries on soft data suggests that the short-term repositioning went far enough. This could also help US risk assets finding some composure.
News & Views
China’s PM Li Qiang during today’s National Party Congress turned the long-rumoured 5% growth target for this year into an official one. It will be the third year straight the country seeks to grow by this much. Circumstances this time around make the goal even more ambitious. US president Trump’s import tariffs (currently standing at 20%) will bite into Chinese exports, which contributed around a third to last year’s GDP growth. China as a result turns the focus towards its domestic market. It has raised the budget deficit target to around 4% of GDP, the highest in more than three decades, and increased the amount of special sovereign bonds it plans to issue by CNY 300bn to CNY 1.3tn. The proceeds will be used to fund greater public spending in areas including infrastructure as well as to finance a subsidy program for consumer goods. The unemployment rate goal remains at last year’s 5.5%. Following the long streak of weak inflation or even deflation, China lowered the CPI goal from around 3% to around 2%. Li said the central bank will cut interest rates and the reserve requirement ratio “at an appropriate time”, meaning monetary policy will flank the fiscal side in stimulating demand. The Chinese yuan strengthens marginally this morning to USD/CNY 7.256. Chinese stocks trade in the green, along with most other Asian-Pacific peers.
IMF Georgieva warned that trade will no longer be driving global economic growth the way it used to. “The new US administration is rapidly reshaping its policies on trade, taxation, public spending, deregulation and digital assets, and other governments are also recalibrating their approaches and adjusting their policies.” She called on the typically trade-reliant Asian nations specifically to adjust to these changing norms by shifting towards more service-led growth, digitalization and AI. She also promoted regional integration as an answer to the deglobalization trend.
USD Rally Reverses as Trump’s Tariffs Backfire
Trump’s tariffs went live yesterday, sending global markets—including the US indices—tumbling, until rumours of a potential rollback started circulating. High volatility is driving investors toward safe havens like bonds and gold, while the Trump-fueled rally in the US dollar index has already reversed.
Up and down
The DAX got hit by a hefty 3.50% selloff, the CAC 40 fell 1.85% while the Stoxx 600 tumbled more than 2%, the Japanese Nikkei eased to the lowest levels since September and the major US indices – from big cap, tech-heavy to medium and small cap benchmarks – fell below the levels they were trading at when Donald Trump was elected president last November.
The aggressive reaction was curious, though, as investors knew that the tariffs would go live yesterday, suggesting that a clear majority was expecting Trump to make a last-minute U-turn – a thing that he did! There are now rumours circulating that he may roll back some of the tariffs. The DAX futures are up by almost 2% at the time of writing.
The news flow becomes annoying, of course, as crucial decisions change in a matter of minutes. The market reaction is often aggressive, the volatility is rising, and investors are naturally moving toward the safer pockets of the market. As such, bond are performing better than equities since Trump is elected President and portfolio allocations to gold are lifted.
Deteriorating earnings outlook
US earnings season was pretty strong. With almost all companies having reported earnings, 75% of the companies managed to beat earnings expectations. The S&P500 earnings grew by around 18% - the highest earnings growth rate since Q4, 2021. Alas, companies issued more negative guidance than positive guidance. Target and Best Buy joined in yesterday warnings that the US consumers will have to face higher prices because of Trump’s tariffs. But since we’re emerging from a period of relatively high inflation, companies have less room to pass price increases on to customers and the latter is weighing on earnings outlook. In summary, tariffs are just as toxic for American companies as they are for others. America won’t be great by destroying value globally.
USD’s Trump rally reverses
The greenback couldn’t come out of the latest tariff quake victorious. The dollar index slumped nearly 1% yesterday and slipped below the major 38.2% Fibonacci retracement on Trump rally: the post-election Trump bump in the US dollar is now reversed. The EURUSD rocketed past the 1.06 mark and stepped into the medium-term bullish consolidation zone after clearing the major 38.2% Fibonacci resistance on Trump selloff. Cable – which had stepped into the medium-term bullish consolidation zone a few weeks ago - is now testing the 200-DMA resistance to the upside. The rebound in the Loonie and Aussie remain more contained however as the global trade tensions weigh on growth expectations and the demand outlook for commodities. The fact that Saudi’s Aramco has cut dividend, combined to OPEC’s decision to restore output, means that Saudis have interest to maximize oil sales to replenish their coffers. As such, crude outlook remains comfortably negative in the short run.
Today, investors will watch the US ADP report, and PMI, ISM numbers from both sides of the Atlantic Ocean. While the European investors could brush off bad news on expectation that the US tensions will boost activity sooner rater than later, weakness in the US data will probably be perceived as bad news and should further weaken appetite.
Proposed Boost to EU Military Spending
In focus today
In the euro area, we receive final services PMI. The flash estimates fell to the lowest level in three months, to 50.7 and undercutting market expectations of 51.5. The market expectation is that final numbers will align with flash estimates on 50.7.
In the US, a string of data will be released this afternoon. The ADP employment report will provide an early indication on what to expect in relation to this Friday's BLS Jobs Report for February. However, it is important to note that the ADP data has historically been an unreliable leading indicator for the official NFP figures. The afternoon also features the February ISM Services data, which will be especially interesting this time given the very weak preliminary PMI Services numbers for February and the significant worsening of household sentiment seen recently.
In Sweden, service PMI is released. This has been hovering close to the 50-mark since 2023 with the latest print at 50.1. Looking at the subcomponents, delivery times contributed about 1 unit on the upside, while the employment index dragged it down by almost the same magnitude. So, while we overall expect another print around 50, we will examine the subcomponents for more insight on the state of the services sector.
Economic and market news
What happened overnight
In China, growth targets and other key goals for 2025 were revealed at the annual National People's Congress. The growth target was set at 'around 5%', consistent with last year and expectations, reflecting China's aim to maintain stimulus against higher US tariffs. China increased the budget deficit target from 3% to 4%, the highest in many years, and stated that they would adopt a more proactive fiscal policy. That boosting private consumption is priority number one was highlighted again while technology advancement is number 2. While there were few surprises, markets responded positively to the clear message of continued stimulus to reach a quite ambitious growth target of 5% (cons: 4.5%, we expect 4.7%).
What happened yesterday
In the euro area, the unemployment rate remained at record-low 6.2% in January as the number of unemployed persons fell by 40 thousand. Hence, the labour market remains very tight and hard data continues to defy the softer signals sent by survey indicators. The strong labour market is expected to persist this year and should help private consumption grow.
In Germany, the German Bundesbank (GDB) has presented a new proposal of a reform of the German debt brake. The proposal is to allow the structural deficit to increase from 0.35% of GDP to 1.4% of GDP, which is around EUR 45bn extra in public deficit per year. We estimate that the reform could increase growth by 0.20 percentage points in 2026, 0.25 percentage points in 2027, and 0.20 percentage points in 2028. For details, see page 2-4 in Research Germany: Limited economic impact from German election, 6 February.
In Sweden, the Riksbank decided on 4 March to exchange an EU payment of a total amount SEK 3,357m. The exchange is not expected to have any impact on the current monetary policy, and the effect on liquidity in the banking system is neutralised through FX-swaps. We do not expect it to have any meaningful impact on the market.
On the geopolitical front, the implementation of tariffs by the US on Canada, Mexico, and China was immediately retaliated by China and Canada. China responded with import tariffs on US farm products and restrictions on certain US companies. Overall, China's response is moderate, avoiding escalation, with the new tariffs affecting far fewer goods. Canada retaliated by imposing 25% tariffs on USD 30bn of US imports with immediate effect. Mexico is currently waiting until Sunday before announcing its next steps. The uncertainty and concerns once again sent US financial markets reeling.
Following Trump's suspension of US military aid to Ukraine, European Commission President Ursula von der Leyen proposed the "Rearm Europe" plan, aiming to boost EU military spending by up to EUR 800bn through a mix of private and public funding. The plan suggests using EUR 50bn in EU loans and repurposing funds, with potential changes to European Investment Bank rules. Details remain scarce, but more information is expected at an EU leaders' meeting on Thursday. Read our view on the rearmament of Europe in Research Global: Arming Ukraine is the cheap option for Europe, 3 March.
Regarding the war in Ukraine, Trump has stated that Ukraine is willing to come to the peace negotiating table, according to a letter from Zelenskiy to Trump. Furthermore, Trump said he received strong signals that Russia is ready for peace. However, details are sparse and specifics on resolving the conflict are unclear.
Equities: Global equities declined by more than 1% yesterday, with Europe leading the downturn as some key indices, such as the DAX, lost over 3%. There are various perspectives on this development. The bears might interpret the steep drop as just the beginning, anticipating that tariffs will soon be imposed on Europe, and worth noting that we are only one and a half months into Trump's presidency.
On the other hand, the bulls would highlight that the DAX is up 12% year-to-date despite the prevailing uncertainty. They would suggest that the improvement in European and German macroeconomic data is more significant than the noise from the US administration. Additionally, the bulls may point to the proposed EU defence package of EUR 800bn and the window of opportunity in Germany for historical infrastructure and defence spending of EUR 500bn.
We usually tend to downplay the political impact on financial markets, especially equities. However, politics is currently at the forefront, necessitating an assessment of the most likely outcomes and the associated risks and opportunities.
To add perspective, it is essential to note that this is a unique situation rather than a classic macro-driven sell-off. Take a look at some of the interesting cross asset moves yesterday:
Consumer staples in Europe increased despite the broader indices' significant drop. This indicates that investors are not yet overly nervous but are instead rotating their portfolios as much as selling equities. Bond yields remained relatively stable yesterday, with the long end even rising in the US. There was no safe-haven flow to the dollar, oil fell by only 0.2%, and bitcoin even gained yesterday. This suggests that investors are undecided about the direction of the global economy, which naturally creates both upside and downside risks. Moreover, our assessment is that investors do not expect these tariffs to remain for long. As we noted yesterday, nothing is set in stone with Trump. This was quickly proven as Lutnick commented late yesterday that Mexico and Canada have "promised to do better", suggesting that Trump could announce some tariff relief as soon as today (Wednesday)!
In the US yesterday, the Dow was down 1.6%, the S&P 500 fell by 1.2%, the Nasdaq declined by 0.4%, and the Russell 2000 decreased by 1.1%. Asian markets are higher this morning. To further underscore the dominance of the political agenda, the National People's Congress is also taking place these days. The most interesting aspect from the first day, in our opinion, is the 4% fiscal deficit target. With signs that the Chinese property market is approaching a turning point and increased fiscal flexibility in China, this could attract positive attention from investors. Futures this morning are a story of their own, with the DAX currently almost 2% higher. Let this serve as a reminder not to panic when Trump is dictating market direction, as there is a risk of being caught off guard more than once. US futures are also solidly higher this morning, though not to the same extent as in Europe.
FI: Yesterday, EU announced a new defence package called ReArm EU, in which they will spend EUR 800bn on the defence of EU. Hence, like the SURE and NGEU made during the Covid crisis, we see that when EU is being put under sufficient pressure they can act quite fast with a significant fiscal package. On top of this, Germany is looking to do a joint package on defence and infrastructure of at least EUR 500bn.
This has put solid pressure on ASW-spreads given the potential issuance. Furthermore, the curves have steepened from both the short and long ends. In the short end yields declined ahead of the ECB meeting on Thursday. We have also seen a rise in the short-dated interest rate volatility, but seen over a 5Y period it still seems very modest.
FX: EUR/USD rallied on broad EUR optimism, supported by reports that Germany will establish a new 500bn EUR fund for defence investments, along with renewed hopes for a ceasefire in Ukraine as Zelenskiy signals willingness to negotiate with Russia to end the war. Rising growth concerns in the US have also fuelled the rally in the cross. Similarly, EUR/SEK retraced its move lower after the SEK was off to a strong start to the week. NOK remains challenged by US growth concerns alongside OPEC+ surprising by proceeding with output hikes in April. While risk-sentiment has taken centre stage for EUR/CHF lately, focus turns to the release of Swiss February inflation this morning.
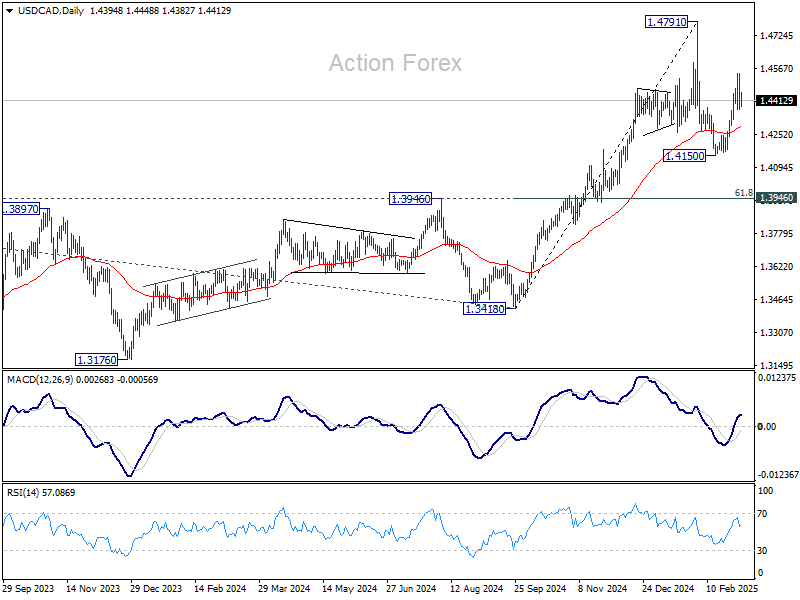
USD/CAD Daily Outlook
Daily Pivots: (S1) 1.4330; (P) 1.4437; (R1) 1.4503; More...
Intraday bias in USD/CAD is turned neutral first with current retreat. Further rally will remain in favor as long as 55 4H EMA (now at 1.4367 holds). Above 1.4541 will target a retest on 1.4791 high. Nevertheless, sustained trading below 55 4H EMA will argue that the corrective pattern from 1.4791 is extending with the third leg. Deeper fall should then be seen back to retest 1.4150 support.
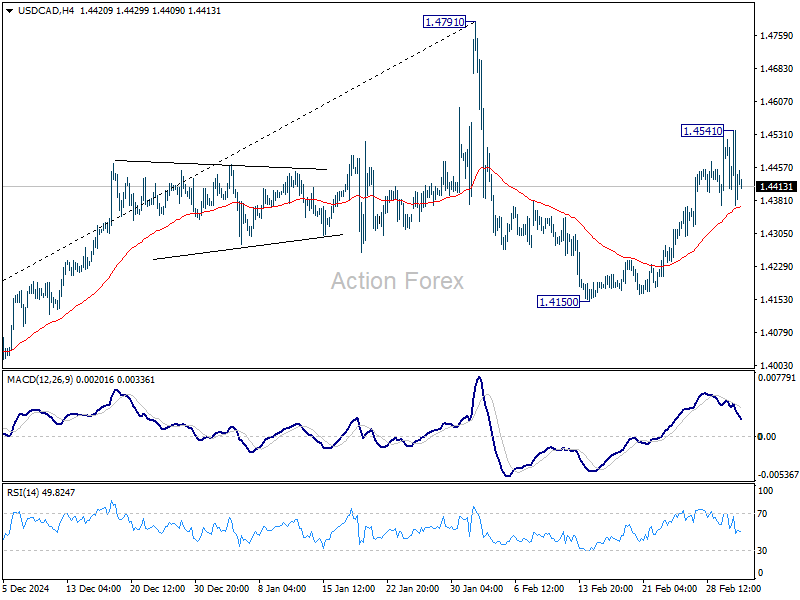
In the bigger picture, long term up trend is tentatively seen as resuming with prior breach of 1.4667/89 key resistance zone (2020/2015 highs). Next target is 100% projection of 1.2401 to 1.3976 from 1.3418 at 1.4993. This will remain the favored case as long as 1.3976 resistance turned support holds (2022 high), even in case of deep pullback.
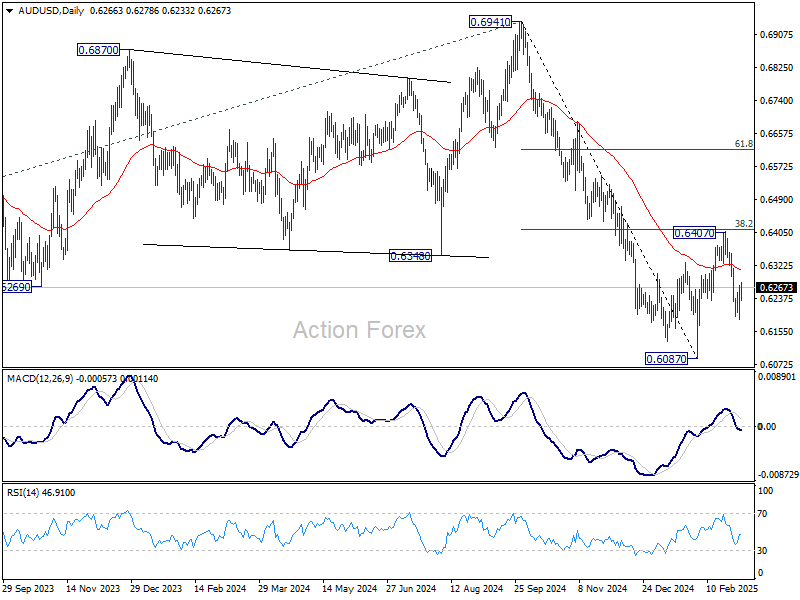
AUD/USD Daily Report
Daily Pivots: (S1) 0.6215; (P) 0.6244; (R1) 0.6300; More...
Intraday bias in AUD/USD is turned neutral first with current recovery. But outlook is unchanged that corrective rebound from 0.6087 should have completed at 0.6407, ahead of 38.2% retracement of 0.6941 to 0.6087 at 0.6413. On the downside, below 0.6186 will resume the fall from 0.6407 to retest 0.6087 low.
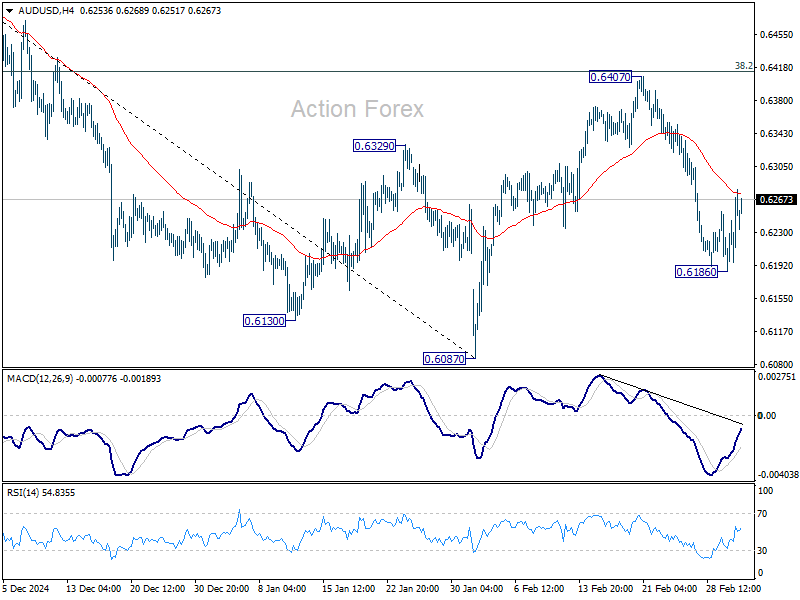
In the bigger picture, fall from 0.6941 (2024 high) is seen as part of the down trend from 0.8006 (2021 high). Next medium term target is 61.8% projection of 0.8006 to 0.6169 from 0.6941 at 0.5806. In any case, outlook will stay bearish as long as 55 W EMA (now at 0.6494) holds.
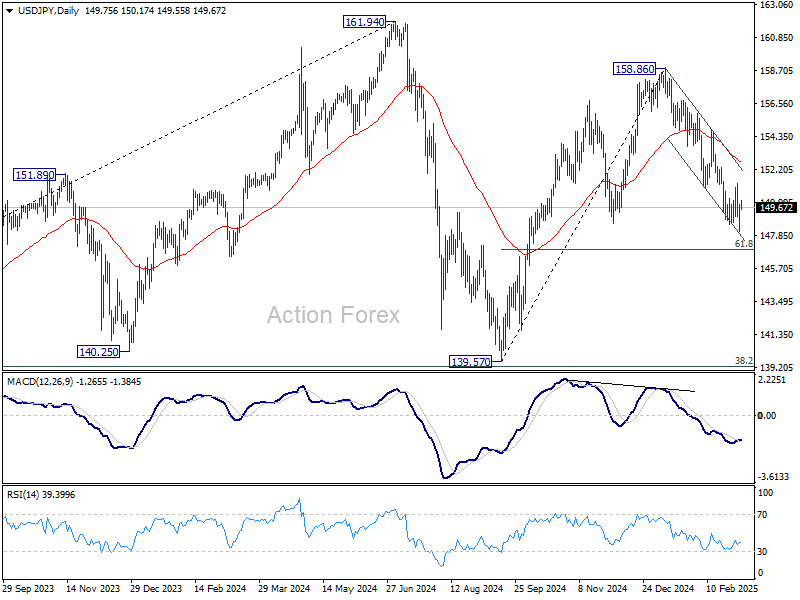
USD/JPY Daily Outlook
Daily Pivots: (S1) 148.64; (P) 149.26; (R1) 150.43; More...
Intraday bias in USD/JPY is turned neutral again with current recovery. Fall from 158.86, as the third leg of the corrective pattern from 171.96 high, is expected to continue as long as 151.29 resistance holds. Below 148.08 will target 61.8% retracement of 139.57 to 158.86 at 146.32. Sustained break there will pave the way back to 139.57 low. However, break of 151.29 will turn bias back to the upside for stronger recovery first.
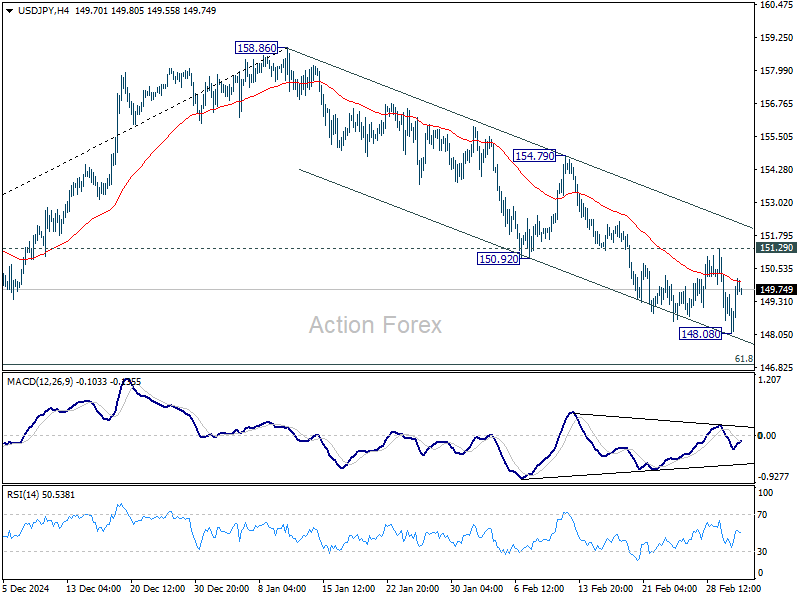
In the bigger picture, price actions from 161.94 are seen as a corrective pattern to rise from 102.58 (2021 low). In case of another fall, strong support should be seen from 38.2% retracement of 102.58 to 161.94 at 139.26 to bring rebound. However, sustained break of 139.26 would open up deeper medium term decline to 61.8% retracement at 125.25.