Sample Category Title
US500 Technical Analysis
The US Dollar (USD) is slightly stronger today, but gains against major currencies are limited, and most currencies stay within their established ranges. European stocks are down slightly, while US stock futures look better. Bond markets are weaker, with Treasury yields rising by 4-5bps. The Japanese Yen (JPY) and Swiss Franc (CHF) are underperforming, while the Mexican Peso (MXN) and Canadian Dollar (CAD) are doing better, possibly due to uncertainty over President Trump's tariff deadlines. Month-end demand may support the USD, but it's struggling to make significant gains. Technical trends have weakened slightly, with the USD Index (DXY) trading below its 100-day moving average. The market is also sensitive to weak US economic data, like the recent drop in Consumer Confidence.
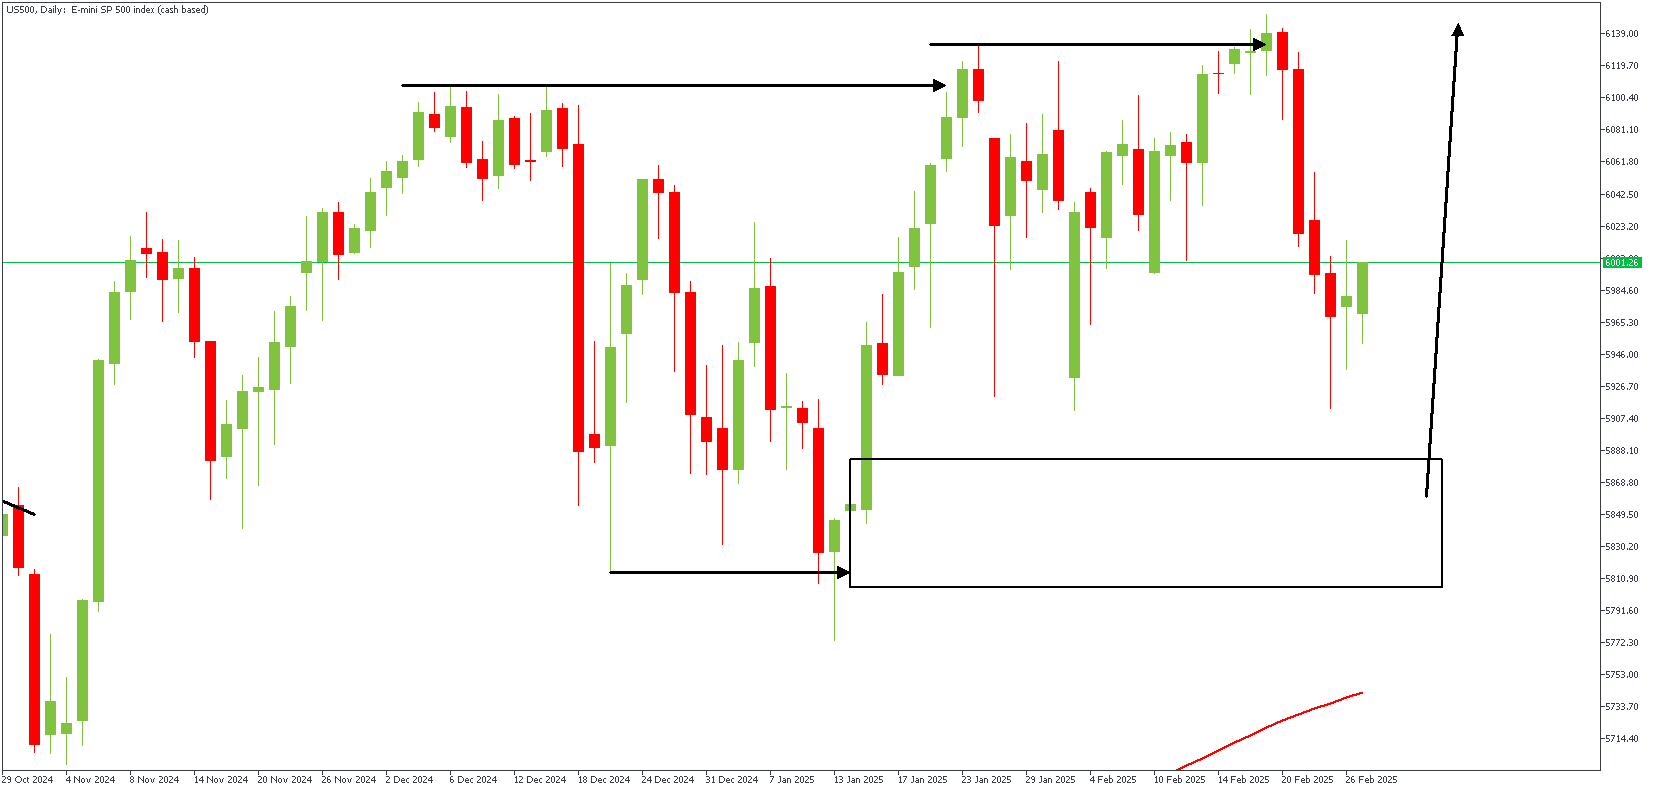
US500 – D1 Timeframe
On the daily timeframe chart of US500, we see the initial liquidity sweep from the highlighted low right before the price broke above the previous high. The drop-base-rally demand zone at the trough of the SBR pattern is situated near the 76% Fibonacci retracement level, increasing the likelihood of a bullish reaction.
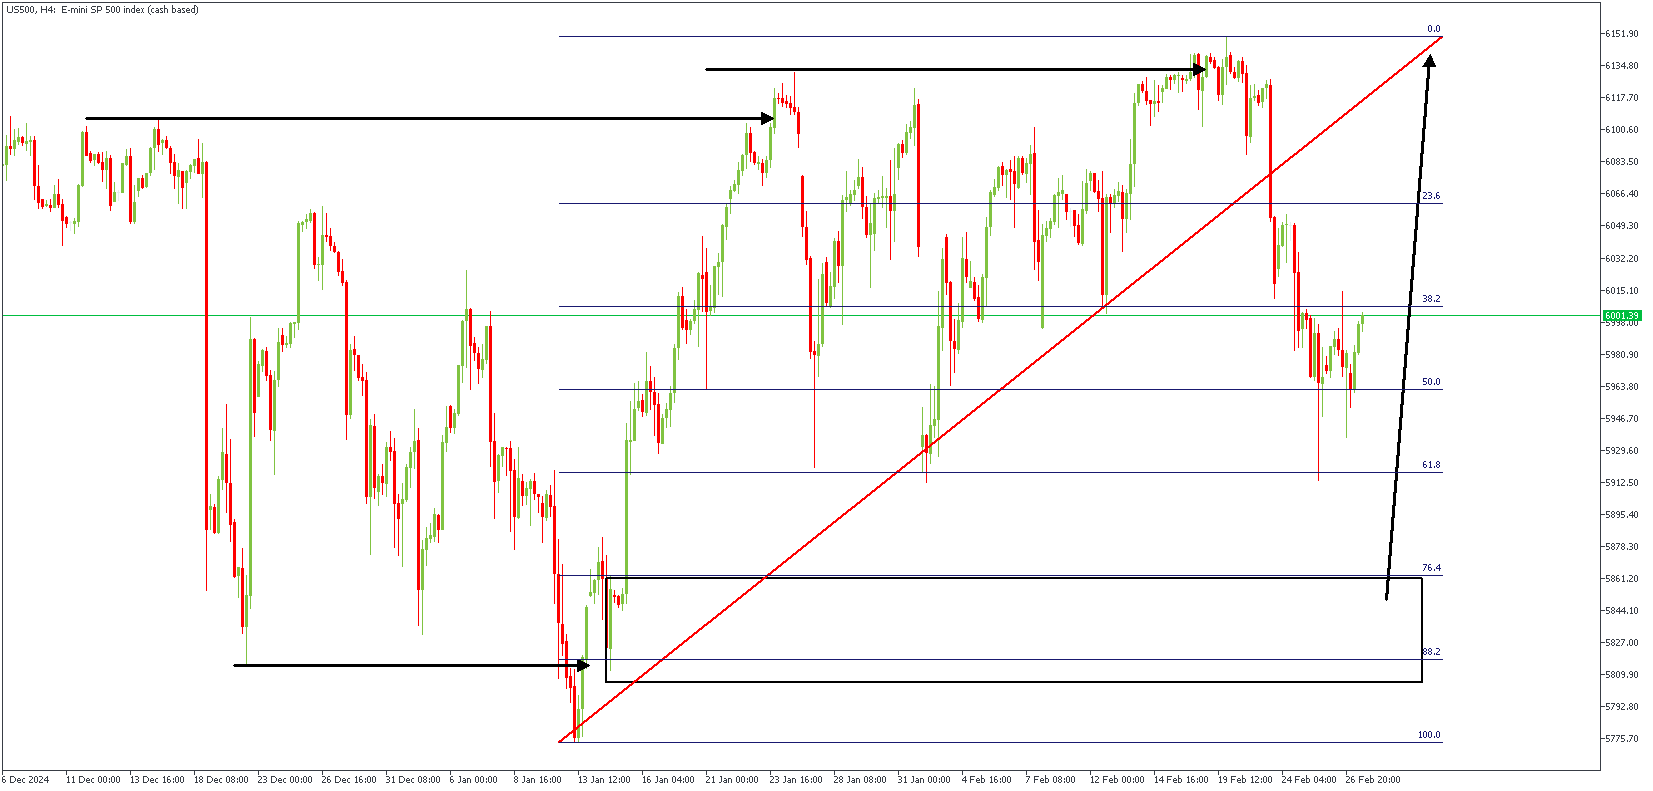
US500 – H4 Timeframe
The FVG (Fair Value Gap) left behind by the structure's double break needs to be filled, as hinted by the presence of liquidity at the equal lows on the 4-hour timeframe chart of US500. These serve as a confluence in favor of the bullish sentiment, and given the Fibonacci retracement factor in the equation, there is a high chance the outcome is bullish.
Analyst's Expectations:
- Direction: Bullish
- Target- 6144.04
- Invalidation- 5771.95
EURNZD Technical Analysis
EURUSD may struggle to stay above 1.05 for long as market dynamics shift. Concerns over a US economic slowdown have led to a slightly more dovish outlook for the Federal Reserve. The currency pair's direction will depend on future Fed and European Central Bank (ECB) policy moves and potential EU tariffs. Analysts expect tariffs to take effect in April, adding pressure on the euro. Currently, EURUSD is trading within a 1.0450–1.0530 range. Month-end portfolio adjustments could trigger some selling significantly, as eurozone equities have outperformed US stocks.
EURNZD – D1 Timeframe
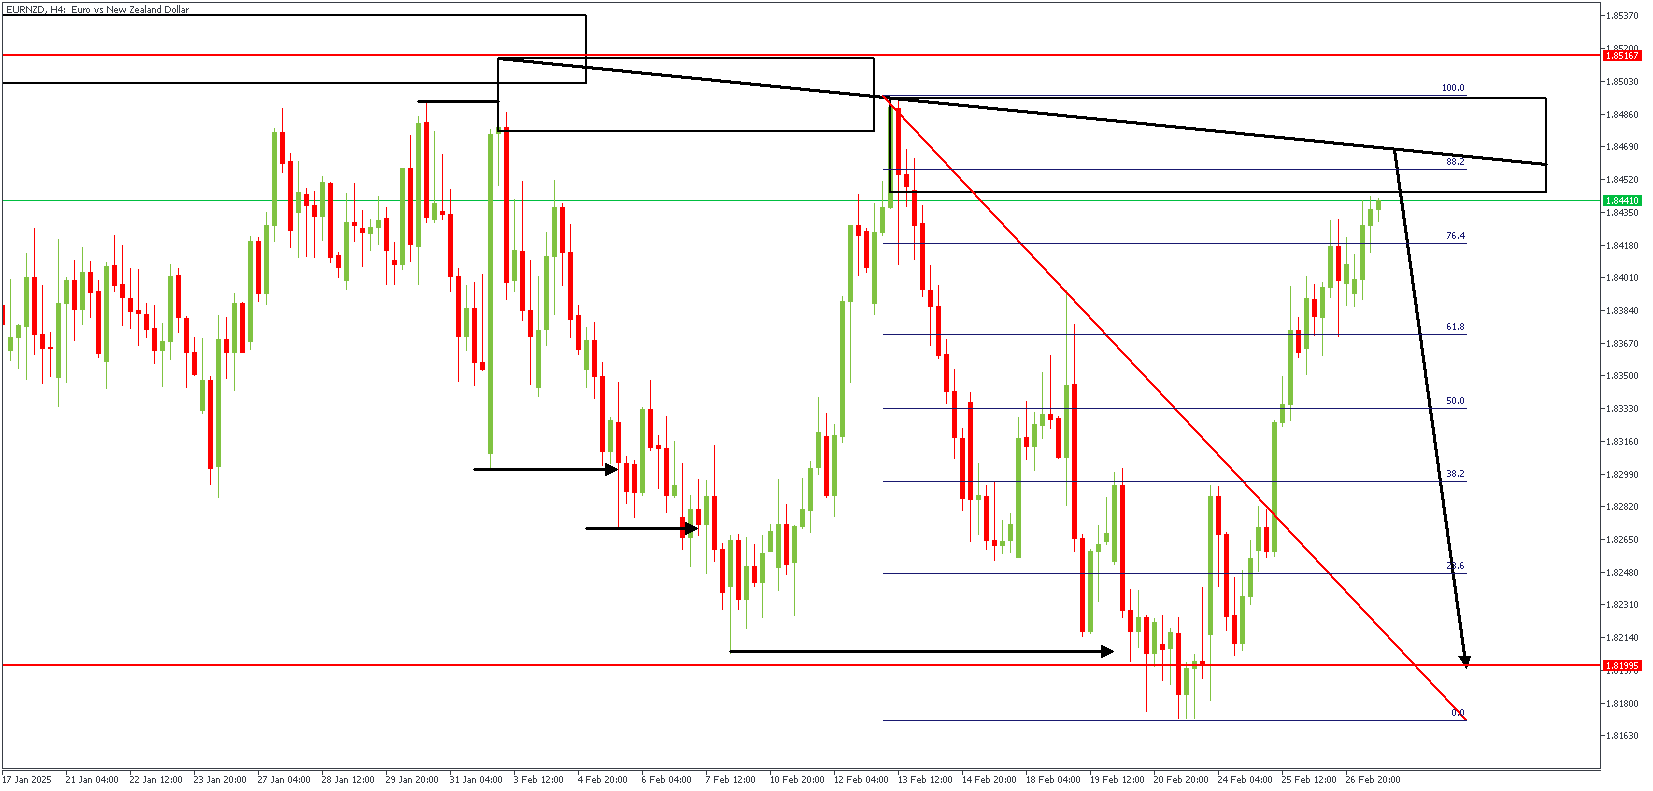
At the far left of the attached price action chart on the daily timeframe chart of EURNZD, we see the initial supply zone followed by an SBR pattern, the peak of which was the rejection from the supply zone. The presence of trendline resistance at the newly formed supply region is the basis for the bearish sentiment.
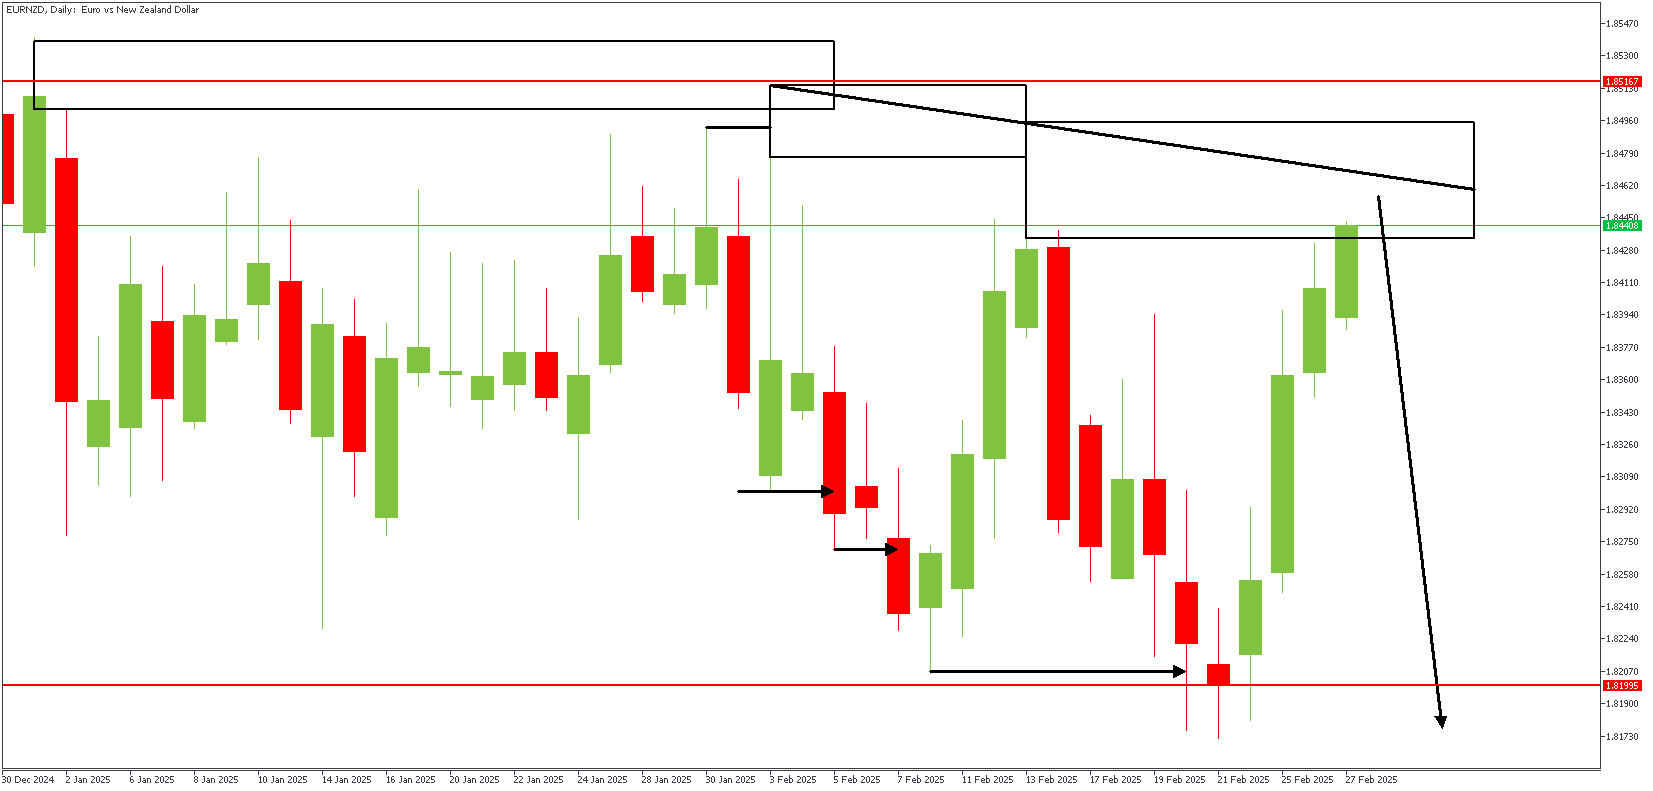
EURNZD – H4 Timeframe
The 4-hour timeframe chart of the EURNZD pair's price action further reveals that the supply zone overlaps the 88% Fibonacci retracement level, with the liquidity from the recent high already swept. In this case, the overall sentiment aligns with the lower timeframe price action.
Analyst's Expectations:
- Direction: Bearish
- Target- 1.81995
- Invalidation- 1.85167
Fed’s Schmid: Inflation risks rising, but growth concerns loom
Kansas City Federal Reserve President Jeff Schmid cautioned in a speech today there were "sharp upward movement" in some measures of expected inflation in the past two months.
While acknowledging the imperfections and volatility of survey-based inflation expectations, Schmid emphasized that now is "not the time to let down our guard," given inflation’s recent history of reaching a four-decade high.
He expressed reluctance to dismiss the recent uptick in expectations as a "one-off transitory developments", stressing that Fed must remain vigilant against a resurgence in inflationary pressures.
At the same time, Schmid noted that the economic outlook is highly uncertain. Feedback from businesses in his district, along with some recent economic data, indicates that Fed might need to carefully "balance inflation risks against growth concerns."
Sunset Market Commentary
Markets
Trump’s tariff threat against Europe weighed on European risk sentiment with key indices losing between 0.50% and 1.50%. In the first cabinet meeting of his second term, the US president suggested that a plan was made and that then announcement would follow soon: “It will be 25% generally speaking, and that will be on cars and all other things.” The damage for the euro could have been bigger with EUR/USD slipping from just below the 1.0533 resistance area towards 1.0460-1.0480 until the early morning eco data releases. European yields were barely impacted. The European eco calendar contained sticky Spanish and Belgian inflation together with a slightly stronger economic confidence indicator by the EC. Minutes of the previous ECB meeting bolster the case for more rate cuts by the ECB beyond March as downside growth risks prevail, though at a slower pace. ECB Schnabel and Wunsch earlier hinted in the direction of pausing in April. Markets ignored today’s European input.
Volatility intensified in the run-up to the US opening bell. First, US eco data added to the recent shift from Goldilocks to stagflation with weekly jobless claims unexpectedly spiking from 220k to 242k (matching highest since early October 2024; DOGE at work?!), US core capital goods shipments (input for GDP calculation) declining (instead of the hoped-for increasing) by 0.3% M/M in January and the core PCE priced index facing an upward revision for Q4 (2.7% from 2.5%). The impact of the data mainly showed in a spike lower in US yields, but those moves didn’t last. Next came US President Trump who clarified yesterday’s messy communication on tariffs against neighboring countries Mexico and Canada. They will go into effect on March 4 instead of April 2 like Trump yesterday falsely suggested. China will also be charged an additional 10% tariff from that date onwards. Currencies of (potential) tariff victims suffered the biggest setback with EUR/USD extending its slide towards 1.0420. USD/CAD moves from 1.4360 to 1.4430 and USD/MXN from 20.35 to 20.55. US stock futures handed in some of the earlier gains because of the third element at play this morning: Q4 Nvidia earnings. Strong results were at first met by some skepticism as market gotten acquainted to stellar rather than good numbers. In pre-market trading, investors are nevertheless giving the thumbs up, supporting the broader equity market.
News & Views
Belgian inflation (CPI; national methodology) rose in February by 0.2% M/M and 3.55% Y/Y, easing from 1.39% M/M and 3.55% Y/Y in January. Core inflation excluding energy products and unprocessed food was little changed at 3.1% Y/Y. In a monthly perspective, gas prices rose 2.6%, electricity prices 1.5%, flowers and plants’ prices increased 8% M/M with the price of water consumption rising 5.5% due to a price increase in the Walloon region. Prices for clothes declined 4.3% M/M. In a broader perspective, services prices inflation rose 4.34% Y/Y from 4.13%. Rents inflation eased slightly (3.3 from 3.41%). Food inflation stood at 2.22% from 2.54%. Due to a base effect from the removal of household premiums last year, energy inflation also eased from 15.89% Y/Y to 8.71% Y/Y this month. The first estimate of according to European harmonized index (HICP) amounts to 4.4% (unchanged). A separate report, showed that hourly labour costs in the economy in Q4 increased by 2.2% at an annual basis.
Swiss Q4 GDP growth (adjusted for sporting events) was solid, accelerating from 0.2% Q/Q to 0.5% Q/Q. Activity was 1.2% higher Y/Y. In an expenditure approach, domestic demand was the main driver with a solid performance of private consumption and government consumption, both adding 0.5% Q/Q, slightly above historical averages. Construction investment also rose 0.5% Q/Q. After two negative quarters, spending on equipment and software investment grew 1.0% Q/Q. For 2024 as a whole, adjusted growth is estimated at 0.9% Y/Y, from 1.2% in the previous year. In a production approach, decent growth was recorded in manufacturing (1.9%) due to the chemicals and the pharmaceutical industry while accommodation and food services (+3.5%) profited from international tourism. Retail trade also performed well (1%) for the second consecutive quarter. With inflation still extremely low (0.4% Y/Y in Jan) and plenty of uncertainty looming, the solid Q4 data probably won’t prevent the SNB from further cutting its policy rate in March 20 from 0.5% now to 0.25%. EUR/CHF holds within the 0.932/0.952 range.
EUR/GBP Mid-Day Outlook
Daily Pivots: (S1) 0.8256; (P) 0.8280; (R1) 0.8295; More...
EUR/GBP's fall from 0.8472 resumed by breaking through 0.8264 temporary low. Intraday bias is now back on the downside for retesting 0.8201/21 key support level. Firm break there will carry larger bearish implications. For now, risk will stay on the downside as long as 0.8304 resistance holds, in case of recovery.
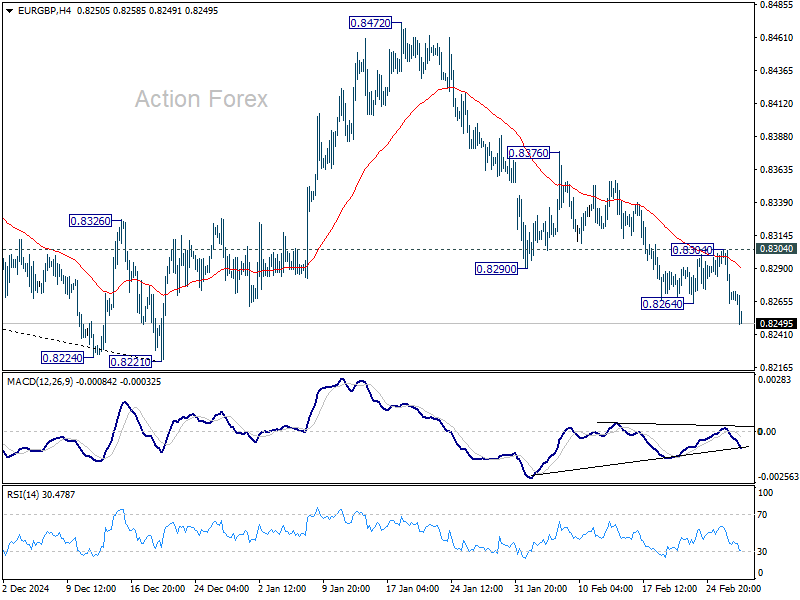
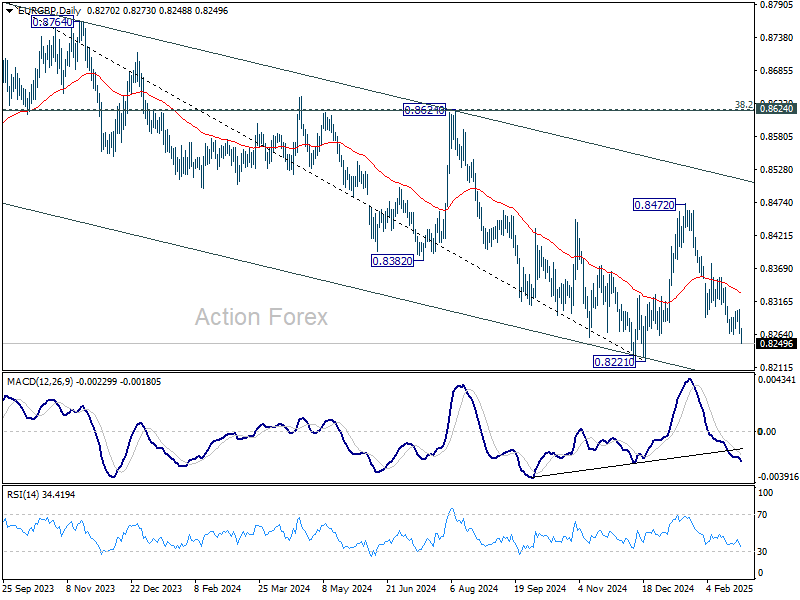
In the bigger picture, the medium term down trend remains intact with EUR/GBP staying well inside the falling channel. Prior rejection by 55 W EMA (now at 0.8431) also affirm bearishness. Decisive break of 0.8201/8221 support zone will resume whole down trend from 0.9449 (2020 high) and carry larger bearish implications.
USD/CAD Mid-Day Outlook
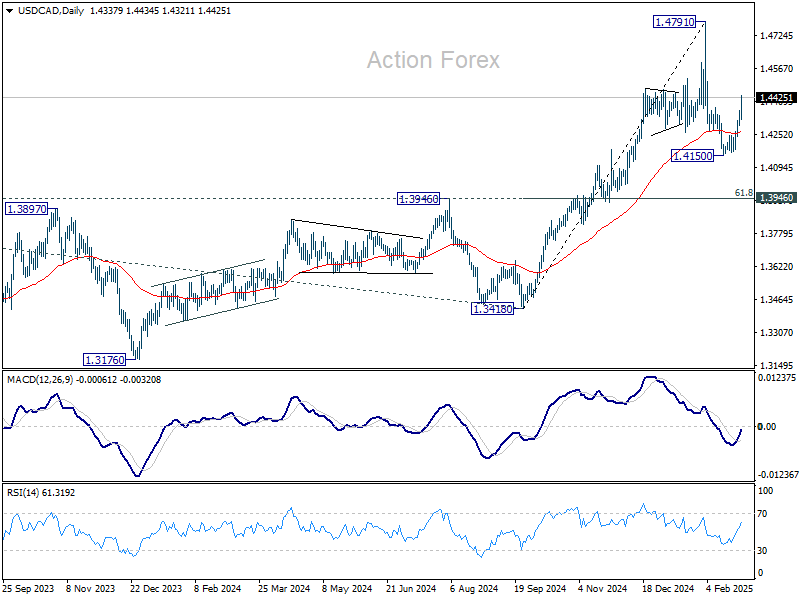
Daily Pivots: (S1) 1.4297; (P) 1.4333; (R1) 1.4372; More...
USD/CAD's break of 1.4378 resistance suggests that corrective pullback from 1.4791 has already completed at 1.4150. Intraday bias is back on the upside for retesting 1.4791 high next. On the downside, though, break of 55 4H EMA (now at 1.4276) will extend the correction through 1.4150 to 1.3946 cluster support (61.8% retracement of 1.3418 to 1.4791 at 1.3942).
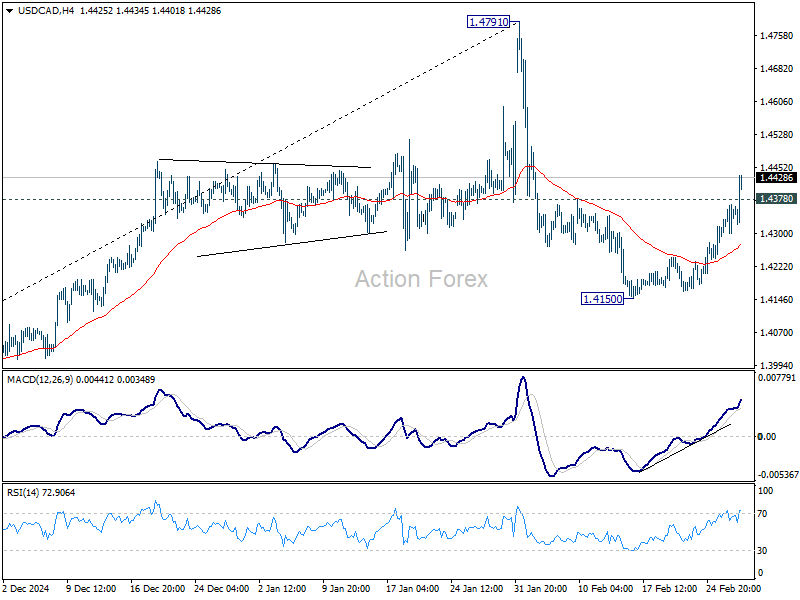
In the bigger picture, long term up trend is tentatively seen as resuming with prior breach of 1.4667/89 key resistance zone (2020/2015 highs). Next target is 100% projection of 1.2401 to 1.3976 from 1.3418 at 1.4993. This will remain the favored case as long as 1.3976 resistance turned support holds (2022 high), even in case of deep pullback.
USD/JPY Mid-Day Outlook
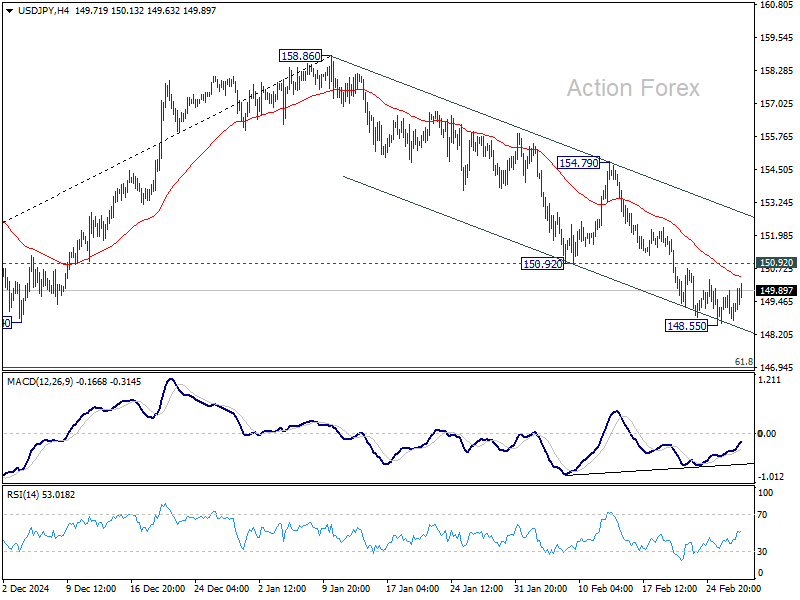
Daily Pivots: (S1) 148.52; (P) 149.20; (R1) 149.78; More....
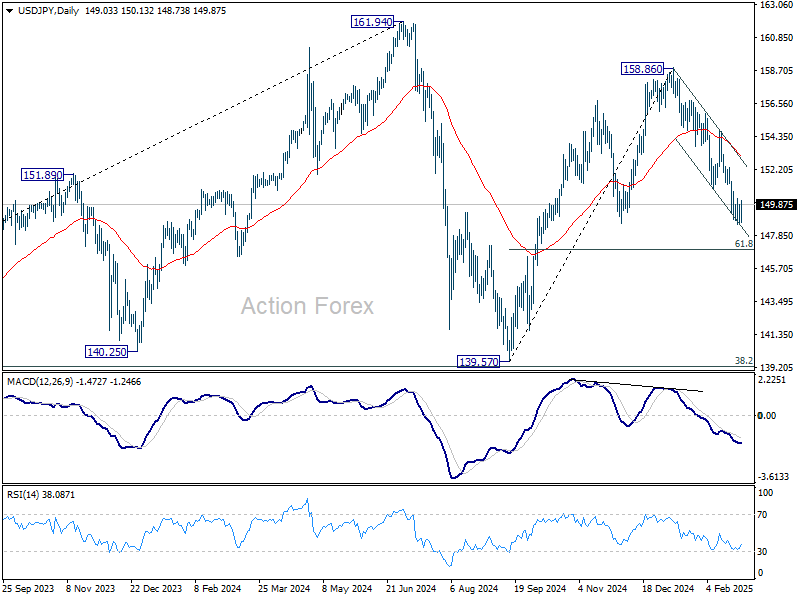
Intraday bias in USD/JPY is turned neutral first, but further fall is in favor with 150.92 support turned resistance intact. Current fall from 158.86 is seen as the third leg of the pattern from 161.94 high. Below 148.55 will target 61.8% retracement of 139.57 to 158.86 at 146.32 next. On the upside, however, break of 150.92 will indicate short term bottoming and bring stronger rebound.
In the bigger picture, price actions from 161.94 are seen as a corrective pattern to rise from 102.58 (2021 low). In case of another fall, strong support should be seen from 38.2% retracement of 102.58 to 161.94 at 139.26 to bring rebound. However, sustained break of 139.26 would open up deeper medium term decline to 61.8% retracement at 125.25.
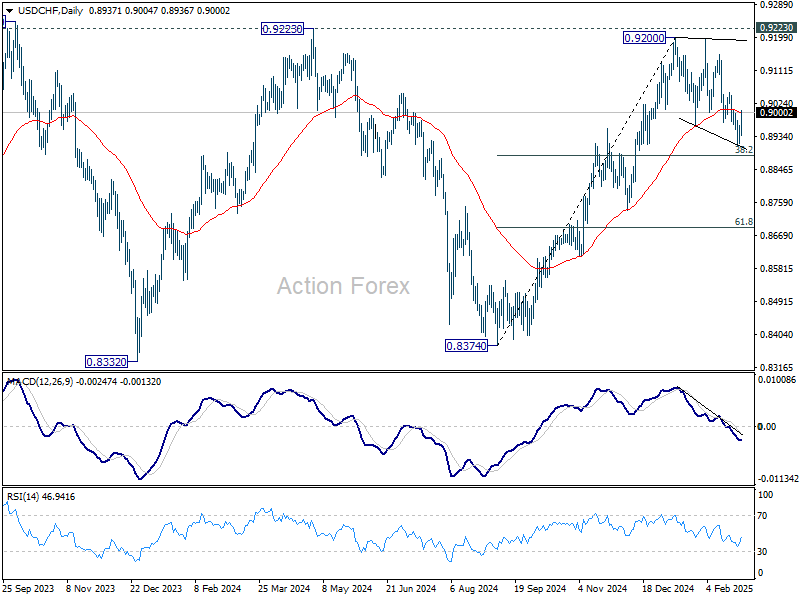
USD/CHF Mid-Day Outlook
Daily Pivots: (S1) 0.8920; (P) 0.8943; (R1) 0.8969; More…
Intraday bias in USD/CHF stays neutral at this point. On the upside, firm break of 0.9053 resistance will suggest that corrective pattern from 0.9200 has already completed. Further rally should then be seen to retest 0.9200 resistance. In case of another fall, downside should be contained by 38.2% retracement of 0.8374 to 0.9200 at 0.8884 to bring rebound.
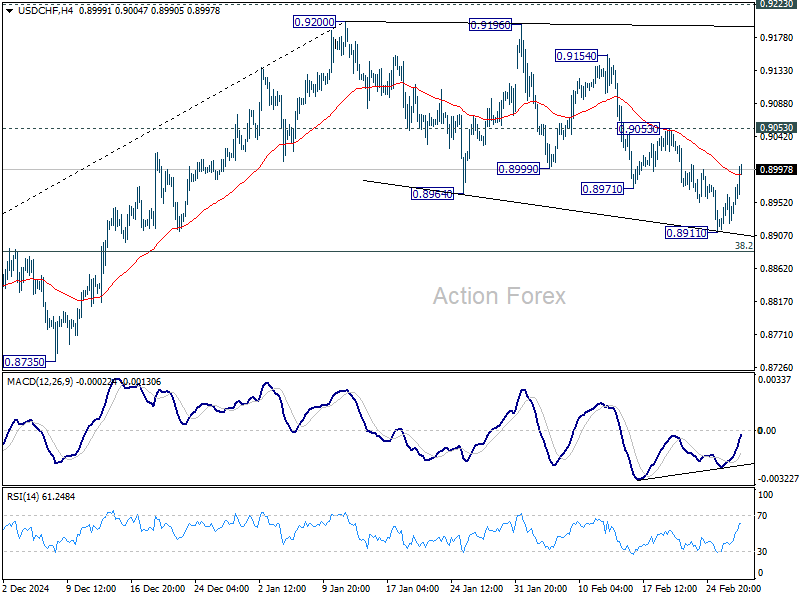
In the bigger picture, decisive break of 0.9223 resistance will argue that whole down trend from 1.0342 (2017 high) has completed with three waves down to 0.8332 (2023 low). Outlook will be turned bullish for 1.0146 resistance next. Nevertheless, rejection by 0.9223 will retain medium term bearishness for another decline through 0.8332 at a later stage.
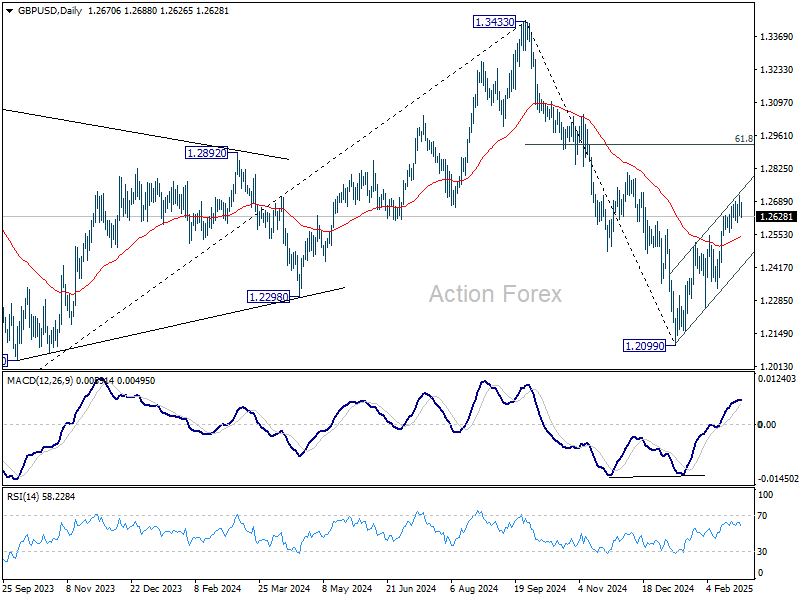
GBP/USD Mid-Day Outlook
Daily Pivots: (S1) 1.2635; (P) 1.2676; (R1) 1.2716; More...
Further rise in GBP/USD remains mildly in favor with 1.2602 minor support intact, towards 1.2810 resistance. However, considering bearish divergence condition in 4H MACD, firm break of 1.2602 will indicate short term topping. Intraday bias will be turned back to the downside for near term channel support (now at 1.2424).
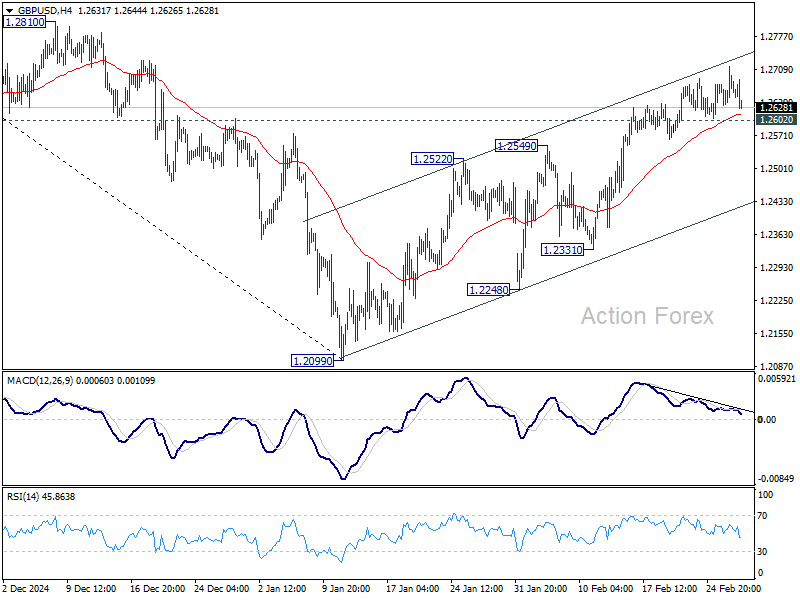
In the bigger picture, rise from 1.0351 (2022 low) should have already completed at 1.3433 (2024 high), and the trend has reversed. Further fall is now expected as long as 1.2810 resistance holds. Deeper decline should be seen to 61.8% retracement of 1.0351 to 1.3433 at 1.1528, even as a corrective move. However, firm break of 1.2810 will dampen this bearish view and bring retest of 1.3433 high instead.