Sample Category Title
U.S. Economic Growth Remains Solid in the Fourth Quarter
The second estimate of fourth quarter real GDP growth was unchanged at 2.3% quarter-over-quarter (annualized) – in line with the consensus forecast. This marked a slight deceleration from the 3% pace in the prior two quarters.
Consumer spending remained strong and unchanged at 4.2%, but goods spending was revised down to 6.1% (from 6.6%), while services spending was revised up to 3.3% (from 3.1%). Non-residential investment fell 3.2% ( revised down from 2.2%), but residential investment remained a bright spot as it grew by 5.4% (up from 5.3%). The drag from private inventories was pared back slightly, with this category subtracting 0.8 percentage points (pp) to overall GDP (from -0.9 pp previously).
Government spending expanded by a healthy 2.9% (up from 2.5%), with federal spending up 4% and state & local spending up 2.2%.
Net exports contributed a minor 0.1 percentage points to Q4 GDP growth (up modestly from the flat reading in the prior estimate). This as the decline in exports was pared back slightly to -0.5% (from -0.8%), while imports fell more than in the initial estimate (-1.2% from -0.8%).
Key Implications
The second reading of fourth quarter U.S. GDP carried through only modest revisions, leaving intact the theme of solid economic activity at the end of last year. The consumer continued to power growth, while government spending and residential investment also lent a hand. But elsewhere, there were some signs of softness, with pullbacks in non-residential investment and inventories impeding an even better showing in overall growth.
Focusing on 2025, while there's plenty of uncertainty with things like tariffs and other policy measures hanging in the balance, we anticipate the U.S. economy will have another solid year, with growth to ease only moderately to 2.4% (from 2.8% in 2024). The consumer remains central to this theme and should continue to provide plenty of support ahead (see our Quarterly Q&A publication). That said, spending in 2025 appears to have got off to a slow start, after a strong December. A weak January retail sales report already alludes to this, but tomorrow's "personal income and spending" report will confirm if this was indeed the case.
EUR/USD Mid-Day Outlook
Daily Pivots: (S1) 1.0464; (P) 1.0496; (R1) 1.0518; More...
EUR/USD dips notably in early US session but stays above 1.0400 support. Intraday bias stays neutral first. Firm break of 1.0400 should indicate that corrective pattern from 1.0400 has completed. Intraday bias will be back on the downside for retesting 1.0176/0210 support zone. Overall, near term outlook will stay bearish as long as 38.2% retracement of 1.1213 to 1.0176 at 1.0572 holds in case of another recovery.
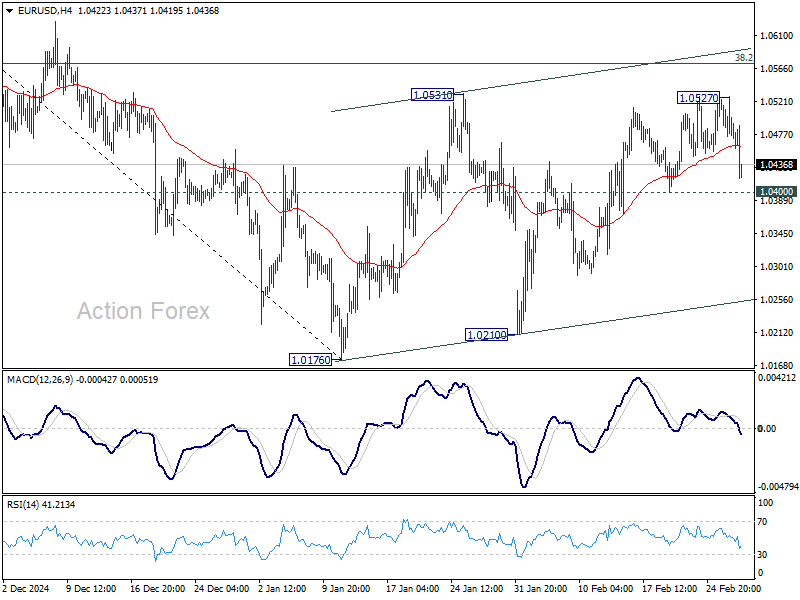
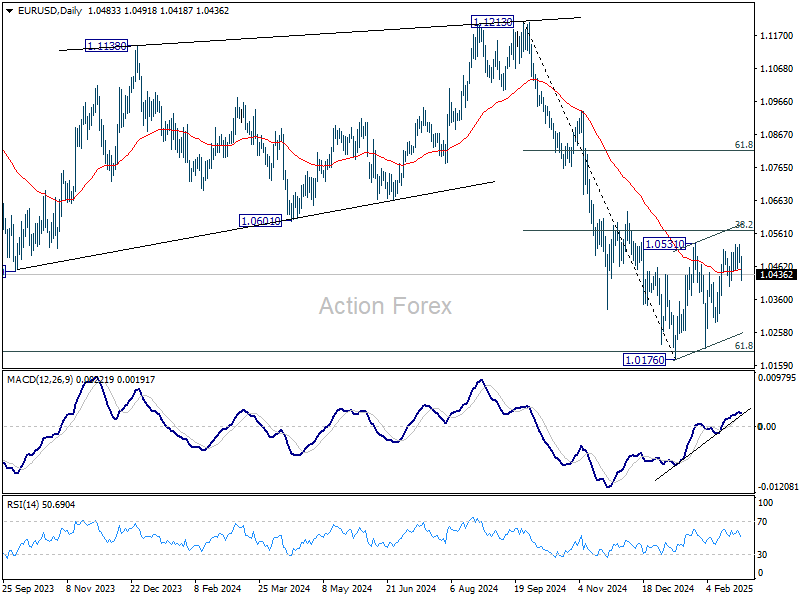
In the bigger picture, immediate focus is on 61.8 retracement of 0.9534 (2022 low) to 1.1274 (2024 high) at 1.0199. Sustained break there will solidify the case of medium term bearish trend reversal, and pave the way back to 0.9534. However, reversal from 1.0199 will argue that price actions from 1.1274 are merely a corrective pattern, and has already completed.
Dollar Surges as Trump Confirms Tariff Plans, Euro Looks Vulnerable
Dollar surged sharply across the board in early US session trading after US President Donald Trump reinforced his tariff plans, clarifying uncertainties that had lingered in the market. In a Truth Social post, Trump confirmed that the tariffs on Canada and Mexico will "go into effect, as scheduled" on March 4. Additionally, China will face an extra 10% tariff on the same date. The April 2 reciprocal tariff announcement will also remain "in full force and effect," he stated.
Market reaction was swift, with the greenback rallying against all major peers, even as incoming US economic data provided a mixed picture. January durable goods orders came in stronger than expected, but only driven largely by transportation equipment. Also, the labor market flashed a potential warning sign, as initial jobless claims surged to their highest level since December.
Yen and Swiss Franc are on the softer side today as US and European benchmark yields rebounded. However, neither currency showed a strong directional push. Euro, on the other hand, appears increasingly vulnerable, particularly against the British Pound. The latest selloff in EUR/GBP looks poised to gain further traction, as Eurozone fundamentals remain weak and tariff threats linger.
For the week so far, Dollar is now the strongest one with today's rally. Sterling is sitting as the second, followed by Yen. Kiwi and Aussie are the worst performers for now, followed by Loonie. Euro and Swiss Franc are mixed in the middle.
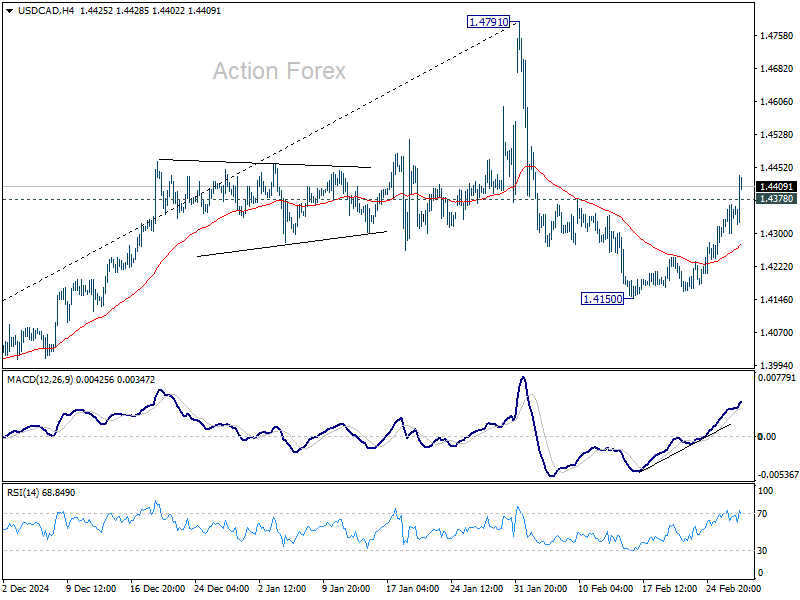
Technically, USD/CAD's strong break of 1.4378 resistance suggests that corrective pullback from 1.4791 has already completed at 1.4150. Further rise is expected as long as 55 4H EMA (now at 1.4275) holds, for retesting 1.4791 high. Strong resistance might be seen there to limit upside on first attempt.
However, the final implementation of tariffs on Canada might provided the needed fuel to power USD/CAD through 1.4791 to resume the larger up trend.
In Europe, at the time of writing, FTSE is up 0.04%. DAX is down -1.20%. CAC is down -0.77%. UK 10-year yield is up 0.014 at 4.520. Germany 10-year yield is up 0.002 at 2.438. Earlier in Asia, Nikkei rose 0.30%. Hong Kong HSI fell -0.29%. China Shanghai SSE rose 0.23%. Singapore Strait Times rose 0.34%. Japan 10-year JGB yield rose 0.003 to 1.396.
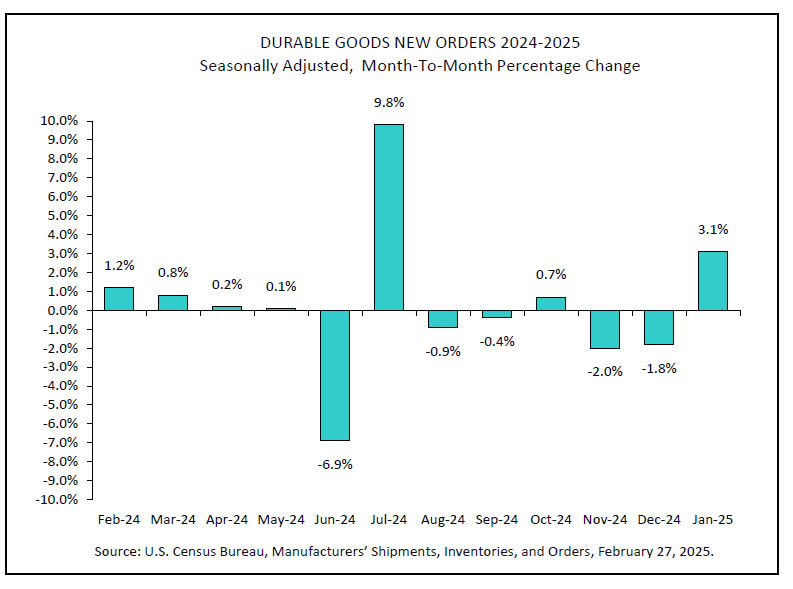
US durable goods orders rise 3.1% mom, led by transportation equipment
US durable goods orders rose 3.1% mom to USD 286.0B in January, well above expectation of 2.0% mom. Transportation equipment led the increase by 9.8% to USD 96.5B.
Ex-transport orders was flat at 189.5B, below expectation of 0.4% mom. Ex-defense orders rose 3.5% mom to USD 268.7B.
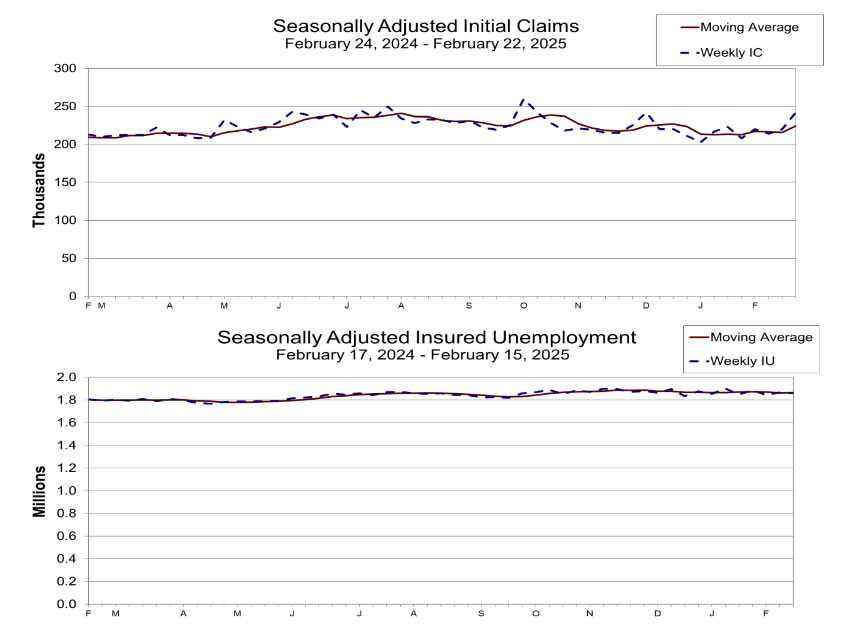
US initial jobless claims jump to 242k, above expectation 220k
US initial jobless claims rose 22k to 242k in the week ending February 22, above expectation of 220k. Four-week moving average of initial claims rose 8.5k to 224k.
Continuing claims fell -5k to 1862k in the week ending February 15. Four-week moving average of continuing claims rose 3k to 1865k.
ECB Minutes: No room for forward guidance as caution prevails
ECB's January 29-30 meeting account revealed that policymakers saw a "clear case" for a 25bps rate cut. Members agreed that disinflation is "well on track", and confidence in inflation converging to target has grown.
However, the accounts highlighted several lingering uncertainties that warranted a cautious approach going forward. Policymakers emphasized the need to maintain a data-dependent stance, with "no room for forward guidance" at this stage.
Upside risks to inflation remained from elevated energy and food prices, strong wage growth, and persistent services inflation.
ECB also flagged geopolitical tensions, fiscal policy concerns within Eurozone, and global trade uncertainties as downside risks to growth, "which typically also implied downside risks to inflation over longer horizons."
Swiss GDP expands 0.2% qoq in Q4, driven by domestic demand
Switzerland's economy maintained steady growth in Q4, with GDP expanding 0.5% qoq when adjusted for sporting events. Without the adjustment, GDP rose 0.2% qoq, in-line with expectations.
Private consumption increased by 0.5%, supported by higher spending on health, recreation, and culture. Government consumption also grew at the same pace, slightly exceeding historical trends.
Investment in equipment rebounded 1.0%, breaking a two-quarter decline, largely due to higher spending on aircraft and other volatile categories.
The increase in domestic demand also led to a 0.9% rise in imports of goods and services, with foreign trade contributing positively to GDP growth.
RBA’s Hauser: Global uncertainty justifies rate cut, but more easing depends on disnflation evidence
RBA Deputy Governor Andrew Hauser told the parliament today that mounting global uncertainty had a chilling effect on economic activity, which played a role in the board’s decision to cut the cash rate by 25 bps this month.
He noted that businesses are becoming increasingly cautious, delaying investment projects and expansion plans as they wait for clearer economic signals, "just to see how things pan out."
This hesitation, he suggested, made a slight easing of monetary policy a "sensible" response to support economic stability.
However, Hauser emphasized that further rate cuts are not guaranteed and will depend on incoming inflation data. Policymakers remain optimistic about further disinflation but need to see clear evidence before committing to additional policy easing.
NZ ANZ business confidence rises to 58.4, on the path to recovery
New Zealand’s ANZ Business Confidence rose from 54.4 to 58.4 in February. However, the Own Activity Outlook, slipped slightly from 45.8 to 45.1, highlighting that while sentiment is improving, actual activity remains uncertain.
Pricing and cost indicators painted a mixed picture. Inflation expectations for the next year eased from 2.67% to 2.53% and cost expectations fell from 73.6 to 71.3. But wage expectations remained elevated at 79.2 despite fall from 83.1, and pricing intentions ticked up from 45.7 to 46.2.
ANZ noted that the economy is on the "path to recovery," supported by lower interest rates and stronger-than-expected commodity export prices. However, the bank cautioned that the next phase of growth remains "a point of debate."
The pace of expansion will depend on how households perceive current interest rates, the extent to which global uncertainty influences business investment, and whether firms push forward despite challenges. Additionally, potential labor shortages could emerge as a key constraint on further growth.
EUR/USD Mid-Day Outlook
Daily Pivots: (S1) 1.0464; (P) 1.0496; (R1) 1.0518; More...
EUR/USD dips notably in early US session but stays above 1.0400 support. Intraday bias stays neutral first. Firm break of 1.0400 should indicate that corrective pattern from 1.0400 has completed. Intraday bias will be back on the downside for retesting 1.0176/0210 support zone. Overall, near term outlook will stay bearish as long as 38.2% retracement of 1.1213 to 1.0176 at 1.0572 holds in case of another recovery.
In the bigger picture, immediate focus is on 61.8 retracement of 0.9534 (2022 low) to 1.1274 (2024 high) at 1.0199. Sustained break there will solidify the case of medium term bearish trend reversal, and pave the way back to 0.9534. However, reversal from 1.0199 will argue that price actions from 1.1274 are merely a corrective pattern, and has already completed.
US initial jobless claims jump to 242k, above expectation 220k
US initial jobless claims rose 22k to 242k in the week ending February 22, above expectation of 220k. Four-week moving average of initial claims rose 8.5k to 224k.
Continuing claims fell -5k to 1862k in the week ending February 15. Four-week moving average of continuing claims rose 3k to 1865k.
US durable goods orders rise 3.1% mom, led by transportation equipment
US durable goods orders rose 3.1% mom to USD 286.0B in January, well above expectation of 2.0% mom. Transportation equipment led the increase by 9.8% to USD 96.5B.
Ex-transport orders was flat at 189.5B, below expectation of 0.4% mom. Ex-defense orders rose 3.5% mom to USD 268.7B.
ECB Minutes: No room for forward guidance as caution prevails
ECB's January 29-30 meeting account revealed that policymakers saw a "clear case" for a 25bps rate cut. Members agreed that disinflation is "well on track", and confidence in inflation converging to target has grown.
However, the accounts highlighted several lingering uncertainties that warranted a cautious approach going forward. Policymakers emphasized the need to maintain a data-dependent stance, with "no room for forward guidance" at this stage.
Upside risks to inflation remained from elevated energy and food prices, strong wage growth, and persistent services inflation.
ECB also flagged geopolitical tensions, fiscal policy concerns within Eurozone, and global trade uncertainties as downside risks to growth, "which typically also implied downside risks to inflation over longer horizons."
(ECB) Monetary policy accounts
Account of the monetary policy meeting of the Governing Council of the European Central Bank held in Frankfurt am Main on Wednesday and Thursday, 29-30 January 2025
27 February 2025
1. Review of financial, economic and monetary developments and policy options
Financial market developments
Ms Schnabel noted that the financial market developments observed in the euro area after October 2024 had reversed since the Governing Council’s previous monetary policy meeting on 11-12 December 2024. The US presidential election in November had initially led to lower euro area bond yields and equity prices. Since the December monetary policy meeting, however, both risk-free yields and risk asset prices had moved substantially higher and had more than made up their previous declines. A less gloomy domestic macroeconomic outlook and an increase in the market’s outlook for inflation in the euro area on the back of higher energy prices had led investors to expect the ECB to proceed with a more gradual rate easing path.
A bounce-back of euro area risk appetite had supported equity and corporate bond prices and had contained sovereign bond spreads. While the euro had also rebounded recently against the US dollar, it remained significantly weaker than before the US election.
In euro money markets the year-end had been smooth. Money market conditions at the turn of the year had turned out to be more benign than anticipated, with a decline in repo rates and counterparties taking only limited recourse to the ECB’s standard refinancing operations.
In the run-up to the US election and in its immediate aftermath, ten-year overnight index swap (OIS) rates in the euro area and the United States had decoupled, reflecting expectations of increasing macroeconomic divergence. However, since the Governing Council’s December monetary policy meeting, long-term interest rates had increased markedly in both the euro area and the United States. An assessment of the drivers of euro area long-term rates showed that both domestic and US factors had pushed yields up. But domestic factors – expected tighter ECB policy and a less gloomy euro area macroeconomic outlook – had mattered even more than US spillovers. These factors included a reduction in perceived downside risks to economic growth from tariffs and a stronger than anticipated January flash euro area Purchasing Managers’ Index (PMI).
Taking a longer-term perspective on ten-year rates, since October 2022, when inflation had peaked at 10.6% and policy rates had just returned to positive territory, nominal OIS rates and their real counterparts had been broadly trending sideways. From that perspective, the recent uptick was modest and could be seen as a mean reversion to the new normal.
A decomposition of the change in ten-year OIS rates since the start of 2022 showed that the dominant driver of persistently higher long-term yields compared with the “low-for-long” interest rate and inflation period had been the sharp rise in real rate expectations. A second major driver had been an increase in real term premia in the context of quantitative tightening. This increase had occurred mainly in 2022. Since 2023, real term premia had broadly trended sideways albeit with some volatility. Hence, the actual reduction of the ECB’s balance sheet had elicited only mild upward pressure on term premia. From a historical perspective, despite their recent increase, term premia in the euro area remained compressed compared with the pre-quantitative easing period.
Since the December meeting, investors had revised up their expectations for HICP inflation (excluding tobacco) for 2025. Current inflation fixings (swap contracts linked to specific monthly releases in year-on-year euro area HICP inflation excluding tobacco) for this year stood above the 2% target. Higher energy prices had been a key driver of the reassessment of near-term inflation expectations. Evidence from option prices, calculated under the assumption of risk neutrality, suggested that the risk to inflation in financial markets had become broadly balanced, with the indicators across maturities having shifted discernibly upwards. Recent survey evidence suggested that risks of inflation overshooting the ECB’s target of 2% had resurfaced. Respondents generally saw a bigger risk of an inflation overshoot than of an inflation undershoot.
The combination of a less gloomy macroeconomic outlook and stronger price pressures had led markets to reassess the ECB’s expected monetary policy path. Market pricing suggested expectations of a more gradual easing cycle with a higher terminal rate, pricing out the probability of a cut larger than 25 basis points at any of the next meetings. Overall, the size of expected cuts to the deposit facility rate in 2025 had dropped by around 40 basis points, with the end-year rate currently seen at 2.08%. Market expectations for 2025 stood above median expectations in the Survey of Monetary Analysts. Survey participants continued to expect a faster easing cycle, with cuts of 25 basis points at each of the Governing Council’s next four monetary policy meetings.
The Federal Funds futures curve had continued to shift upwards, with markets currently expecting between one and two 25 basis point cuts by the end of 2025. The repricing of front-end yields since the Governing Council’s December meeting had been stronger in the euro area than in the United States. This would typically also be reflected in foreign exchange markets. However, the EUR/USD exchange rate had recently decoupled from interest rates, as the euro had initially continued to depreciate despite a narrowing interest rate differential, before recovering more recently. US dollar currency pairs had been affected by the US Administration’s comments, which had put upward pressure on the US dollar relative to trading partners’ currencies.
Euro area equity markets had outperformed their US counterparts in recent weeks. A model decomposition using a standard dividend discount model for the euro area showed that rising risk-free yields had weighed significantly on euro area equity prices. However, this had been more than offset by higher dividends, and especially a compression of the risk premium, indicating improved investor risk sentiment towards the euro area, as also reflected in other risk asset prices. Corporate bond spreads had fallen across market segments, including high-yield bonds. Sovereign spreads relative to the ten-year German Bund had remained broadly stable or had even declined slightly. Relative to OIS rates, the spreads had also remained broadly stable. The Bund-OIS spread had returned to levels observed before the Eurosystem had started large-scale asset purchases in 2015, suggesting that the scarcity premium in the German government bond market had, by and large, normalised.
Standard financial condition indices for the euro area had remained broadly stable since the December meeting. The easing impulse from higher equity prices had counterbalanced the tightening impulse stemming from higher short and long-term rates. In spite of the bounce-back in euro area real risk-free interest rates, the yield curve remained broadly within neutral territory.
The global environment and economic and monetary developments in the euro area
Starting with inflation in the euro area, Mr Lane noted that headline inflation, as expected, had increased to 2.4% in December, up from 2.2% in November. The increase primarily reflected a rise in energy inflation from -2.0% in November to 0.1% in December, due mainly to upward base effects. Food inflation had edged down to 2.6%. Core inflation was unchanged at 2.7% in December, with a slight decline in goods inflation, which had eased to 0.5%, offset by services inflation rising marginally to 4.0%.
Developments in most indicators of underlying inflation had been consistent with a sustained return of inflation to the medium-term inflation target. The Persistent and Common Component of Inflation (PCCI), which had the best predictive power of any underlying inflation indicator for future headline inflation, had continued to hover around 2% in December, indicating that headline inflation was set to stabilise around the ECB’s inflation target. Domestic inflation, which closely tracked services inflation, stood at 4.2%, staying well above all the other indicators in December. However, the PCCI for services, which should act as an attractor for services and domestic inflation, had fallen to 2.3%.
The anticipation of a downward shift in services inflation in the coming months also related to an expected deceleration in wage growth this year. Wages had been adjusting to the past inflation surge with a substantial delay, but the ECB wage tracker and the latest surveys pointed to moderation in wage pressures. According to the latest results of the Survey on the Access to Finance of Enterprises, firms expected wages to grow by 3.3% on average over the next 12 months, down from 3.5% in the previous survey round and 4.5% in the equivalent survey this time last year. This assessment was shared broadly across the forecasting community. Consensus Economics, for example, foresaw a decline in wage growth of about 1 percentage point between 2024 and 2025.
Most measures of longer-term inflation expectations continued to stand at around 2%, despite an uptick over shorter horizons. Although, according to the Survey on the Access to Finance of Enterprises, the inflation expectations of firms had stabilised at 3% across horizons, the expectations of larger firms that were aware of the ECB’s inflation target showed convergence towards 2%. Consumer inflation expectations had edged up recently, especially for the near term. This could be explained at least partly by their higher sensitivity to actual inflation. There had also been an uptick in the near-term inflation expectations of professionals – as captured by the latest vintages of the Survey of Professional Forecasters and the Survey of Monetary Analysts, as well as market-based measures of inflation compensation. Over longer horizons, though, the inflation expectations of professional forecasters remained stable at levels consistent with the medium-term target of 2%.
Headline inflation should fluctuate around its current level in the near term and then settle sustainably around the target. Easing labour cost pressures and the continuing impact of past monetary policy tightening should support the convergence to the inflation target.
Turning to the international environment, global economic activity had remained robust around the turn of the year. The global composite PMI had held steady at 53.0 in the fourth quarter of 2024, owing mainly to the continued strength in the services sector that had counterbalanced weak manufacturing activity.
Since the Governing Council’s previous meeting, the euro had remained broadly stable in nominal effective terms (+0.5%) and against the US dollar (+0.2%). Oil prices had seen a lot of volatility, but the latest price, at USD 78 per barrel, was only around 3½% above the spot oil price at the cut-off date for the December Eurosystem staff projections and 2.6% above the spot price at the time of the last meeting. With respect to gas prices, the spot price stood at €48 per MWh, 2.7% above the level at the cut-off date for the December projections and 6.8% higher than at the time of the last meeting.
Following a comparatively robust third quarter, euro area GDP growth had likely moderated again in the last quarter of 2024 – confirmed by Eurostat’s preliminary flash estimate released on 30 January at 11:00 CET, with a growth rate of 0% for that quarter, later revised to 0.1%. Based on currently available information, private consumption growth had probably slowed in the fourth quarter amid subdued consumer confidence and heightened uncertainty. Housing investment had not yet picked up and there were no signs of an imminent expansion in business investment. Across sectors, industrial activity had been weak in the summer and had softened further in the last few months of 2024, with average industrial production excluding construction in October and November standing 0.4% below its third quarter level. The persistent weakness in manufacturing partly reflected structural factors, such as sectoral trends, losses in competitiveness and relatively high energy prices. However, manufacturing firms were also especially exposed to heightened uncertainty about global trade policies, regulatory costs and tight financing conditions. Service production had grown in the third quarter, but the expansion had likely moderated in the fourth quarter.
The labour market was robust, with the unemployment rate falling to a historical low of 6.3% in November – with the figure for December (6.3%) and a revised figure for November (6.2%) released later on the morning of 30 January. However, survey evidence and model estimates suggested that euro area employment growth had probably softened in the fourth quarter.
The fiscal stance for the euro area was now expected to be balanced in 2025, as opposed to the slight tightening foreseen in the December projections. Nevertheless, the current outlook for the fiscal stance was subject to considerable uncertainty.
The euro area economy was set to remain subdued in the near term. The flash composite output PMI for January had ticked up to 50.2 driven by an improvement in manufacturing output, as the rate of contraction had eased compared with December. The January release had been 1.7 points above the average for the fourth quarter, but it still meant that the manufacturing sector had been in contractionary territory for nearly two years. The services business activity index had decelerated slightly to 51.4 in January, staying above the average of 50.9 in the fourth quarter of 2024 but still below the figure of 52.1 for the third quarter.
Even with a subdued near-term outlook, the conditions for a recovery remained in place. Higher incomes should allow spending to rise. More affordable credit should also boost consumption and investment over time. And if trade tensions did not escalate, exports should also support the recovery as global demand rose.
Turning to the monetary and financial analysis, bond yields, in both the euro area and globally, had increased significantly since the last meeting. At the same time, the ECB’s past interest rate cuts were gradually making it less expensive for firms and households to borrow. Lending rates on bank loans to firms and households for new business had continued to decline in November. In the same period, the cost of borrowing for firms had decreased by 15 basis points to 4.52% and stood 76 basis points below the cyclical peak observed in October 2023. The cost of issuing market-based debt had remained at 3.6% in November 2024. Mortgage rates had fallen by 8 basis points to 3.47% since October, 56 basis points lower than their peak in November 2023. However, the interest rates on existing corporate and household loan books remained high.
Financing conditions remained tight. Although credit was expanding, lending to firms and households was subdued relative to historical averages. Annual growth in bank lending to firms had risen to 1.5% in December, up from 1% in November, as a result of strong monthly flows. But it remained well below the 4.3% historical average since January 1999. By contrast, growth in corporate debt securities issuance had moderated to 3.2% in annual terms, from 3.6% in November. This suggested that firms had substituted market-based long-term financing for bank-based borrowing amid tightening market conditions and in advance of increasing redemptions of long-term corporate bonds. Mortgage lending had continued to rise gradually but remained muted overall, with an annual growth rate of 1.1% in December after 0.9% in November. This was markedly below the long-term average of 5.1%.
According to the latest euro area bank lending survey, the demand for loans by firms had increased slightly in the last quarter. At the same time, credit standards for loans to firms had tightened again, having broadly stabilised over the previous four quarters. This renewed tightening of credit standards for firms had been motivated by banks seeing higher risks to the economic outlook and their lower tolerance for taking on credit risk. This finding was consistent with the results of the Survey on the Access to Finance of Enterprises, in which firms had reported a small decline in the availability of bank loans and tougher non-rate lending conditions. Turning to households, the demand for mortgages had increased strongly as interest rates became more attractive and prospects for the property market improved. Credit standards for housing loans remained unchanged overall.
Monetary policy considerations and policy options
In summary, the disinflation process remained well on track. Inflation had continued to develop broadly in line with the staff projections and was set to return to the 2% medium-term target in the course of 2025. Most measures of underlying inflation suggested that inflation would settle around the target on a sustained basis. Domestic inflation remained high, mostly because wages and prices in certain sectors were still adjusting to the past inflation surge with a substantial delay. However, wage growth was expected to moderate and lower profit margins were partially buffering the impact of higher wage costs on inflation. The ECB’s recent interest rate cuts were gradually making new borrowing less expensive for firms and households. At the same time, financing conditions continued to be tight, also because monetary policy remained restrictive and past interest rate hikes were still being transmitted to the stock of credit, with some maturing loans being rolled over at higher rates. The economy was still facing headwinds, but rising real incomes and the gradually fading effects of restrictive monetary policy should support a pick-up in demand over time.
Concerning the monetary policy decision at this meeting, it was proposed to lower the three key ECB interest rates by 25 basis points. In particular, lowering the deposit facility rate – the rate through which the ECB steered the monetary policy stance – was justified by the updated assessment of the inflation outlook, the dynamics of underlying inflation and the strength of monetary policy transmission. The alternative – maintaining the deposit facility rate at the current level of 3.00% – would excessively dampen demand and therefore be inconsistent with the set of rate paths that best ensured inflation stabilised sustainably at the 2% medium-term target.
Looking to the future, it was prudent to maintain agility, so as to be able to adjust the stance as appropriate on a meeting-by-meeting basis, and not to pre-commit to any particular rate path. In particular, monetary easing might proceed more slowly in the event of upside shocks to the inflation outlook and/or to economic momentum. Equally, in the event of downside shocks to the inflation outlook and/or to economic momentum, monetary easing might proceed more quickly.
2. Governing Council’s discussion and monetary policy decisions
Economic, monetary and financial analyses
As regards the external environment, incoming data since the Governing Council’s previous monetary policy meeting had signalled robust global activity in the fourth quarter of 2024, with divergent paths across economies and an uncertain outlook for global trade. The euro had been broadly stable and energy commodity prices had increased. It was underlined that gas prices were currently over 60% higher than in 2024 because the average temperature during the previous winter had been very mild, whereas this winter was turning out to be considerably colder. This suggested that demand for gas would remain strong, as reserves needed to be replenished ahead of the next heating season, keeping gas prices high for the remainder of the year. In other commodity markets, metal prices were stable – subdued by weak activity in China and the potential negative impact of US tariffs – while food prices had increased.
Members concurred that the outlook for the international economy remained highly uncertain. The United States was the only advanced economy that was showing sustained growth dynamics. Global trade might be hit hard if the new US Administration were to implement the measures it had announced. The challenges faced by the Chinese economy also remained visible in prices. Chinese inflation had declined further on the back of weak domestic demand. In this context, it was pointed out that, no matter how severe the new US trade measures turned out to be, the euro area would be affected either indirectly by disinflationary pressures or directly, in the event of retaliation, by higher inflation. In particular, if China were to redirect trade away from the United States and towards the euro area, this would make it easier to achieve lower inflation in the euro area but would have a negative impact on domestic activity, owing to greater international competition.
With regard to economic activity in the euro area, it was widely recognised that incoming data since the last Governing Council meeting had been limited and, ahead of Eurostat’s indicator of GDP for the fourth quarter of 2024, had not brought any major surprises. Accordingly, it was argued that the December staff projections remained the most likely scenario, with the downside risks to growth that had been identified not yet materialising. The euro area economy had seen some encouraging signs in the January flash PMIs, although it had to be recognised that, in these uncertain times, hard data seemed more important than survey results. The outcome for the third quarter had surprised on the upside, showing tentative signs of a pick-up in consumption. Indications from the few national data already available for the fourth quarter pointed to a positive contribution from consumption. Despite all the prevailing uncertainties, it was still seen as plausible that, within a few quarters, there would be a consumption-driven recovery, with inflation back at target, policy rates broadly at neutral levels and continued full employment. Moreover, the latest information on credit flows and lending rates suggested that the gradual removal of monetary restrictiveness was already being transmitted to the economy, although the past tightening measures were still exerting lagged effects.
The view was also expressed that the economic outlook in the December staff projections had likely been too optimistic and that there were signs of downside risks materialising. The ECB’s mechanical estimates pointed to very weak growth around the turn of the year and, compared with other institutions, the Eurosystem’s December staff projections had been among the most optimistic. Attention was drawn to the dichotomy between the performance of the two largest euro area economies and that of the rest of the euro area, which was largely due to country-specific factors.
Recent forecasts from the Survey of Professional Forecasters, the Survey of Monetary Analysts and the International Monetary Fund once again suggested a downward revision of euro area economic growth for 2025 and 2026. Given this trend of downward revisions, doubts were expressed about the narrative of a consumption-driven economic recovery in 2025. Moreover, the December staff projections had not directly included the economic impact of possible US tariffs in the baseline, so it was hard to be optimistic about the economic outlook. The outlook for domestic demand had deteriorated, as consumer confidence remained weak and investment was not showing any convincing signs of a pick-up. The contribution from foreign demand, which had been the main driver of growth over the past two years, had also been declining since last spring. Moreover, uncertainty about potential tariffs to be imposed by the new US Administration was weighing further on the outlook. In the meantime, labour demand was losing momentum. The slowdown in economic activity had started to affect temporary employment: these jobs were always the first to disappear as the labour market weakened. At the same time, while the labour market had softened over recent months, it continued to be robust, with the unemployment rate staying low, at 6.3% in December. A solid job market and higher incomes should strengthen consumer confidence and allow spending to rise.
There continued to be a strong dichotomy between a more dynamic services sector and a weak manufacturing sector. The services sector had remained robust thus far, with the PMI in expansionary territory and firms reporting solid demand. The extent to which the weakness in manufacturing was structural or cyclical was still open to debate, but there was a growing consensus that there was a large structural element, as high energy costs and strict regulation weighed on firms’ competitiveness. This was also reflected in weak export demand, despite the robust growth in global trade. All these factors also had an adverse impact on business investment in the industrial sector. This was seen as important to monitor, as a sustainable economic recovery also depended on a recovery in investment, especially in light of the vast longer-term investment needs of the euro area. Labour markets showed a dichotomy similar to the one observed in the economy more generally. While companies in the manufacturing sector were starting to lay off workers, employment in the services sector was growing. At the same time, concerns were expressed about the number of new vacancies, which had continued to fall. This two-speed economy, with manufacturing struggling and services resilient, was seen as indicating only weak growth ahead, especially in conjunction with the impending geopolitical tensions.
Against this background, geopolitical and trade policy uncertainty was likely to continue to weigh on the euro area economy and was not expected to recede anytime soon. The point was made that if uncertainty were to remain high for a prolonged period, this would be very different from a shorter spell of uncertainty – and even more detrimental to investment. Therefore the economic recovery was unlikely to receive much support from investment for some time. Indeed, excluding Ireland, euro area business investment had been contracting recently and there were no signs of a turnaround. This would limit investment in physical and human capital further, dragging down potential output in the medium term. However, reference was also made to evidence from psychological studies, which suggested that the impact of higher uncertainty might diminish over time as agents’ perceptions and behaviour adapted.
In this context, a remark was made on the importance of monetary and fiscal policies for enabling the economy to return to its previous growth path. Economic policies were meant to stabilise the economy and this stabilisation sometimes required a long time. After the pandemic, many economic indicators had returned to their pre-crisis levels, but this had not yet implied a return to pre-crisis growth paths, even though the output gap had closed in the meantime. A question was raised on bankruptcies, which were increasing in the euro area. To the extent that production capacity was being destroyed, the output gap might be closing because potential output growth was declining, and not because actual growth was increasing. However, it was also noted that bankruptcies were rising from an exceptionally low level and developments remained in line with historical regularities.
Members reiterated that fiscal and structural policies should make the economy more productive, competitive and resilient. They welcomed the European Commission’s Competitiveness Compass, which provided a concrete roadmap for action. It was seen as crucial to follow up, with further concrete and ambitious structural policies, on Mario Draghi’s proposals for enhancing European competitiveness and on Enrico Letta’s proposals for empowering the Single Market. Governments should implement their commitments under the EU’s economic governance framework fully and without delay. This would help bring down budget deficits and debt ratios on a sustained basis, while prioritising growth-enhancing reforms and investment.
Against this background, members assessed that the risks to economic growth remained tilted to the downside. Greater friction in global trade could weigh on euro area growth by dampening exports and weakening the global economy. Lower confidence could prevent consumption and investment from recovering as fast as expected. This could be amplified by geopolitical risks, such as Russia’s unjustified war against Ukraine and the tragic conflict in the Middle East, which could disrupt energy supplies and further weigh on global trade. Growth could also be lower if the lagged effects of monetary policy tightening lasted longer than expected. It could be higher if easier financing conditions and falling inflation allowed domestic consumption and investment to rebound faster.
On price developments, members concurred with Mr Lane’s assessment that the incoming data confirmed disinflation was on track and that a return to the target in the course of 2025 was within reach. On the nominal side, there had been no major data surprises since the December Governing Council meeting and inflation expectations remained well anchored. Recent inflation data had been slightly below the December staff projections, but energy prices were on the rise. These two elements by and large offset one another. The inflation baseline from the December staff projections was therefore still a realistic scenario, indicating that inflation was on track to converge towards target in the course of 2025. Nevertheless, it was recalled that, for 2027, the contribution from the new Emissions Trading System (ETS2) assumptions was mechanically pushing the Eurosystem staff inflation projections above 2%. Furthermore, the market fixings for longer horizons suggested that there was a risk of undershooting the inflation target in 2026 and 2027. It was remarked that further downside revisions to the economic outlook would tend to imply a negative impact on the inflation outlook and an undershooting of inflation could not be ruled out.
At the same time, the view was expressed that the risks to the December inflation projections were now tilted to the upside, so that the return to the 2% inflation target might take longer than previously expected. Although it was acknowledged that the momentum in services inflation had eased in recent months, the outlook for inflation remained heavily dependent on the evolution of services inflation, which accounted for around 75% of headline inflation. Services inflation was therefore widely seen as the key inflation component to monitor during the coming months. Services inflation had been stuck at roughly 4% for more than a year, while core inflation had also proven sluggish after an initial decline, remaining at around 2.7% for nearly a year. This raised the question as to where core inflation would eventually settle: in the past, services inflation and core inflation had typically been closely connected. It was also highlighted that, somewhat worryingly, the inflation rate for “early movers” in services had been trending up since its trough in April 2024 and was now standing well above the “followers” and the “late movers” at around 4.6%. This partly called into question the narrative behind the expected deceleration in services inflation. Moreover, the January flash PMI suggested that non-labour input costs, including energy and shipping costs, had increased significantly. The increase in the services sector had been particularly sharp, which was reflected in rising PMI selling prices for services – probably also fuelled by the tight labour market. As labour hoarding was a more widespread phenomenon in manufacturing, this implied that a potential pick-up in demand and the associated cyclical recovery in labour productivity would not necessarily dampen unit labour costs in the services sector to the same extent as in manufacturing.
One main driver of the stickiness in services inflation was wage growth. Although wage growth was expected to decelerate in 2025, it would still stand at 4.5% in the second quarter of 2025 according to the ECB wage tracker. The pass-through of wages tended to be particularly strong in the services sector and occurred over an extended period of time, suggesting that the deceleration in wages might take some time to be reflected in lower services inflation. The forward-looking wage tracker was seen as fairly reliable, as it was based on existing contracts, whereas focusing too much on lagging wage data posed the risk of monetary policy falling behind the curve. This was particularly likely if negative growth risks eventually affected the labour market. Furthermore, a question was raised as to the potential implications for wage pressures of more restrictive labour migration policies.
Overall, looking ahead there seemed reasons to believe that both services inflation and wage growth would slow down in line with the baseline scenario in the December staff projections. From the current quarter onwards, services inflation was expected to decline. However, in the early months of the year a number of services were set to be repriced, for instance in the insurance and tourism sectors, and there were many uncertainties surrounding this repricing. It was therefore seen as important to wait until March, when two more inflation releases and the new projections would be available, to reassess the inflation baseline as contained in the December staff projections.
As regards longer-term inflation expectations, members took note of the latest developments in market-based measures of inflation compensation and survey-based indicators. The December Consumer Expectations Survey showed another increase in near-term inflation expectations, with inflation expectations 12 months ahead having already gradually picked up from 2.4% in September to 2.8% in December. Density-based expectations were even higher at 3%, with risks tilted to the upside. According to the Survey on the Access to Finance of Enterprises, firms’ median inflation expectations had also risen to 3%. However it was regarded as important to focus more on the change in inflation expectations than on the level of expectations when interpreting these surveys.
As regards risks to the inflation outlook, with respect to the market-based measures, the view was expressed that there had been a shift in the balance of risks, pointing to upside risks to the December inflation outlook. In financial markets, inflation fixings for 2025 had shifted above the December short-term projections and inflation expectations had picked up across all tenors. In market surveys, risks of overshooting had resurfaced, with a larger share of respondents in the surveys seeing risks of an overshooting in 2025. Moreover, it was argued that tariffs, their implications for the exchange rate, and energy and food prices posed upside risks to inflation.
Against this background, members considered that inflation could turn out higher if wages or profits increased by more than expected. Upside risks to inflation also stemmed from the heightened geopolitical tensions, which could push energy prices and freight costs higher in the near term and disrupt global trade. Moreover, extreme weather events, and the unfolding climate crisis more broadly, could drive up food prices by more than expected. By contrast, inflation might surprise on the downside if low confidence and concerns about geopolitical events prevented consumption and investment from recovering as fast as expected, if monetary policy dampened demand by more than expected, or if the economic environment in the rest of the world worsened unexpectedly. Greater friction in global trade would make the euro area inflation outlook more uncertain.
Turning to the monetary and financial analysis, members broadly agreed with the assessment presented by Ms Schnabel and Mr Lane. It was noted that market interest rates in the euro area had risen since the Governing Council’s December monetary policy meeting, partly mirroring higher rates in global financial markets. Overall, financial conditions had been broadly stable, with higher short and long-term interest rates being counterbalanced by strong risk asset markets and a somewhat weaker exchange rate.
Long-term interest rates had been rising more substantially than short-term ones, resulting in a steepening of the yield curve globally since last autumn. At the same time, it was underlined that the recent rise in long-term bond yields did not appear to be particularly striking when looking at developments over a longer time period. Over the past two years long-term rates had remained remarkably stable, especially when taking into account the pronounced variation in policy rates.
The dynamics of market rates since the December Governing Council meeting had been similar on both sides of the Atlantic. This reflected higher term premia as well as a repricing of rate expectations. However, the relative contributions of the underlying drivers differed. In the United States, one factor driving up market interest rates had been an increase in inflation expectations, combined with the persistent strength of the US economy as well as concerns over prospects of higher budget deficits. This had led markets to price out some of the rate cuts that had been factored into the rate expectations prevailing before the Federal Open Market Committee meeting in December 2024. Uncertainty regarding the policies implemented by the new US Administration had also contributed to the sell-off in US government bonds. In Europe, term premia accounted for a significant part of the increase in long-term rates, which could be explained by a combination of factors. These included spillovers from the United States, concerns over the outlook for fiscal policy, and domestic and global policy uncertainty more broadly. Attention was also drawn to the potential impact of tighter monetary policy in Japan, the world’s largest creditor nation, with Japanese investors likely to start shifting their funds away from overseas investments towards domestic bond markets in response to rising yields.
The passive reduction in the Eurosystem’s balance sheet, as maturing bonds were no longer reinvested, was also seen as exerting gradual upward pressure on term premia over longer horizons, although this had not been playing a significant role – especially not in developments since the last meeting. The reduction had been indicated well in advance and had already been priced in, to a significant extent, at the time the phasing out of reinvestment had been announced. The residual Eurosystem portfolios were still seen to be exerting substantial downside pressure on longer-term sovereign yields as compared with a situation in which asset holdings were absent. It was underlined that, while declining central bank holdings did affect financial conditions, quantitative tightening was operating gradually and smoothly in the background.
In the context of the discussion on long-term yields, attention was drawn to the possibility that rising yields might also lead to financial stability risks, especially in view of the high level of valuations and leverage in the world economy. A further financial stability risk related to the prospect of a more deregulated financial system in the United States, including in the realm of crypto-assets. This could allow risks to build up in the years to come and sow the seeds of a future financial crisis.
Turning to financing conditions, past interest rate cuts were gradually making it less expensive for firms and households to borrow. For new business, rates on bank loans to firms and households had continued to decline in November. However, the interest rates on existing loans remained high, and financing conditions remained tight.
Although credit was expanding, lending to firms and households was subdued relative to historical averages. Growth in bank lending to firms had risen to 1.5% in December in annual terms, up from 1.0% in November. Mortgage lending had continued to rise gradually but remained muted overall, with an annual growth rate of 1.1% in December following 0.9% in November. Nevertheless, the increasing pace of loan growth was encouraging and suggested monetary easing was starting to be transmitted through the bank lending channel. Some comfort could also be taken from the lack of evidence of any negative impact on bank lending conditions from the decline in excess liquidity in the banking system.
The bank lending survey was providing mixed signals, however. Credit standards for mortgages had been broadly unchanged in the fourth quarter, after easing for a while, and banks expected to tighten them in the next quarter. Banks had reported the third strongest increase in demand for mortgages since the start of the survey in 2003, driven primarily by more attractive interest rates. This indicated a turnaround in the housing market as property prices picked up. At the same time, credit standards for consumer credit had tightened in the fourth quarter, with standards for firms also tightening unexpectedly. The tightening had largely been driven by heightened perceptions of economic risk and reduced risk tolerance among banks.
Caution was advised on overinterpreting the tightening in credit standards for firms reported in the latest bank lending survey. The vast majority of banks had reported unchanged credit standards, with only a small share tightening standards somewhat and an even smaller share easing them slightly. However, it was recalled that the survey methodology for calculating net percentages, which typically involved subtracting a small percentage of easing banks from a small percentage of tightening banks, was an established feature of the survey. Also, that methodology had not detracted from the good predictive power of the net percentage statistic for future lending developments. Moreover, the information from the bank lending survey had also been corroborated by the Survey on the Access to Finance of Enterprises, which had pointed to a slight decrease in the availability of funds to firms. The latter survey was now carried out at a quarterly frequency and provided an important cross-check, based on the perspective of firms, of the information received from banks.
Turning to the demand for loans by firms, although the bank lending survey had shown a slight increase in the fourth quarter it had remained weak overall, in line with subdued investment. It was remarked that the limited increase in firms’ demand for loans might mean they were expecting rates to be cut further and were waiting to borrow at lower rates. This suggested that the transmission of policy rate cuts was likely to be stronger as the end of the rate-cutting cycle approached. At the same time, it was argued that demand for loans to euro area firms was mainly being held back by economic and geopolitical uncertainty rather than the level of interest rates.
Monetary policy stance and policy considerations
Turning to the monetary policy stance, members assessed the data that had become available since the last monetary policy meeting in accordance with the three main elements the Governing Council had communicated in 2023 as shaping its reaction function. These comprised (i) the implications of the incoming economic and financial data for the inflation outlook, (ii) the dynamics of underlying inflation, and (iii) the strength of monetary policy transmission.
Starting with the inflation outlook, members widely agreed that the incoming data were broadly in line with the medium-term inflation trajectory embedded in the December staff projections. Inflation had been slightly lower than expected in both November and December. The outlook remained heavily dependent on the evolution of services inflation, which had remained close to 4% for more than a year. However, the momentum of services inflation had eased in recent months and a further decrease in wage pressures was anticipated, especially in the second half of 2025. Oil and gas prices had been higher than embodied in the December projections and needed to be closely monitored, but up to now they did not suggest a major change to the baseline in the staff projections.
Risks to the inflation outlook were seen as two-sided: upside risks were posed by the outlook for energy and food prices, a stronger US dollar and the still sticky services inflation, while a downside risk related to the possibility of growth being lower than expected. There was considerable uncertainty about the effect of possible US tariffs, but the estimated impact on euro area inflation was small and its sign was ambiguous, whereas the implications for economic growth were clearly negative. Further uncertainty stemmed from the possible downside pressures emanating from falling Chinese export prices.
There was some evidence suggesting a shift in the balance of risks to the upside since December, as reflected, for example, in market surveys showing that the risk of inflation overshooting the target outweighed the risk of an undershooting. Although some of the survey-based inflation expectations as well as market-derived inflation compensation had been revised up slightly, members took comfort from the fact that longer-term measures of inflation expectations remained well anchored at 2%.
Turning to underlying inflation, members concurred that developments in most measures of underlying inflation suggested that inflation would settle at around the target on a sustained basis. Core inflation had been sticky at around 2.7% for nearly a year but had also turned out lower than projected. A number of measures continued to show a certain degree of persistence, with domestic inflation remaining high and exclusion-based measures proving sticky at levels above 2%. In addition, the translation of wage moderation into a slower rise in domestic prices and unit labour costs was subject to lags and predicated on profit margins continuing their buffering role as well as a cyclical rebound in labour productivity. However, a main cause of stickiness in domestic inflation was services inflation, which was strongly influenced by wage growth, and this was expected to decelerate in the course of 2025.
As regards the transmission of monetary policy, recent credit dynamics showed that monetary policy transmission was working. Both the past tightening and the subsequent gradual removal of restriction were feeding through to financing conditions, including lending rates and credit flows. It was highlighted that not all demand components had been equally responsive, with, in particular, business investment held back by high uncertainty and structural weaknesses. Companies widely cited having their own funds as a reason for not making loan applications, and the reason for not investing these funds was likely linked to the high levels of uncertainty, rather than to the level of interest rates. Hence low investment was not necessarily a sign of a restrictive monetary policy. At the same time, it was unclear how much of the past tightening was still in the pipeline. Similarly, it would take time for the full effect of recent monetary policy easing to reach the economy, with even variable rate loans typically adjusting with a lag, and the same being true for deposits.
Monetary policy decisions and communication
Against this background, all members agreed with the proposal by Mr Lane to lower the three key ECB interest rates by 25 basis points. Lowering the deposit facility rate – the rate through which the monetary policy stance was steered – was justified by the updated assessment of the inflation outlook, the dynamics of underlying inflation and the strength of monetary policy transmission.
There was a clear case for a further 25 basis point rate cut at the current meeting, and such a step was supported by the incoming data. Members concurred that the disinflationary process was well on track, while the growth outlook continued to be weak. Although the goal had not yet been achieved and inflation was still expected to remain above target in the near term, confidence in a timely and sustained convergence had increased, as both headline and core inflation had recently come in below the ECB projections. In particular, a return of inflation to the 2% target in the course of 2025 was in line with the December staff baseline projections, which were constructed on the basis of an interest rate path that stood significantly below the present level of the forward curve.
At the same time, it was underlined that high levels of uncertainty, lingering upside risks to energy and food prices, a strong labour market and high negotiated wage increases, as well as sticky services inflation, called for caution. Upside risks could delay a sustainable return to target, while inflation expectations might be more fragile after a long period of high inflation. Firms had also learned to raise their prices more quickly in response to new inflationary shocks. Moreover, the financial market reactions to heightened geopolitical uncertainty or risk aversion often led to an appreciation of the US dollar and might involve spikes in energy prices, which could be detrimental to the inflation outlook.
Risks to the growth outlook remained tilted to the downside, which typically also implied downside risks to inflation over longer horizons. The outlook for economic activity was clouded by elevated uncertainty stemming from geopolitical tensions, fiscal policy concerns in the euro area and recent global trade frictions associated with potential future actions by the US Administration that might lead to a global economic slowdown. As long as the disinflation process remained on track, policy rates could be brought further towards a neutral level to avoid unnecessarily holding back the economy. Nevertheless, growth risks had not shifted to a degree that would call for an acceleration in the move towards a neutral stance. Moreover, it was argued that greater caution was needed on the size and pace of further rate cuts when policy rates were approaching neutral territory, in view of prevailing uncertainties.
Lowering the deposit facility rate to 2.75% at the current meeting was also seen as appropriate from a risk-management perspective. On the one hand, it left sufficient optionality to react to the possible emergence of new price pressures. On the other hand, it addressed the risk of falling behind the curve in dialling back restriction and guarded against inflation falling below target.
Looking ahead, it was regarded as premature for the Governing Council to discuss a possible landing zone for the key ECB interest rates as inflation converged sustainably to target. It was widely felt that even with the current deposit facility rate, it was relatively safe to make the assessment that monetary policy was still restrictive. This was also consistent with the fact that the economy was relatively weak. At the same time, the view was expressed that the natural or neutral rate was likely to be higher than before the pandemic, as the balance between the global demand for and supply of savings had changed over recent years. The main reasons for this were the high and rising global need for investment to deal with the green and digital transitions, the surge in public debt and increasing geopolitical fragmentation, which was reversing the global savings glut and reducing the supply of savings. A higher neutral rate implied that, with a further reduction in policy rates at the present meeting, rates would plausibly be getting close to neutral rate territory. This meant that the point was approaching where monetary policy might no longer be characterised as restrictive.
In this context, the remark was made that the public debate about the natural or neutral rate among market analysts and observers was becoming more intense, with markets trying to gauge the Governing Council’s assessment of it as a proxy for the terminal rate in the current rate cycle. This debate was seen as misleading, however. The considerable uncertainty as to the level of the natural or neutral interest rate was recalled. While the natural rate could in theory be a longer-term reference point for assessing the monetary policy stance, it was an unobservable variable. Its practical usefulness in steering policy on a meeting-by-meeting basis was questionable, as estimates were subject to significant model and parameter uncertainty, so confidence bands were too large to give any clear guidance. Moreover, the natural rate was a steady state concept, which was hardly applicable in a rapidly changing environment – as at present – with continuous new shocks.
Moreover, it was mentioned that a box describing the latest Eurosystem staff estimates of the natural rate would be published in the Economic Bulletin and pre-released on 7 February 2025. The box would emphasise the wide range of point estimates, the properties of the underlying models and the considerable statistical uncertainty surrounding each single point estimate. The view was expressed that there was no alternative to the Governing Council identifying, meeting by meeting, an appropriate policy rate path which was consistent with reaching the target over the medium term. Such an appropriate path could only be identified in real time, taking into account a sufficiently broad set of information.
Turning to communication aspects, it was widely stressed that maintaining a data-dependent approach with full optionality at every meeting was prudent and continued to be warranted. The present environment of elevated uncertainty further strengthened the case for taking decisions meeting by meeting, with no room for forward guidance. The meeting-by-meeting approach, guided by the three-criteria framework, was serving the Governing Council well and members were comfortable with the way markets were interpreting the ECB’s reaction function. It was also remarked that data-dependence did not imply being backward-looking in calibrating policy. Monetary policy was, by definition, forward-looking, as it affected inflation in the future and the primary objective was defined over the medium term. Data took many forms, and all relevant information had to be considered in a timely manner.
Taking into account the foregoing discussion among the members, upon a proposal by the President, the Governing Council took the monetary policy decisions as set out in the monetary policy press release. The members of the Governing Council subsequently finalised the monetary policy statement, which the President and the Vice-President would, as usual, deliver at the press conference following the Governing Council meeting.
Monetary policy statement
Monetary policy statement for the press conference of 30 January 2025
Press release
Meeting of the ECB’s Governing Council, 29-30 January 2025
Members
- Ms Lagarde, President
- Mr de Guindos, Vice-President
- Mr Centeno
- Mr Cipollone
- Mr Demarco, temporarily replacing Mr Scicluna
- Mr Dolenc, Deputy Governor of Banka Slovenije
- Mr Elderson
- Mr Escrivá*
- Mr Holzmann
- Mr Kālis, Acting Governor of Latvijas Banka
- Mr Kažimír
- Mr Knot
- Mr Lane
- Mr Makhlouf*
- Mr Müller
- Mr Nagel
- Mr Panetta
- Mr Patsalides*
- Mr Rehn
- Mr Reinesch
- Ms Schnabel
- Mr Šimkus
- Mr Stournaras*
- Mr Villeroy de Galhau
- Mr Vujčić*
- Mr Wunsch
* Members not holding a voting right in January 2025 under Article 10.2 of the ESCB Statute.
Other attendees
- Mr Dombrovskis, Commissioner**
- Ms Senkovic, Secretary, Director General Secretariat
- Mr Rostagno, Secretary for monetary policy, Director General Monetary Policy
- Mr Winkler, Deputy Secretary for monetary policy, Senior Adviser, DG Monetary Policy
** In accordance with Article 284 of the Treaty on the Functioning of the European Union.
Accompanying persons
- Mr Arpa
- Ms Bénassy-Quéré
- Mr Debrun
- Mr Gavilán
- Mr Gilbert
- Mr Kaasik
- Mr Koukoularides
- Mr Lünnemann
- Mr Madouros
- Mr Martin
- Mr Nicoletti Altimari
- Mr Novo
- Mr Rutkaste
- Ms Schembri
- Mr Šiaudinis
- Mr Šošić
- Mr Tavlas
- Mr Ulbrich
- Mr Välimäki
- Ms Žumer Šujica
Other ECB staff
- Mr Proissl, Director General Communications
- Mr Straub, Counsellor to the President
- Ms Rahmouni-Rousseau, Director General Market Operations
- Mr Arce, Director General Economics
- Mr Sousa, Deputy Director General Economics
Release of the next monetary policy account foreseen on 3 April 2025.
Crypto: Is Lowest Sentiment Best Moment to Buy?
Market Picture
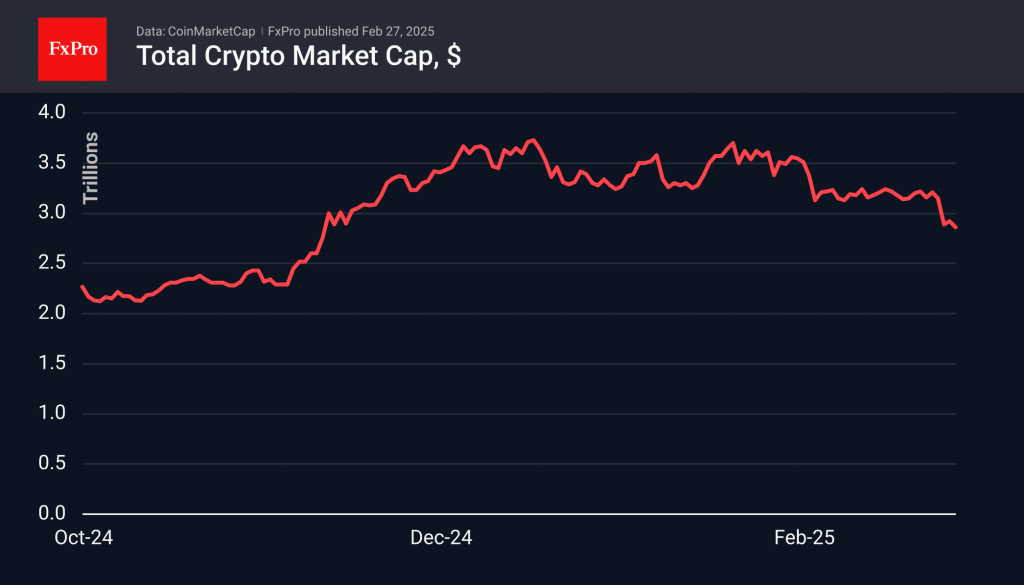
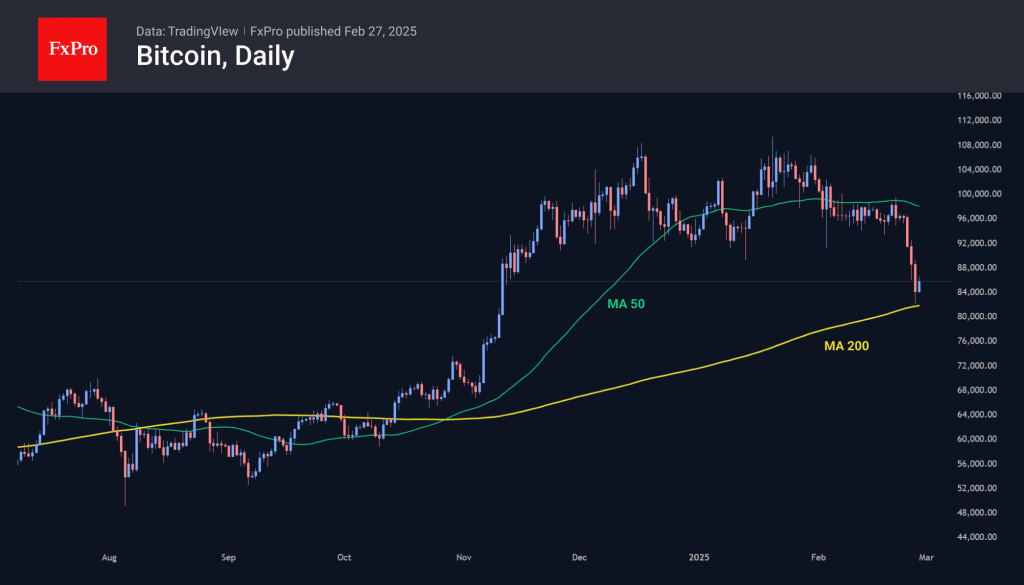
The cryptocurrency market stabilised in the first half of Wednesday, but by the end, a new wave of selloffs began, leading to new lows since early November at $2.75 trillion. In the morning, attempts were again made to stabilise the market. Increased trading activity was accompanied by increased volumes, indicating both accelerated liquidation of positions and interest in buying on declines.
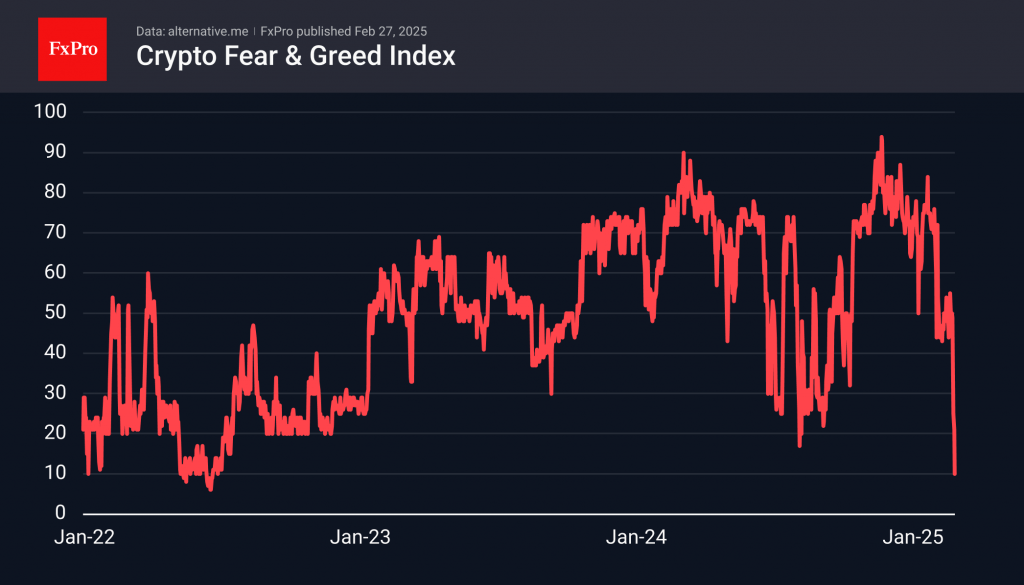
The Fear and Greed Index fell to 10, which is an indicator of extreme fear and was last recorded in June 2022. The index has only been below this value for 19 days in its seven-year history. While the indicator is intended to be a good buy point, experience trading other markets suggests that this may be far from a lower price point.
Bitcoin is trading around the $86,000 mark, although the previous evening, it was approaching $82,000 and touching its 200-day moving average. Earlier in the week, the consolidation pattern was broken, and now market participants are trying to determine the endpoint of the decline.
Unusually, the largest altcoins remained within the range established the day before despite the significant decline over the week.
News Background
Institutional investor demand for BTC has reached its limit, according to QCP Capital. The period of high uncertainty in the market will continue for a few more weeks against the backdrop of the Trump administration’s decision to impose duties on goods from Canada and Mexico, as well as to limit investments of Chinese companies in the American economy.
Experts at QCP Capital warn that in volatile markets, cryptocurrencies remain the first assets to be liquidated as traders seek to reduce risk.
In Ethereum options, open interest in contracts with a $2000 strike is growing, reflecting investor caution. At the same time, CF Benchmarks noted a rotation out of calls as market participants reduced expectations of a breakout.
The US Department of Justice has allegedly initiated an investigation into Argentine President Javier Miley’s role in promoting LIBRA, according to the Argentine publication La Nacion.
Gold: Extension Below $2,900 to Mark Healthy Correction Ahead of Fresh Push Higher
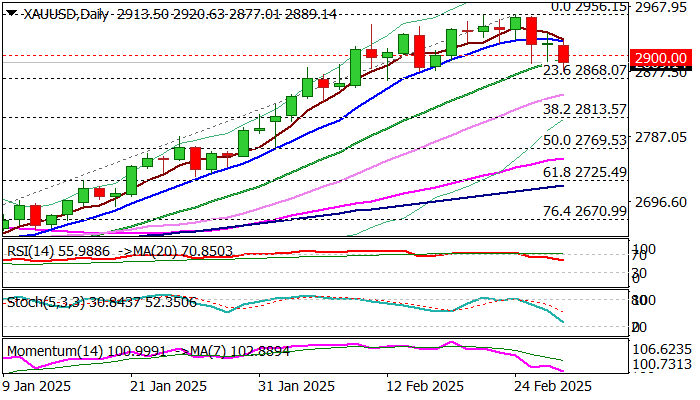
Gold price dips below important support at $2900 where the price action showed hesitation in past two days, but initial negative signal from double downside rejection and long tails of daily candles, is likely to be offset by fresh drop today.
It seems that investors opted for stronger profit-taking after President Trump signaled that tariffs on imports from Canada and Mexico could be postponed for another months, with deeper pullback to provide better buying levels.
The notion is supported by growing uncertainty over tariffs and threats of trade war, while geopolitical situation remains fragile that keeps strong safe haven demand.
Close below $2900 to validate fresh bearish signal and expose supports at $2868 (Fibo 23.6% of $2582/$2959 upleg) and $2845 (30DMA) with dips expected to find ground at $2813/10 zone (Fibo 38.2% / lower 20-d Bollinger band) to mark healthy correction and keep larger bulls in play.
Res: 2900; 2919; 2942; 2956.
Sup: 2868; 2845; 2810; 2769.
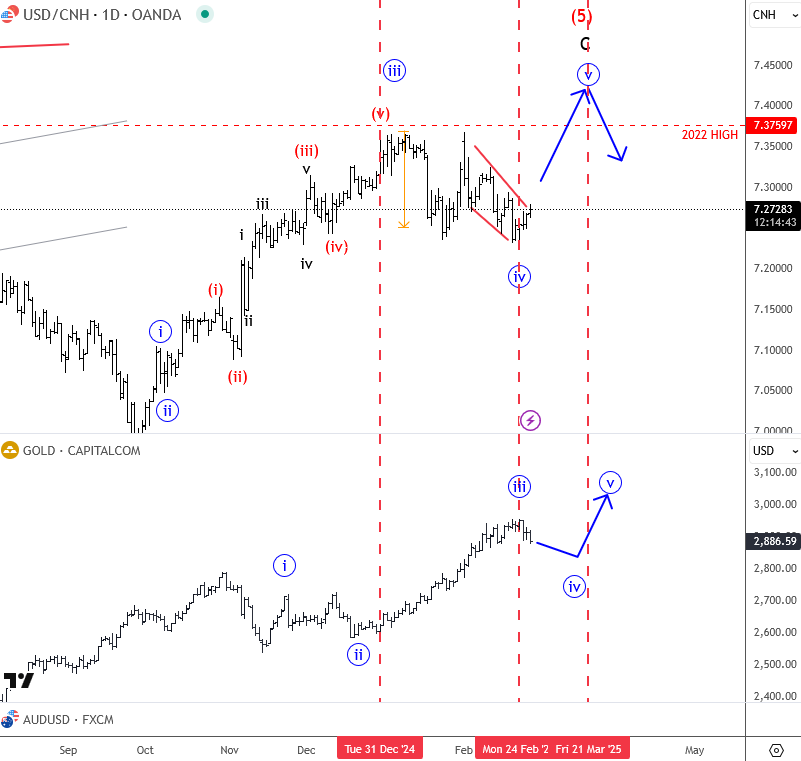
Elliott Waves Shows Gold Turning South for Corrective Retracement
Gold started the year bullish with a strong extended leg to the upside close to 3k, but the move looks impulsive and may have found a temporary top near 2950. The reversal this week is coming from an ending diagonal, with the price now attempting to break the lower trendline support of the bullish channel. This suggests gold could be entering a corrective wave 4, likely unfolding in three waves. For those looking to join the trend, it’s better to wait for a deeper correction and a retest of lower support in this wave four pullback. Supports are at 2864 and 2789
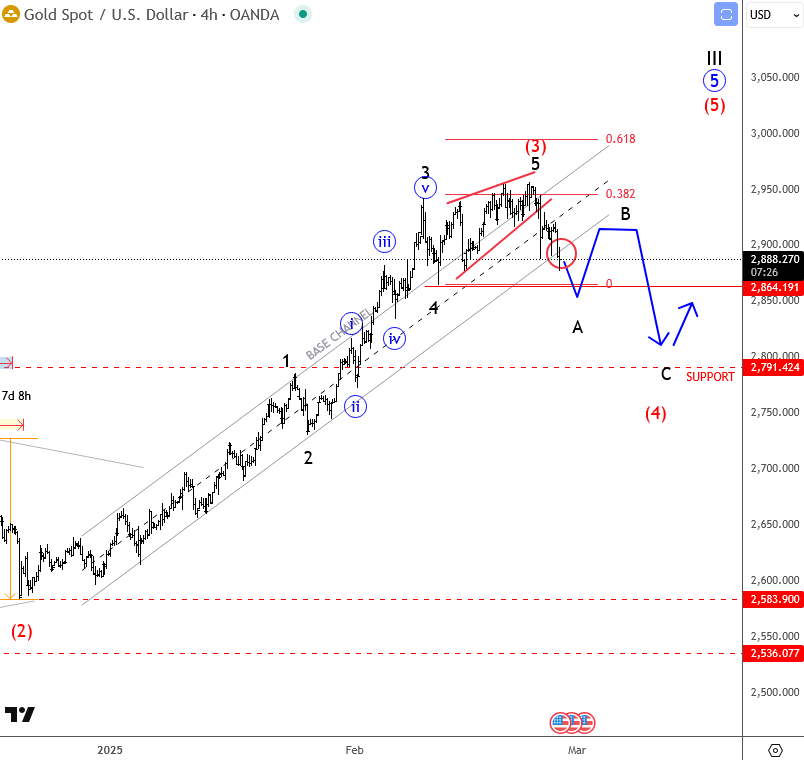
At the same time, keep an eye on USD/CNH—if it pushes higher to retest its 2022 highs, gold could remain sideways for a while. Better opportunities to rejoin the gold uptrend may come after USD/CNH completes its recovery from the 2024 lows, possibly around 7.40.