
Sample Category Title
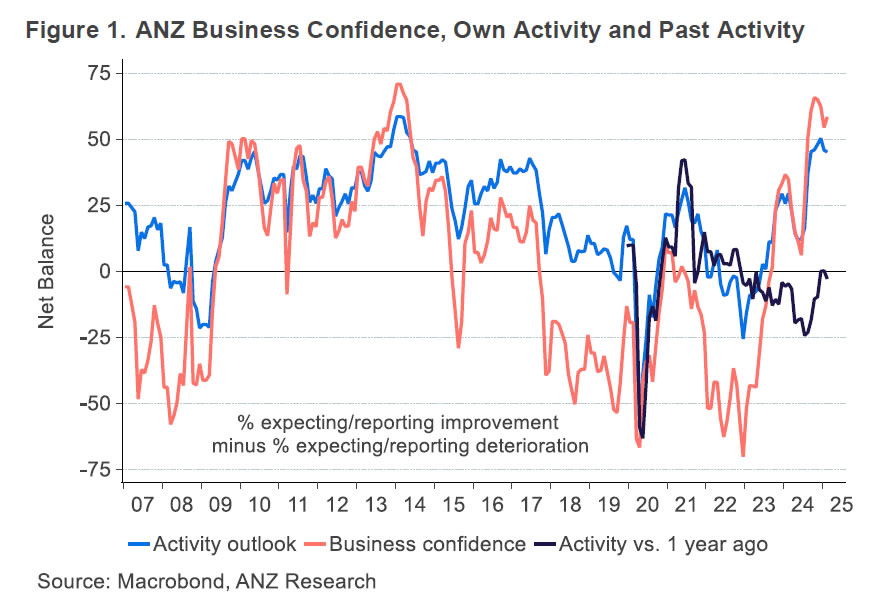
NZ ANZ business confidence rises to 58.4, on the path to recovery
New Zealand’s ANZ Business Confidence rose from 54.4 to 58.4 in February. However, the Own Activity Outlook, slipped slightly from 45.8 to 45.1, highlighting that while sentiment is improving, actual activity remains uncertain.
Pricing and cost indicators painted a mixed picture. Inflation expectations for the next year eased from 2.67% to 2.53% and cost expectations fell from 73.6 to 71.3. But wage expectations remained elevated at 79.2 despite fall from 83.1, and pricing intentions ticked up from 45.7 to 46.2.
ANZ noted that the economy is on the "path to recovery," supported by lower interest rates and stronger-than-expected commodity export prices. However, the bank cautioned that the next phase of growth remains "a point of debate."
The pace of expansion will depend on how households perceive current interest rates, the extent to which global uncertainty influences business investment, and whether firms push forward despite challenges. Additionally, potential labor shortages could emerge as a key constraint on further growth.
BoE’s Dhingra: Orderly trade fragmentation unlikely to require monetary policy response
BoE MPC member Swati Dhingra suggested that the inflationary impact of rising global tariffs could be tempered by weaker economic growth.
She added that if the global economy undergoes a "fragmentation in an orderly way," monetary policy might not need to react immediately as prices readjust to new geopolitical shifts.
However, she cautioned that in an "extreme scenario" where multiple major economies erect significant trade barriers similar to those proposed by the US, "severe strain on a few sources of supply" could lead to sharp price spikes, reminiscent of those seen following Russia's 2022 invasion of Ukraine.
Despite the risks, Dhingra downplayed the likelihood of a severe disruption, noting that "the world economy seems to be moving closer to an orderly fragmentation."
First Impressions: NZ Business Confidence, February 2025
Business confidence remains high, with only minor changes compared to last month.
Key results, February 2025
- Business confidence: 58.4 (Prev: 54.4)
- Expectations for own trading activity: 45.1 (Prev: 45.8)
- Activity vs same month one year ago: -2.9 (Prev: 0.2)
- Inflation expectations: 2.53% (Prev: 2.67%)
- Pricing intentions: 46.2 (Prev: 45.7)
The February ANZ business outlook survey had something for everyone, with rises and falls across a range of indicators. All of the movements were relatively small, though – the general message remains that current conditions are tough but firms are hopeful about the year ahead.
General sentiment about the economy rose from 54.4 to 58.4. This measure had drifted lower in the previous three months, though it has remained at around its highest levels in more than a decade. Firms’ expectations about their own performance dipped slightly for the month, but also remain historically high. Hiring and investment expectations were up for the month.
In terms of their current performance, a net 3% of firms said that they were down on the same time a year ago. However, there are marked differences across industries. The most negative responses were from retailing (pulling back after a more upbeat Christmas / New Year period) and construction. In contrast, the agricultural sector is faring much better than a year ago, no doubt buoyed by rising export prices and an easing in input cost inflation.
The pricing gauges of the survey were mixed. Expected inflation for the year ahead fell to 2.5%, the lowest since June 2021. However, firms’ own pricing intentions continued to tick higher. Expectations for cost increases were down slightly in February, but this measure has been running higher in the last few months.
Overall, businesses remain hopeful that lower interest rates will help to revive the economy in the year ahead. We generally share that view, though we’re forecasting a return to moderate rather than above-trend growth over 2025.
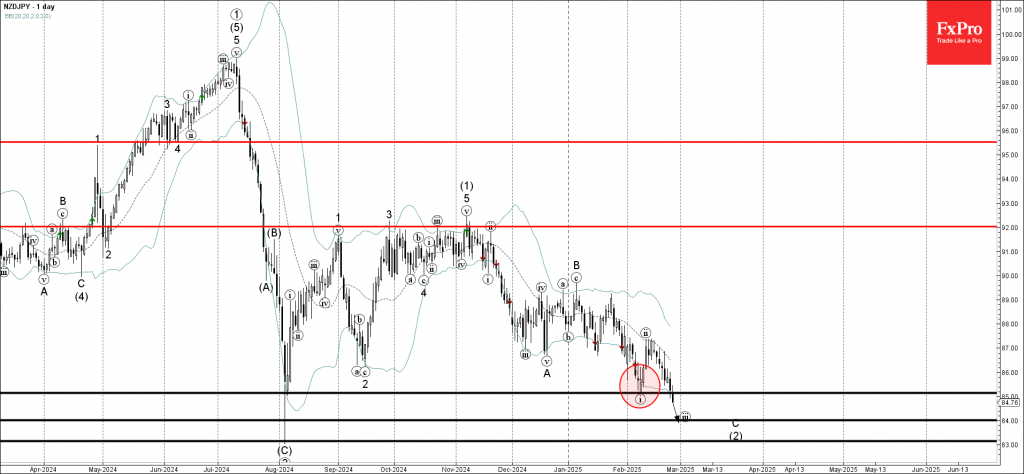
NZDJPY Wave Analysis
- NZDJPY broke key support level 85.00
- Likely to fall support level 84.00
NZDJPY currency pair recently broke the key support level 85.00 (which stopped the previous minor impulse wave i at the start of February).
The breakout of the support level 85.00 accelerated the minor impulse wave iii of the C-wave which belongs to the extended ABC correction (2) from November.
Given the strong daily downtrend, NZDJPY currency pair can be expected to extend the losses toward the next support level 84.00, the target price for the completion of the active C-wave.
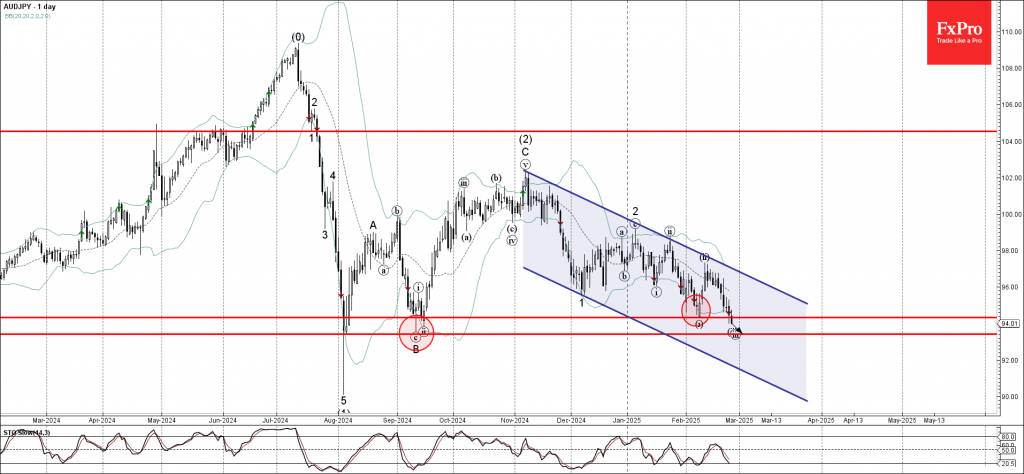
AUDJPY Wave Analysis
- AUDJPY broke support level 94.35
- Likely to fall support level 93.45
AUDJPY currency pair recently broke the support level 94.35 (the low of the previous minor impulse wave i from the start of February).
The breakout of the support level 94.35 accelerated the active short-term impulse wave iii, which belongs to the longer-term impulse waves 3 and (3).
Given the predominantly bullish yen sentiment seen today, AUDJPY currency pair be expected to fall to the next support level 93.45, the former monthly low from September.
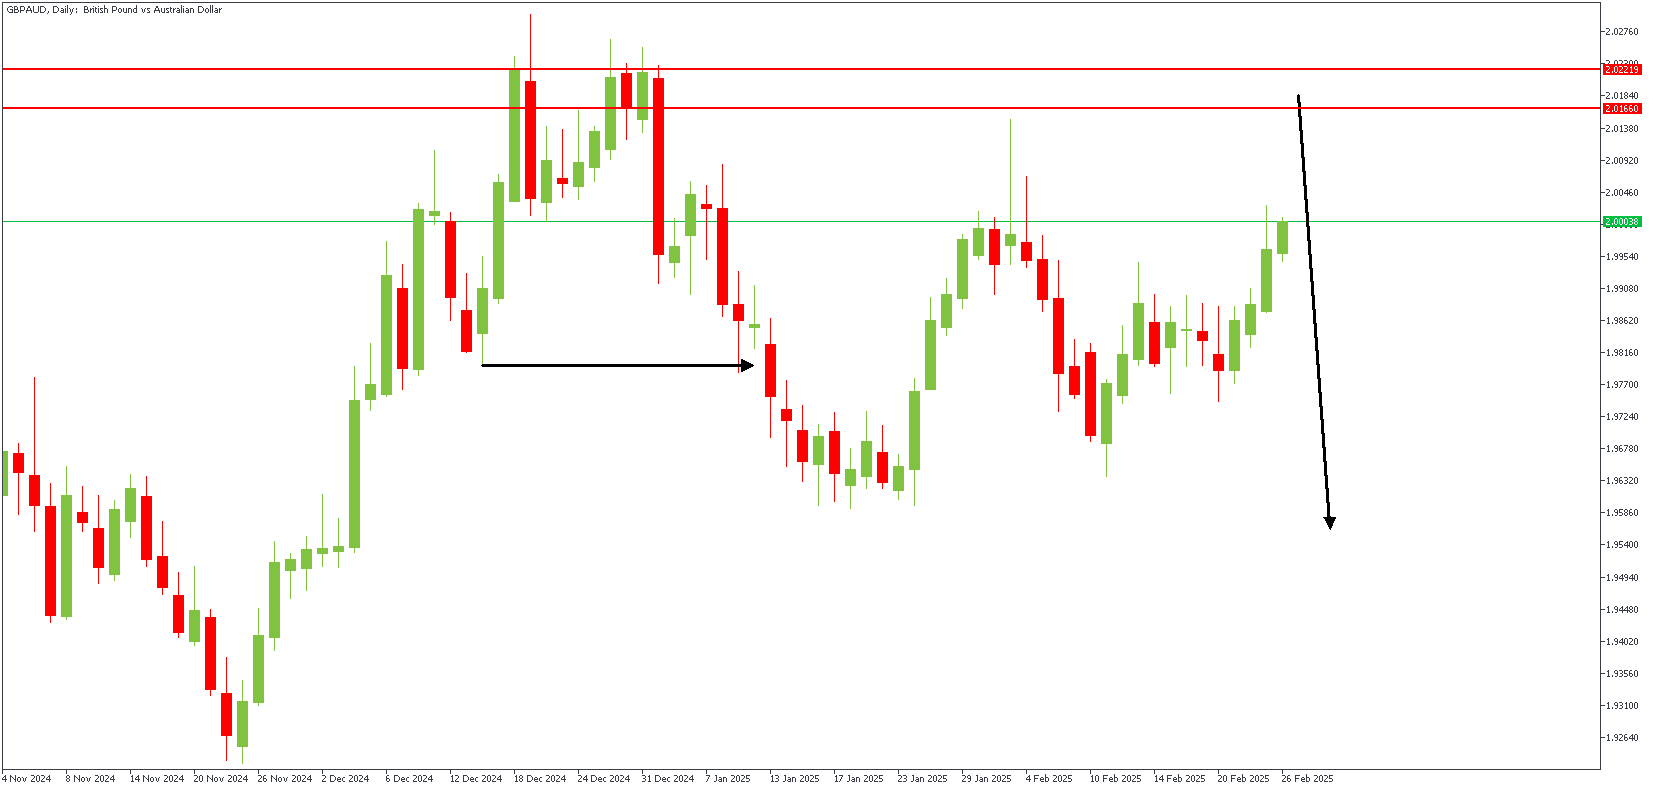
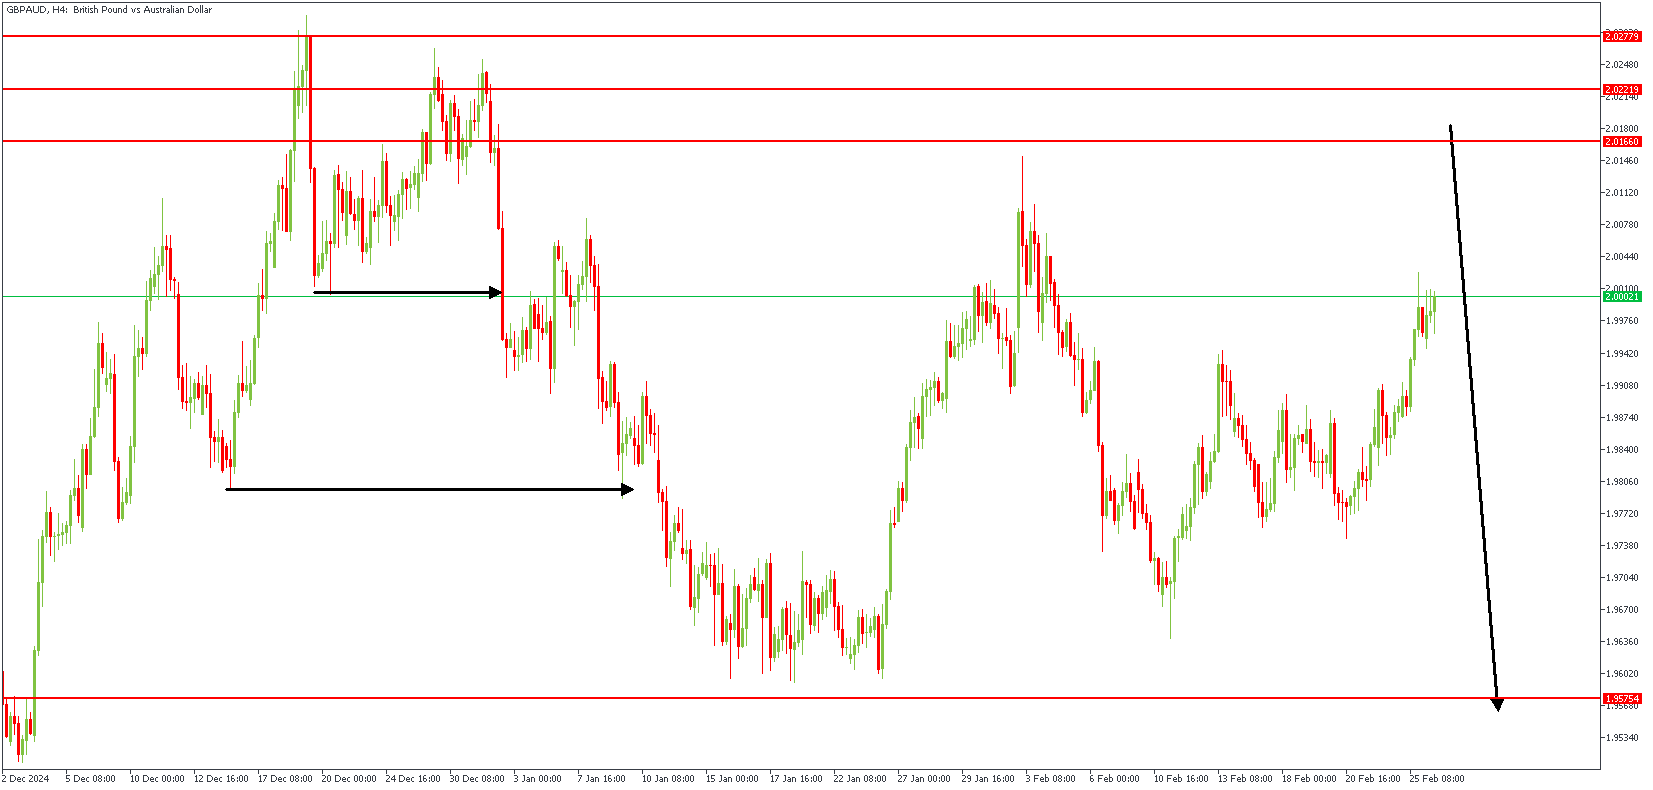
GBPAUD Technical Analysis
The Pound Sterling (GBP) strengthens against most currencies but edges lower against the US Dollar (USD), trading near 1.2660. Bank of England's Dhingra predicts more than four interest rate cuts this year, adding to market uncertainty. The USD rebounds as US Treasury yields rise, with 10-year yields recovering to 4.33% after hitting a two-month low of 4.28%. The US Dollar Index (DXY) also bounces back after touching an 11-week low of 106.10 earlier in the day. Investors are now looking ahead to the US PCE inflation data for January, which is set for release on Friday. The US administration's approval of a $4.5 trillion tax cut plan further supports the USD.
GBPAUD – D1 Timeframe
The previous bearish swing's failure to break below the last low on the daily timeframe chart of GBPAUD renders the recent high a liquidity sweet spot. As a result, the price is expected to raid this liquidity area before reacting to the supply region. The overall sentiment here is bearish.
GBPAUD – H4 Timeframe
The price action on the 4-hour timeframe chart of GBPAUD reveals that the highlighted supply area overlaps the daily timeframe pivot zone, with an FVG just before the supply zone. The double bearish break of structure to the left of the chart further affirms the higher timeframe bearish sentiment.
Analyst's Expectations:
- Direction: Bearish
- Target- 1.96650
- Invalidation- 2.03084
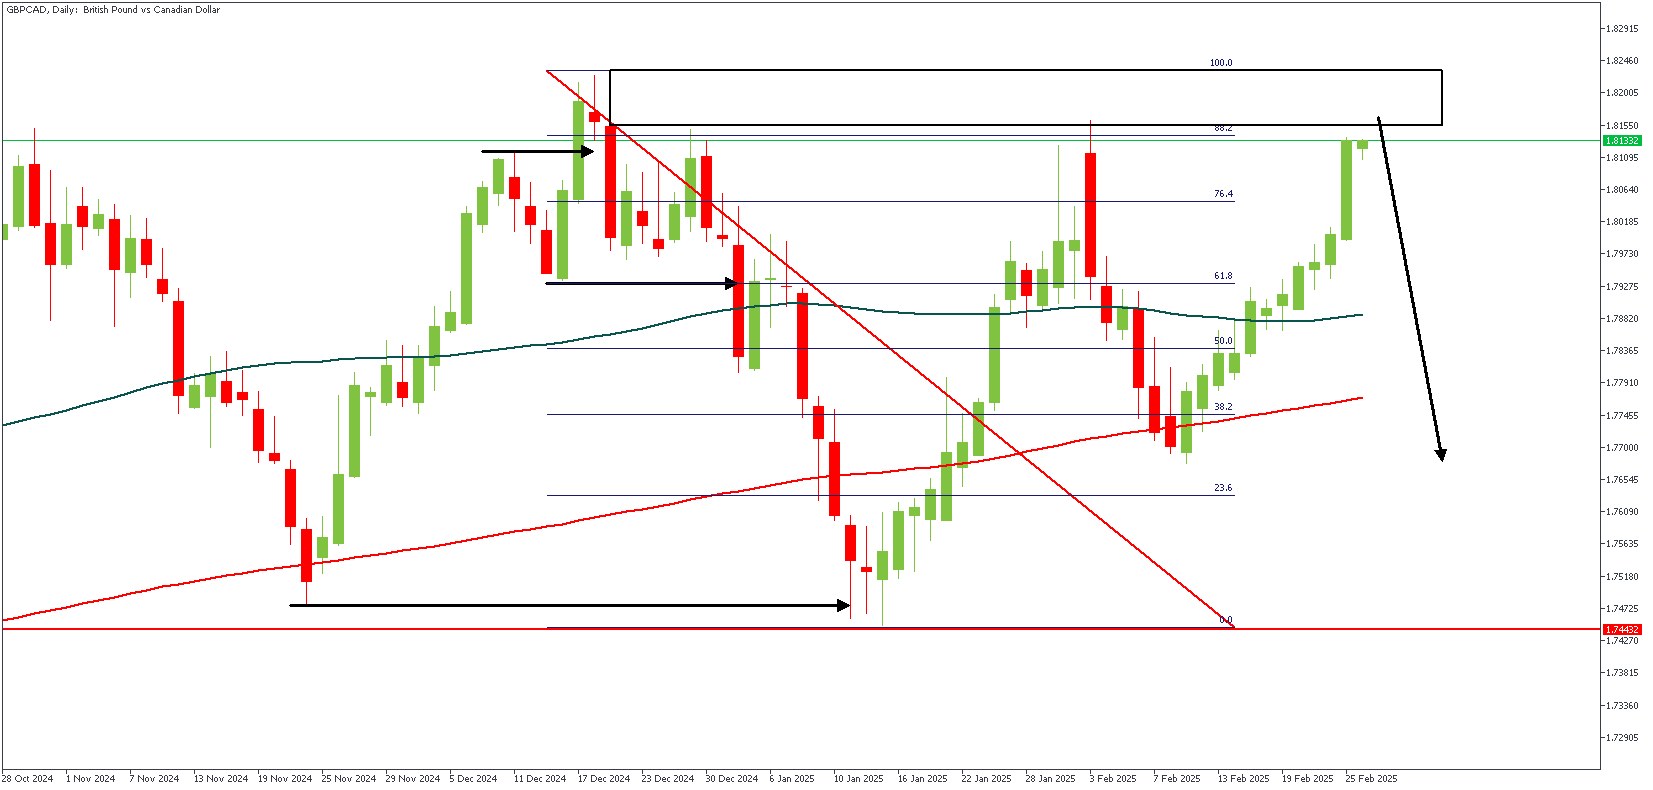
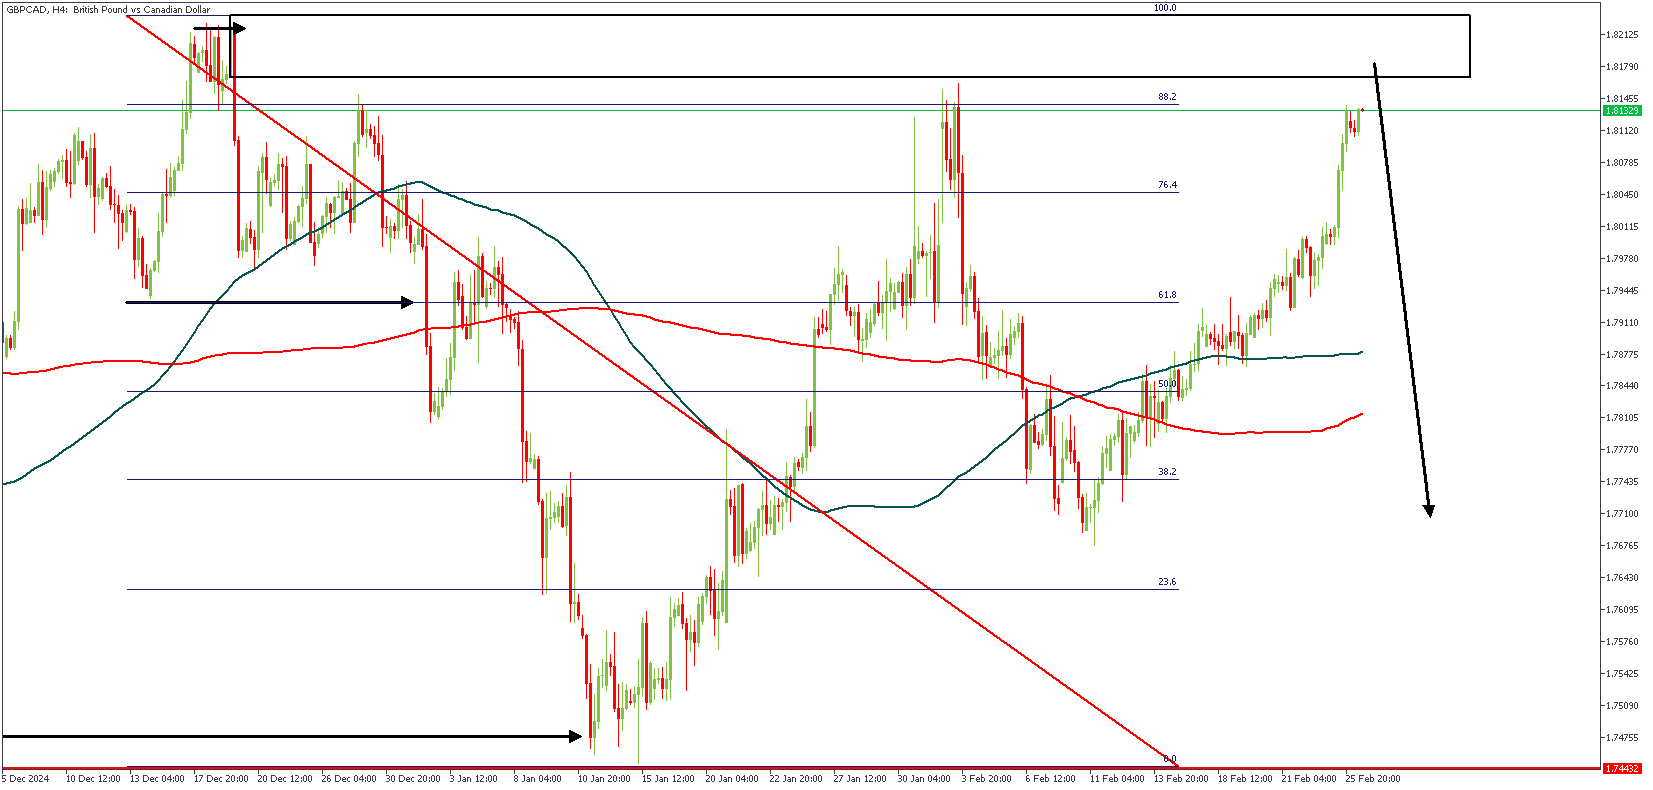
GBPCAD Technical Analysis
The US Dollar (USD) continues its upward trend, with USDCAD reaching around 1.4330 as US Treasury yields rise. The US Dollar Index (DXY) is nearing 106.50, boosted by higher Treasury yields of 4.13% for 2-year bonds and 4.33% for 10-year bonds. Federal Reserve official Thomas Barkin predicted a drop in inflation but emphasized a cautious approach due to ongoing uncertainties. The Canadian Dollar (CAD) is under pressure due to US President Trump's confirmation of tariffs on Canadian and Mexican imports. Falling crude oil prices also weigh on the CAD, as Canada is a major oil exporter to the US. Oil prices are falling due to concerns over the US economy and market uncertainty, further impacting the CAD.
GBPCAD – D1 Timeframe
As sketchy as the price action on the daily timeframe chart of GBPCAD looks, a closer look at the trading range reveals that the price swept liquidity from the previous high before breaking structure downwards, creating a classic SBR pattern. In addition, the supply region at the peak of the SBR pattern overlaps the 88% region of the Fibonacci retracement tool, increasing the chance of a bearish reaction from the highlighted supply zone.
GBPCAD – H4 Timeframe
The significant detail from the 4-hour timeframe chart of GBPCAD's price action is the presence of liquidity at the tip of the recent high. The sentiment remains bearish unless the price successfully breaks above the supply zone.
Analyst's Expectations:
- Direction: Bearish
- Target- 1.76802
- Invalidation- 1.82598
Fear in Stocks Hasn’t Crossed the Line Yet
Extreme fear is driving US stock indexes, according to a popular CNN Business index. Their index has fallen to 22, repeating December’s lows. Only in early August last year did the indicator dip below 22 for a few days. An area of extreme fear is often seen as an attractive time to buy. However, the dynamics of the past year are forcing some adjustments to this rule. In both August and December, the lows of the Fear and Greed Index were well ahead of the market lows and would have forced rash investors to endure several anxious sessions, even if they were able to buy at the peak of fear effectively.
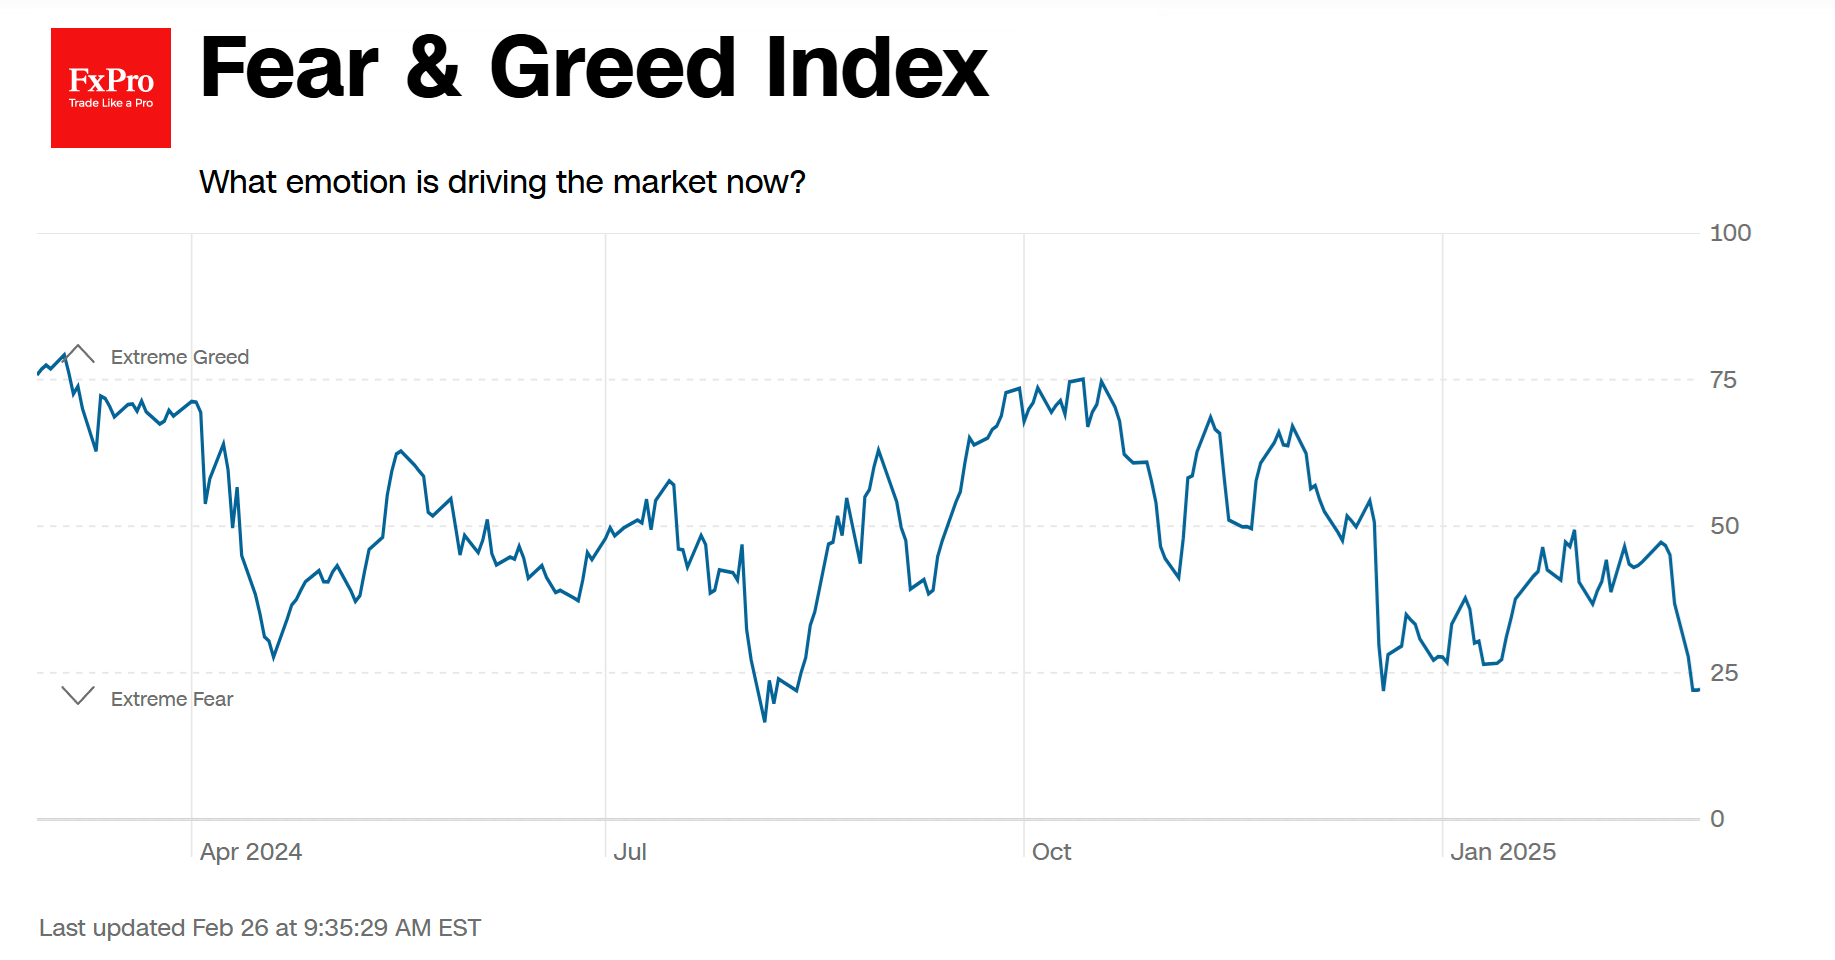
It was much more rational to stay on the sidelines and join the rally only after the sentiment index had risen sharply out of fear territory.
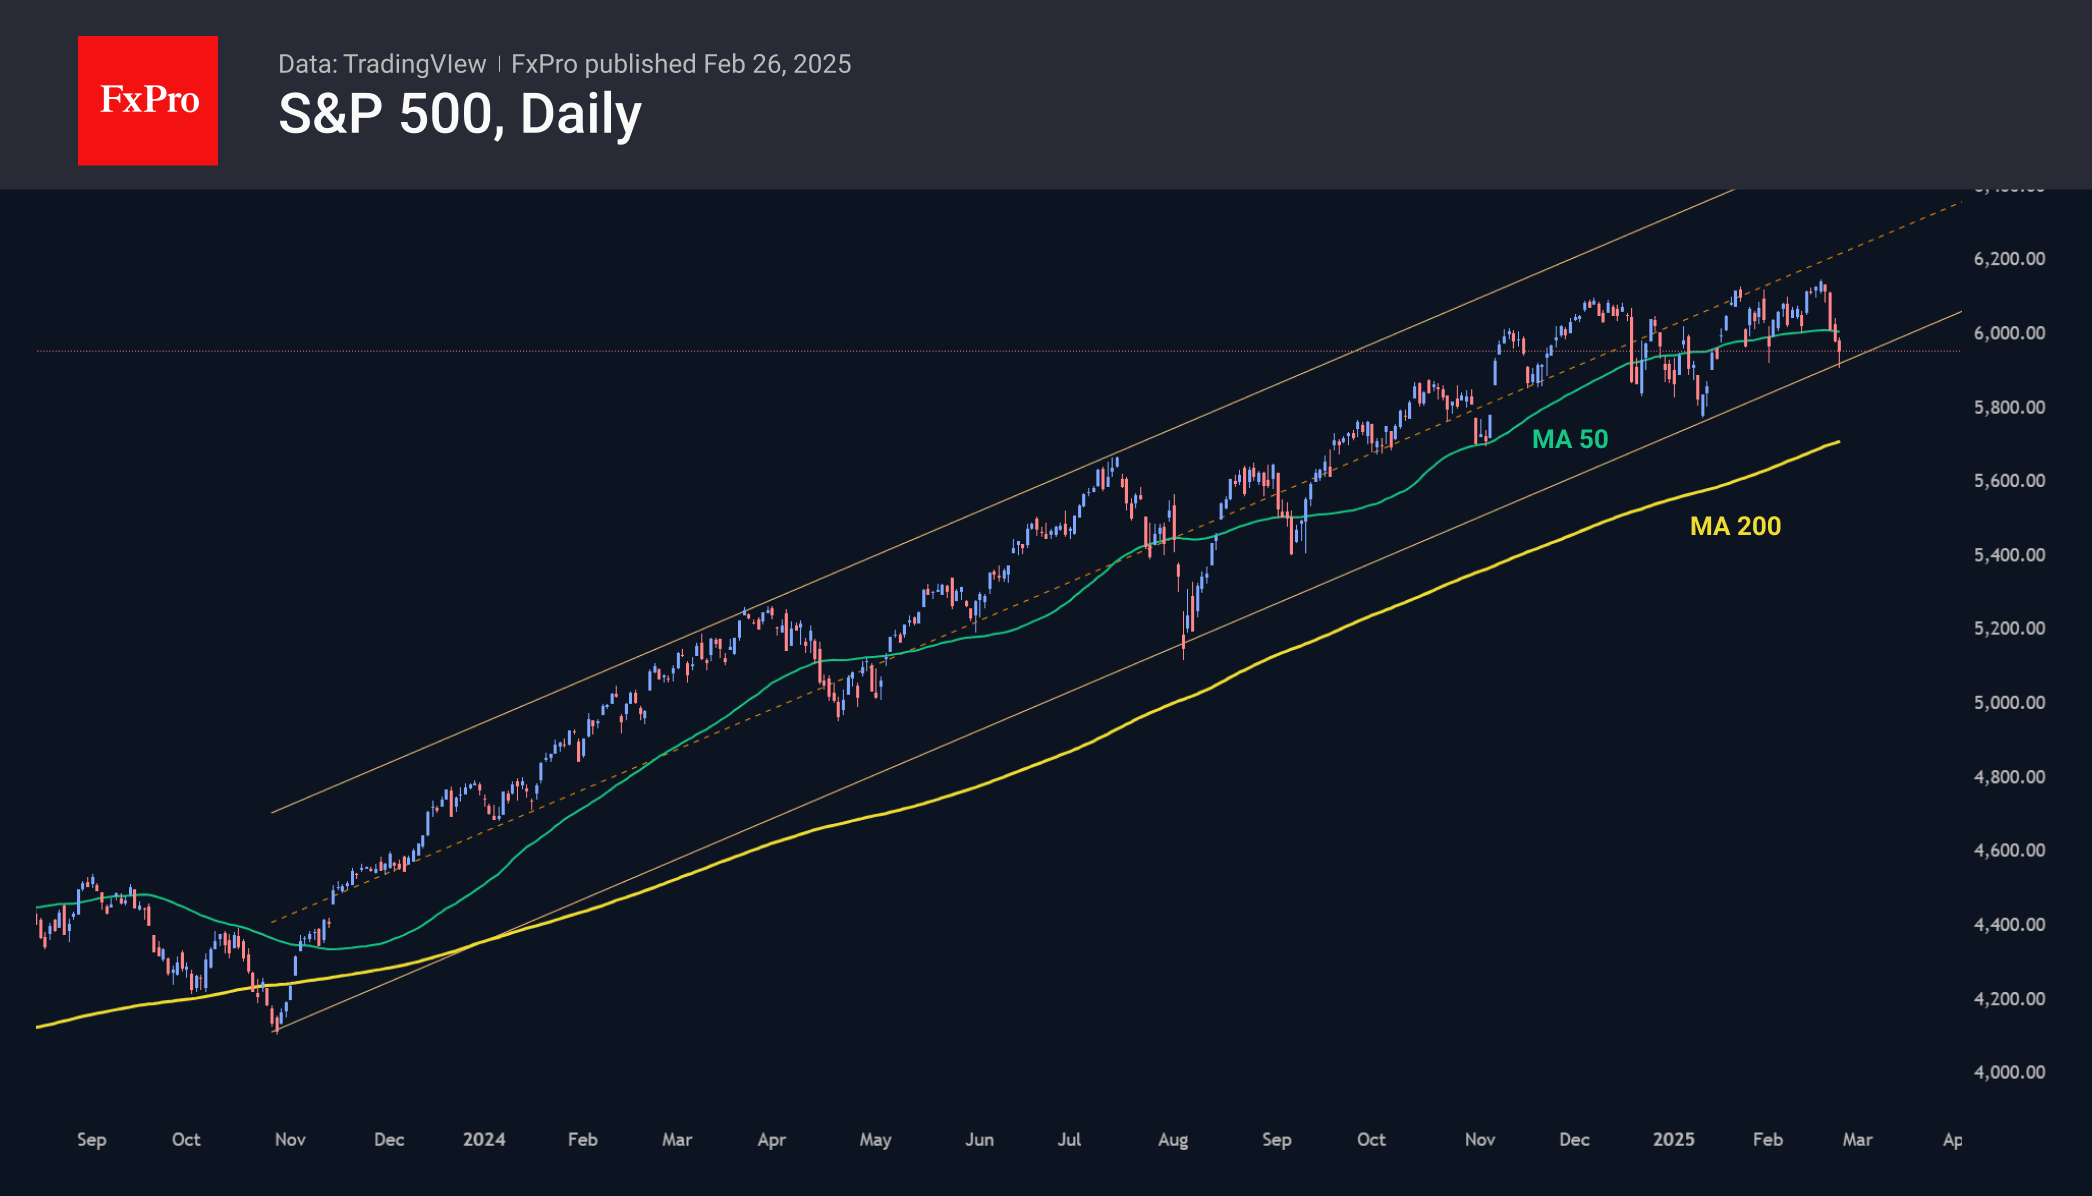
Let’s look at the individual indices. The S&P500 was back below 6000 at the start of the week and below its 50-day moving average. Since the second half of January, it had been heavily bought on touching this curve, but the buying strength was clearly not enough to push it further into historical highs. At Tuesday’s low, the S&P500 was close to the lower boundary of the ascending channel that has been in place since late 2023. A break below 5900 could trigger a broader sell-off in equities well beyond the US. An even more dramatic scenario could be triggered by a break below the 200-day moving average (now at 5750).
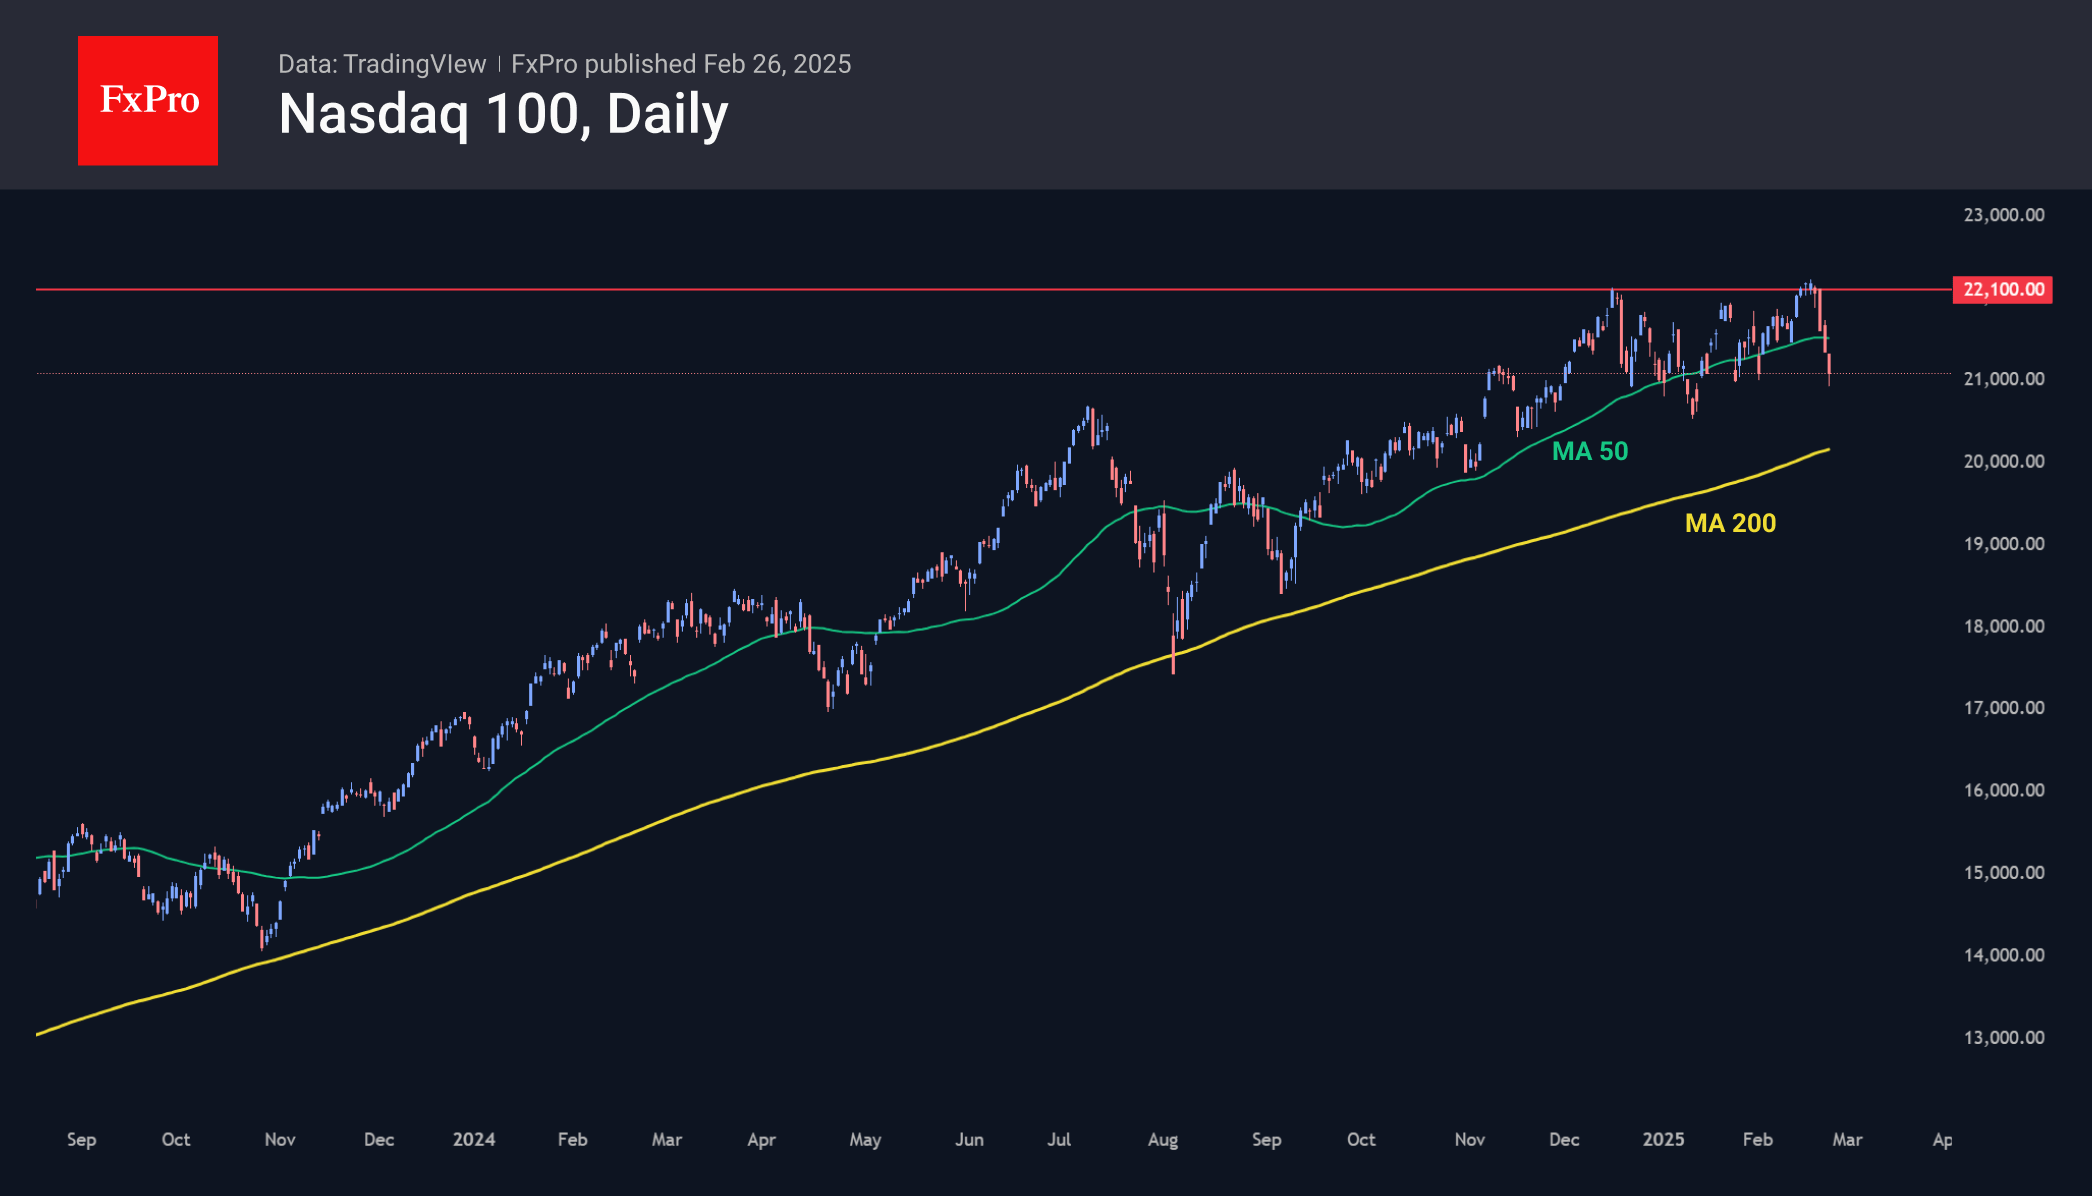
Indirect warning signals include the double tops on the Nasdaq100 and Dow Jones indices, which is a trend reversal pattern. It is important to note that the tops on the indices were formed at different times, which reduces their correlation and thus increases their significance.
At the same time, the basic scenario in such cases is still a rebound from the lower boundary and a move towards the upper boundary, which is now above 6600. The bulls are temporarily favoured by the relatively subdued dynamics of the VIX. This volatility index remains below 20, the level above which is often the first signal that the market is going into selling mode.

Sunset Market Commentary
Markets
The three-day rally in US Treasuries came to a halt today. An empty eco calendar played a part in that following three days of stagflationary worries (PMI’s, Michigan consumer confidence, Conference Board consumer confidence). More importantly, the US House passed a budget resolution that could pave the way for huge spending and especially tax cuts. The resolution is now headed to Senate where it will likely be amended as Senators target even more than the $4.5tn of lower taxes. Once the House and Senate are on the same line, legislation can pass via simple majority reconciliation process. US treasury yields are close to unchanged suggesting it’s way too soon to call the correction already over. Q4 Nvidia earnings after US close tonight could already be an important test for general sentiment. European trading lacked guidance from the eco calendar as well. Solid corporate earnings and the mineral-rights deal between the US and Ukraine (to be signed in Washington on Friday) pushed European stock markets up to 1% higher. Changes on bond markets were minimal with EUR/USD camping just below the 1.0533 resistance (YTD top).
The Flemish Community launched its first syndicated benchmark deal of the year. They issued a long 12y bond (Jun2037) which was priced 20 bps over the Belgian OLO curve. That’s 5 bps tighter than guidance in the OLO +25 bps area. Books were above €4.4bn allowing Flanders to print €1.5bn. Flanders Department of Finance estimates new funding needs for 2025 at roughly €11bn, the lion share of which is to cover new funding needs (€7.1bn). The funding need mainly stems from an estimated budget deficit of €3.4bn and other (recurring) funding needs such as the Flemish Social Housing Company (VMSW €0.8bn), the Flemish Housing Fund (VWF €1.41bn) and costs related to the Oosterweel link (LANTIS €0.8bn). Debt redemptions for 2025 are projected at €3.9bn. For its 2025 financing mix, Flanders hopes to raise €3.25-3.75bn via regular benchmarks, €1.25-1.50bn via sustainability (green) benchmarks, €0.75-1bn via private placements and €0.4bn through EIB loans.
News & Views
The Institute of International Finance (IIF) in its Global Debt Monitor reported the world’s debt stock rose to a new annual record high of $318tn in 2024. The debt-to-GDP ratio neared 328% in 2024, in what was the first (1.5 ppt) uptick since 2020 amid slowing economic growth. While the $7tn increase of last year was less than half of 2023’s, the IIF still warned persistent rising fiscal deficits are attracting growing market scrutiny. The governments’ share in the global stock of debt amounted to $95tn. The IIF forecasts a further $5tn rise this year though warned this could be even more due to calls for fiscal stimulus and defense spending in Europe. On a geographical level, emerging markets – driven by China, India, Saudi Arabia and Tukey – accounted for roughly two-thirds of 2024’s global debt growth.
Chief of staff to Hungary’s PM Orban Gulyas in an interview with news site 24.hu said GDP growth this year will likely be lower than the official government growth target of 3.4%. Economic growth of 2%-3% seemed more realistic, he said. As the 3.4% estimate still forms the basis of the 2025 budget approved end last year, it means the 3.7% deficit penciled in already appears outdated. That’s especially the case with the Orban administration trying to (fiscally) revive the economy ahead of next year’s parliamentary elections. Orban’s Fidesz party is trailing the Tisza Party since the end of 2024. The Tisza Party gained rapidly in popularity after former Fidesz member Peter Magyar resigned out of discontent with government functioning and took the lead of Tisza in early 2024.