Sample Category Title
EUR/USD Mid-Day Outlook
Daily Pivots: (S1) 1.0474; (P) 1.0497; (R1) 1.0537; More...
Intraday bias in EUR/USD stays neutral at this point. Price actions from 1.0176 are seen as a corrective pattern only. Strong resistance is expected from 38.2% retracement of 1.1213 to 1.0176 at 1.0572 to limit upside. On the downside, break of 1.0400 support will turn bias back to the downside for 1.0176/0210 support zone. However, decisive break of 1.0572 will raise the chance of reversal, and target 61.8% retracement at 1.0817.

In the bigger picture, immediate focus is on 61.8 retracement of 0.9534 (2022 low) to 1.1274 (2024 high) at 1.0199. Sustained break there will solidify the case of medium term bearish trend reversal, and pave the way back to 0.9534. However, reversal from 1.0199 will argue that price actions from 1.1274 are merely a corrective pattern, and has already completed.

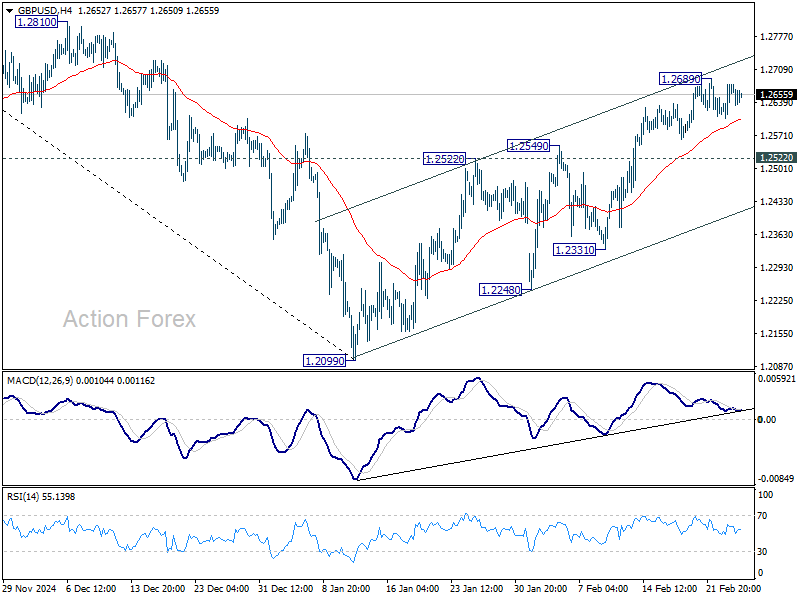
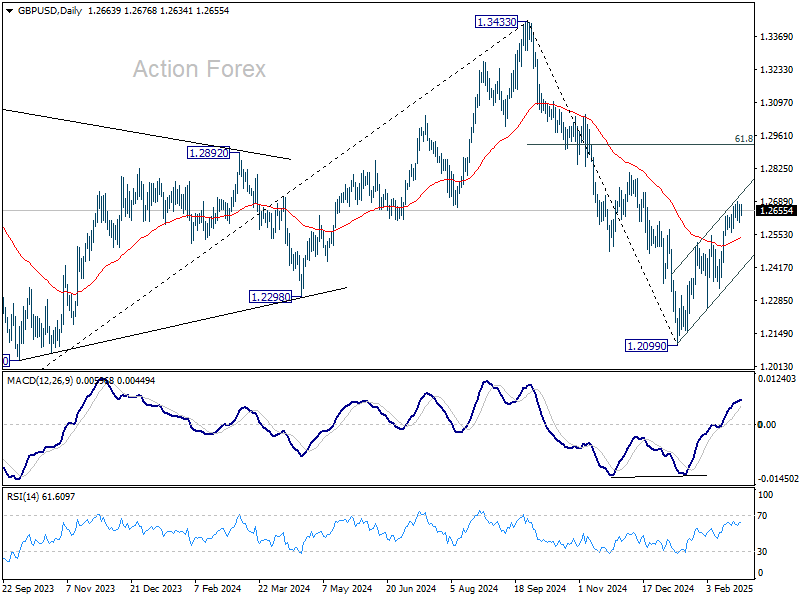
GBP/USD Mid-Day Outlook
Daily Pivots: (S1) 1.2623; (P) 1.2650; (R1) 1.2695; More...
Intraday bias in GBP/USD remains neutral for consolidation below 1.2689. Further rally is in favor as long as 1.2522 resistance turned support holds. Above 1.2689 will resume the rise from 1.2099 to 1.2810 resistance next. However, firm break below 1.2522 will argue that the rebound might have completed, and bring deeper fall to 1.2331 support.
In the bigger picture, rise from 1.0351 (2022 low) should have already completed at 1.3433 (2024 high), and the trend has reversed. Further fall is now expected as long as 1.2810 resistance holds. Deeper decline should be seen to 61.8% retracement of 1.0351 to 1.3433 at 1.1528, even as a corrective move. However, firm break of 1.2810 will dampen this bearish view and bring retest of 1.3433 high instead.
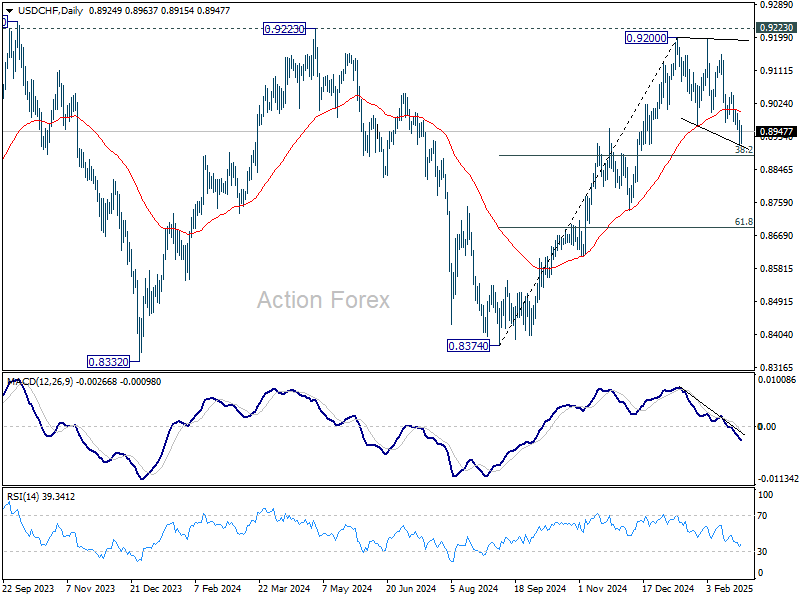
USD/CHF Mid-Day Outlook
Daily Pivots: (S1) 0.8900; (P) 0.8941; (R1) 0.8971; More…
Outlook in USD/CHF is unchanged that price actions from 0.9200 are still seen as a corrective pattern only. Strong support should be seen from 38.2% retracement of 0.8374 to 0.9200 at 0.8884 to complete it, and bring larger rise resumption. On the upside, above 0.9053 will bring retest of 0.9200 resistance. However, sustained break of 0.8884 will indicate bearish reversal, and target 61.8% retracement at 0.8690 instead.
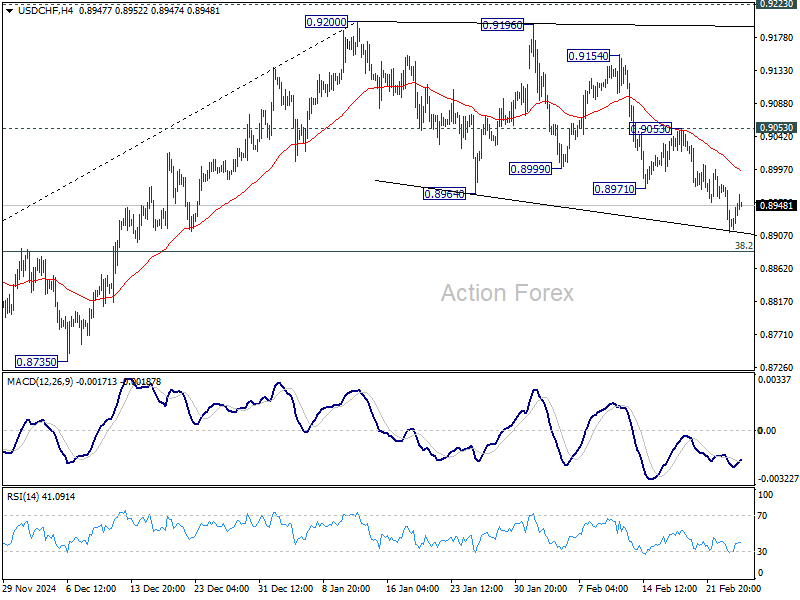
In the bigger picture, decisive break of 0.9223 resistance will argue that whole down trend from 1.0342 (2017 high) has completed with three waves down to 0.8332 (2023 low). Outlook will be turned bullish for 1.0146 resistance next. Nevertheless, rejection by 0.9223 will retain medium term bearishness for another decline through 0.8332 at a later stage.
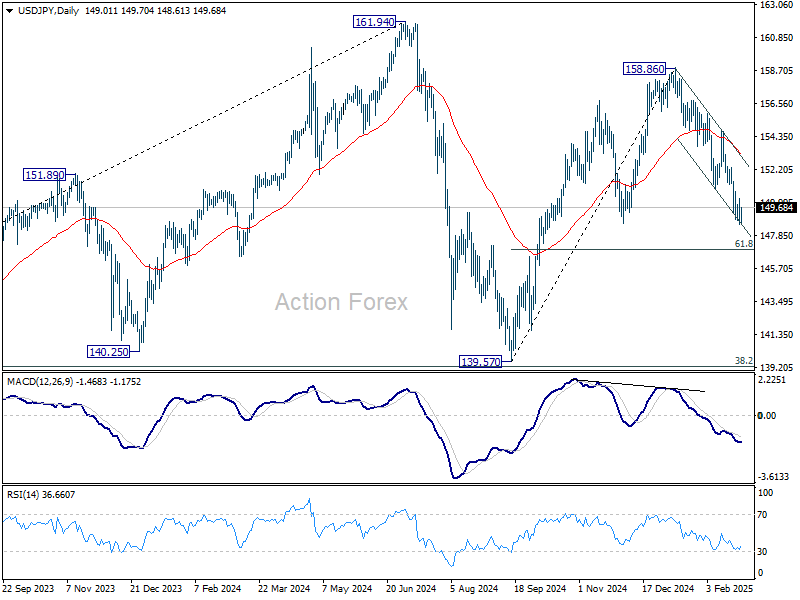
USD/JPY Mid-Day Outlook
Daily Pivots: (S1) 148.30; (P) 149.30; (R1) 150.03; More...
While downside momentum is not too convincing, further decline is expected in USD/JPY as long as 150.92 support turned resistance holds. Current fall from 158.86 is seen as the third leg of the pattern from 161.94 high. Deeper decline should be seen to 61.8% retracement of 139.57 to 158.86 at 146.32 next. On the upside, however, break of 150.92 will indicate short term bottoming and bring stronger rebound.
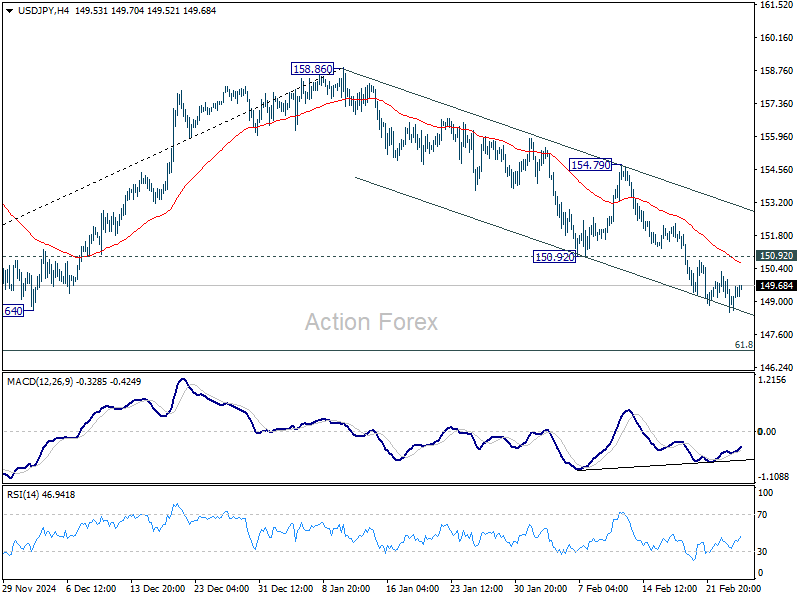
In the bigger picture, price actions from 161.94 are seen as a corrective pattern to rise from 102.58 (2021 low). In case of another fall, strong support should be seen from 38.2% retracement of 102.58 to 161.94 at 139.26 to bring rebound. However, sustained break of 139.26 would open up deeper medium term decline to 61.8% retracement at 125.25.
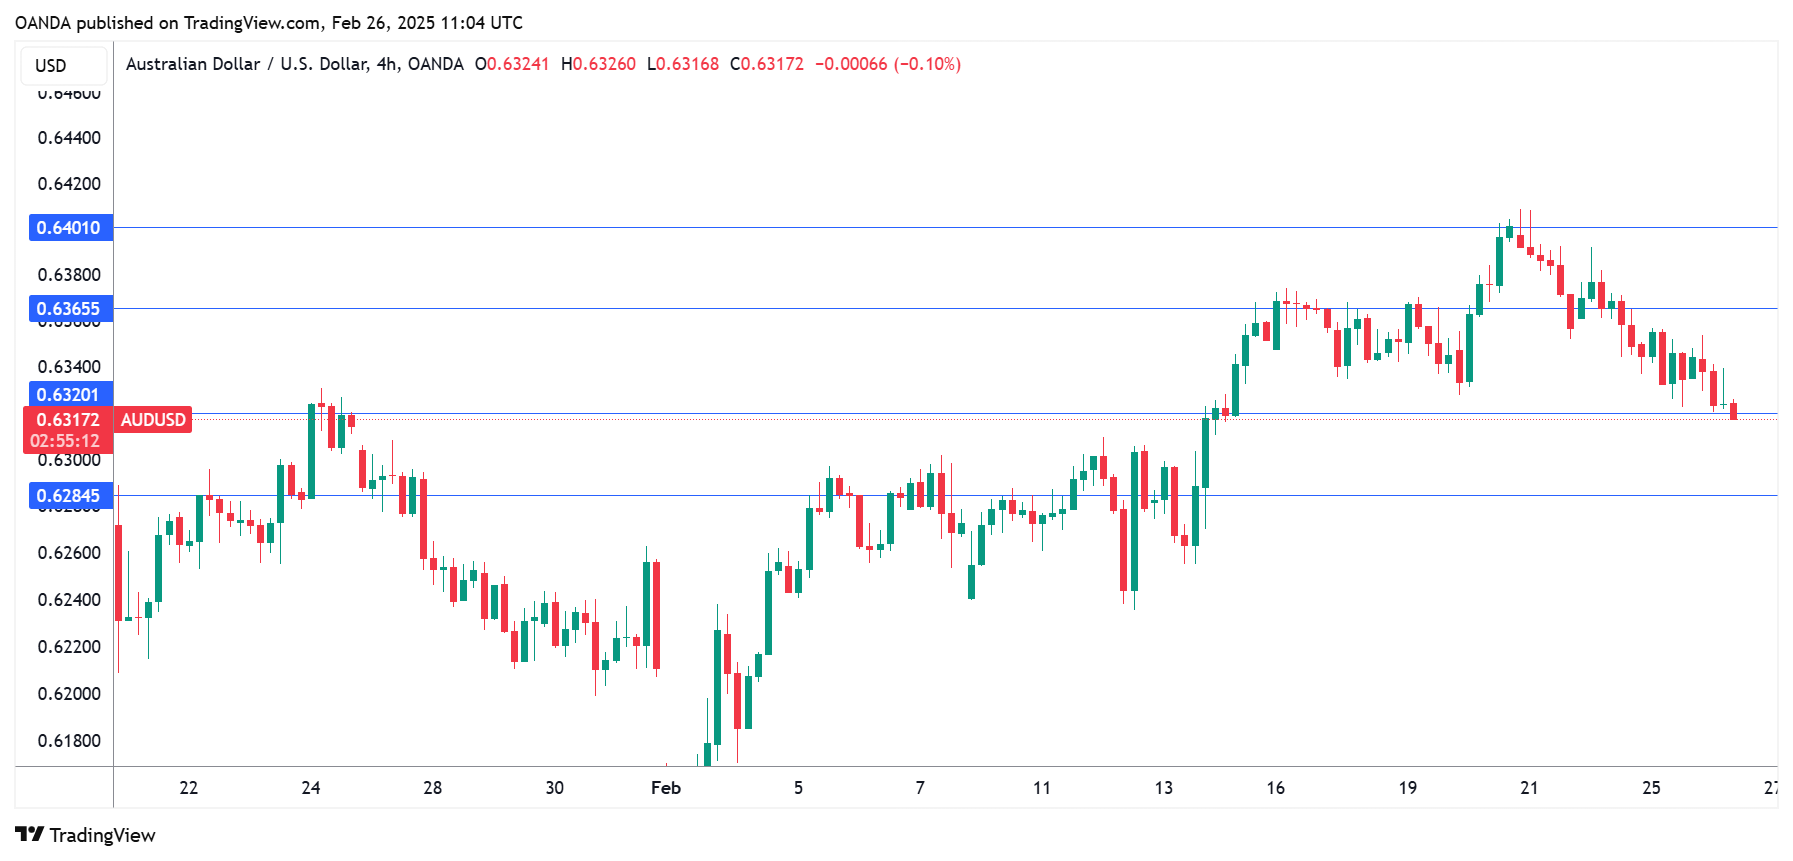
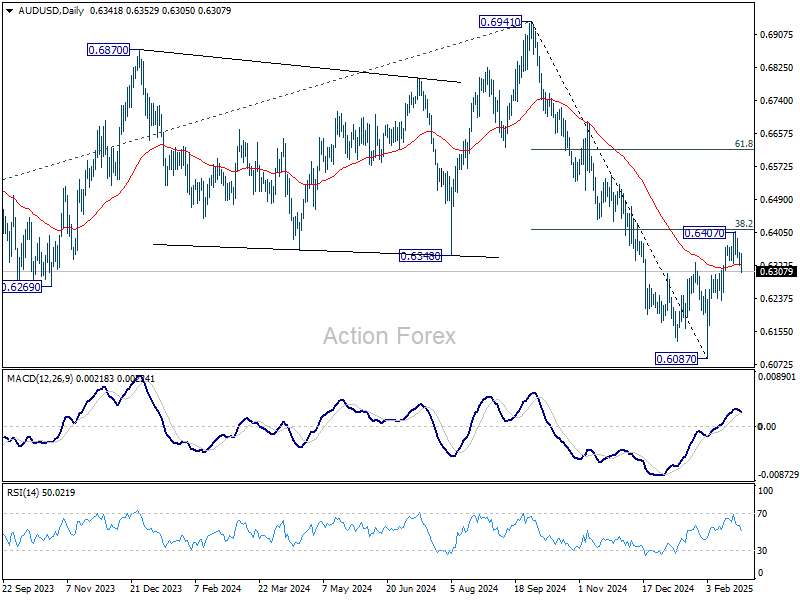
AUD/USD Mid-Day Report
Daily Pivots: (S1) 0.6325; (P) 0.6341; (R1) 0.6360; More...
AUD/USD's break of 0.6327 support should confirm short term topping at 0.6407, on bearish divergence condition in 4H MACD. Corrective rebound should have completed just ahead of 38.2% retracement of 0.6941 to 0.6087 at 0.6413. Intraday bias is back on the downside for retesting 0.6087 low. For now, risk will stay on the downside as long as 0.6407 holds, in case of recovery.
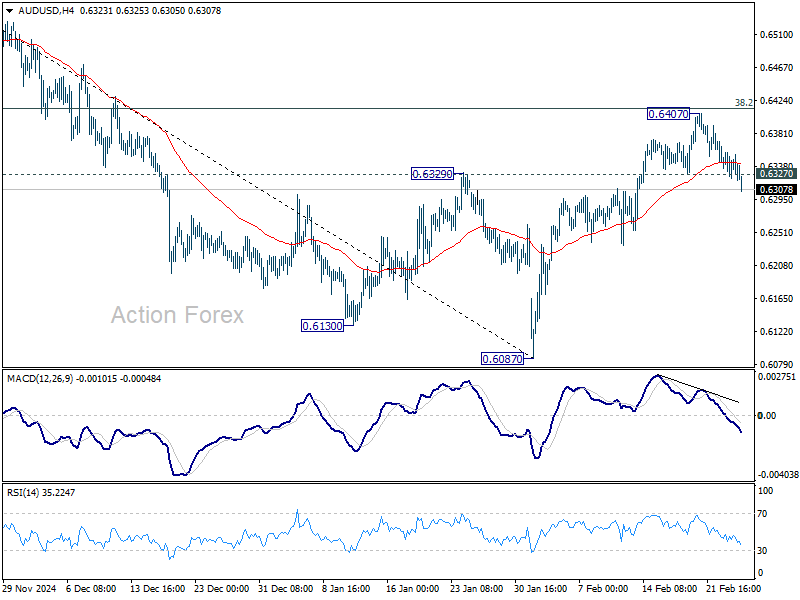
In the bigger picture, fall from 0.6941 (2024 high) is seen as part of the down trend from 0.8006 (2021 high). Next medium term target is 61.8% projection of 0.8006 to 0.6169 from 0.6941 at 0.5806. In any case, outlook will stay bearish as long as 55 W EMA (now at 0.6505) holds.
Dollar Gathers Momentum, Gold Cools Off, Market Jitters Ahead?
Dollar appears to be gathering steam for a stronger, sustainable near-term rebound, although the precise catalyst remains unclear. One contributing factor an undercurrent of risk aversion, which is reflected in the broad selloff in the Australian and New Zealand Dollars. Yet, the overall market picture is mixed, as US stock futures inch higher and Treasury yields hold steady, hardly signaling a deep risk-off move or robust safe-haven flows.
Another explanation points to traders positioning ahead of Nvidia’s earnings release, due after the bell. With the AI-driven rally serving as a key theme for tech stocks, any surprise in the results could influence wider market sentiment, thereby affecting the currency markets. Additionally, speculation is building around the upcoming March 4 tariff deadline, when US levies on Canada and Mexico—postponed for a month to address border and fentanyl issues—are set to take effect.
At present, the greenback tops the leaderboard for the day, followed by Sterling and Loonie. Aussie and Kiwi lag, with Swiss Franc also underperforming. Euro and Yen are holding middle ground.
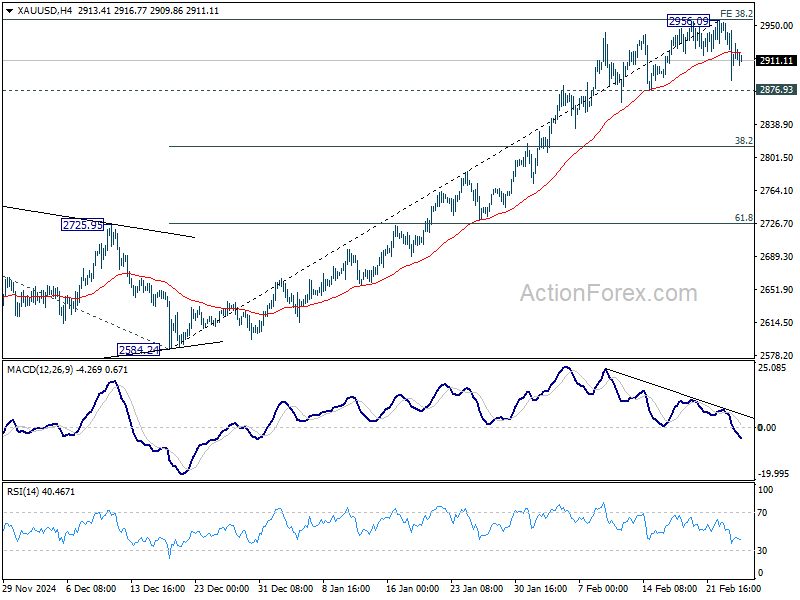
Technically, considering bearish divergence condition in 4H MACD, a short term top could already be in place in Gold at 2956.09, ahead of 3000 psychological level. Firm break of 2876.93 support should confirm this case, and bring deeper correction to 38.2% retracement of 2584.24 to 2956.09 at 2814.04. If realized, that would be a confirmation for Dollar's rebound.
In Europe, at the time of writing, FTSE is up 0.65%. DAX is up 1.69%. CAC is up 1.32%. UK 10-year yield is down -0.0316 at 4.483. Germany 10-year yield is down -0.032 at 2.429. Earlier in Asia, Nikkei fell -0.25%. Hong Kong HSI rose 3.27%. China Shanghai SSE rose 1.02%. Singapore Strait Times fell -0.20%. Japan 10-year JGB yield fell -0.0098 to 1.367.
German Gfk consumer sentiment drops to -24.7, no sign of recovery yet
Germany's GfK Consumer Sentiment Index for March declined further from -22.6 to -24.7, missing expectations of -21.1.
February data showed income expectations plunging -4.3 points to -5.4, marking a 13-month low, while the economic outlook for the next 12 months improved slightly by 2.8 points to 1.2.
According to Rolf Bürkl, consumer expert at NIM, the data highlights that "no signs of a recovery" are visible in German consumer sentiment. He noted that headline index has been stuck at a low level since mid-2024, with "great deal of uncertainty among consumers and a lack of planning security".
Australia’s monthly CPI holds at 2.5%, core measures edge higher
Australia’s monthly CPI was unchanged at 2.5% yoy in January, falling short of expectations for a slight uptick to 2.6%.
However, underlying inflation pressures showed signs of persistence, with CPI excluding volatile items and holiday travel rising from 2.7% yoy to 2.9% yoy. Trimmed mean CPI edged up from 2.7% yoy to 2.8% yoy.
These figures suggest that while headline inflation appears stable, core price pressures are still lingering, reinforcing RBA’s cautious stance on further easing.
The largest contributors to annual inflation included food and non-alcoholic beverages (+3.3% yoy), housing (+2.1% yoy), and alcohol and tobacco (+6.4% yoy).This was partly offset by a notable decline in electricity prices, which fell -11.5% yoy.
AUD/USD Mid-Day Report
Daily Pivots: (S1) 0.6325; (P) 0.6341; (R1) 0.6360; More...
AUD/USD's break of 0.6327 support should confirm short term topping at 0.6407, on bearish divergence condition in 4H MACD. Corrective rebound should have completed just ahead of 38.2% retracement of 0.6941 to 0.6087 at 0.6413. Intraday bias is back on the downside for retesting 0.6087 low. For now, risk will stay on the downside as long as 0.6407 holds, in case of recovery.
In the bigger picture, fall from 0.6941 (2024 high) is seen as part of the down trend from 0.8006 (2021 high). Next medium term target is 61.8% projection of 0.8006 to 0.6169 from 0.6941 at 0.5806. In any case, outlook will stay bearish as long as 55 W EMA (now at 0.6505) holds.
Crypto Market: Time for the Bold?
Market Picture
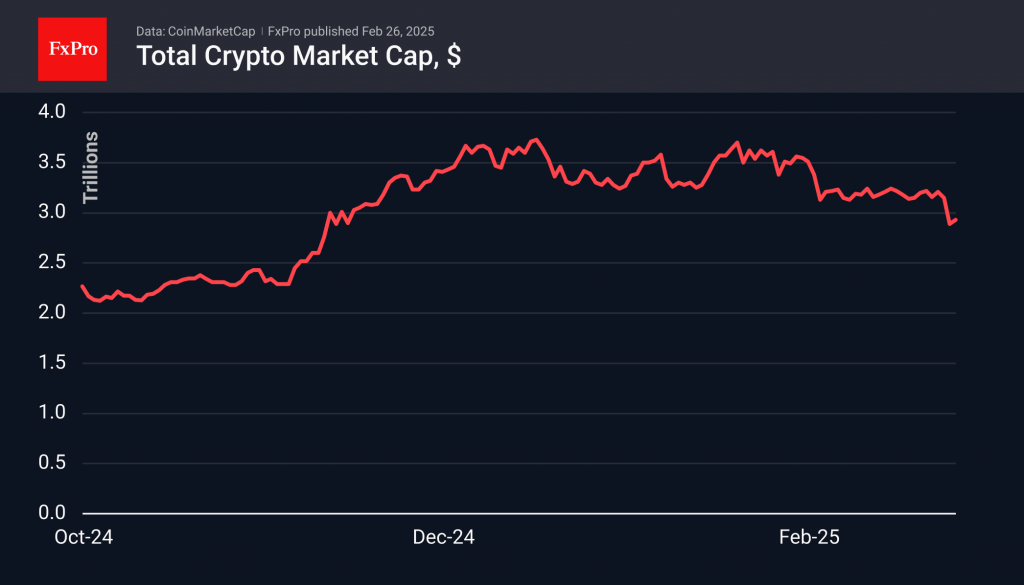
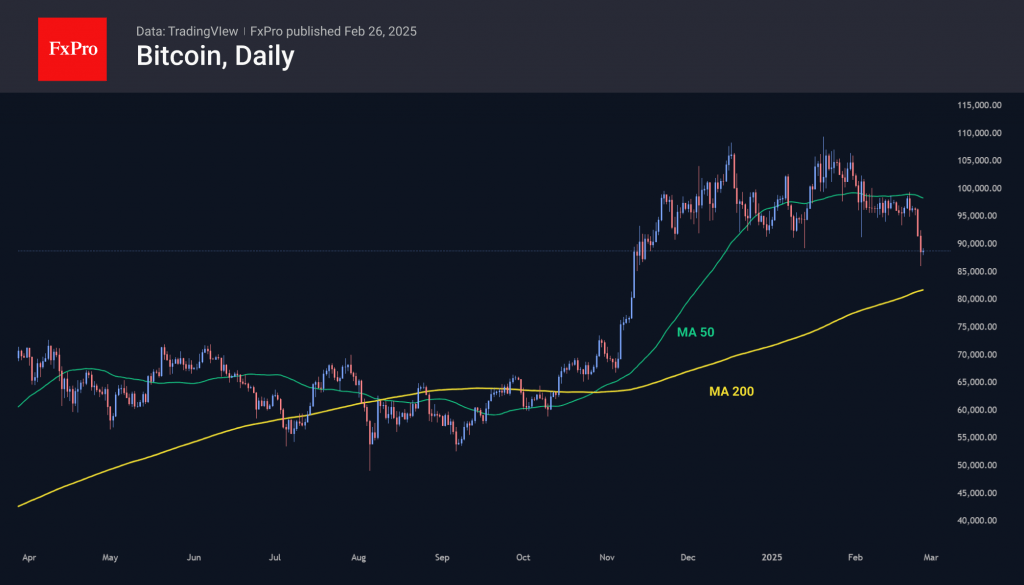
The crypto market fell below the support for the last three months on Tuesday, going into a brutal sell-off mode. Institutional investor sentiment didn’t help either, as US stock indices also saw a sell-off. Sentiment stabilised on Wednesday, and we see an attempt to form a bottom, pushing off from the $2.87T market cap and now up to $2.93T.
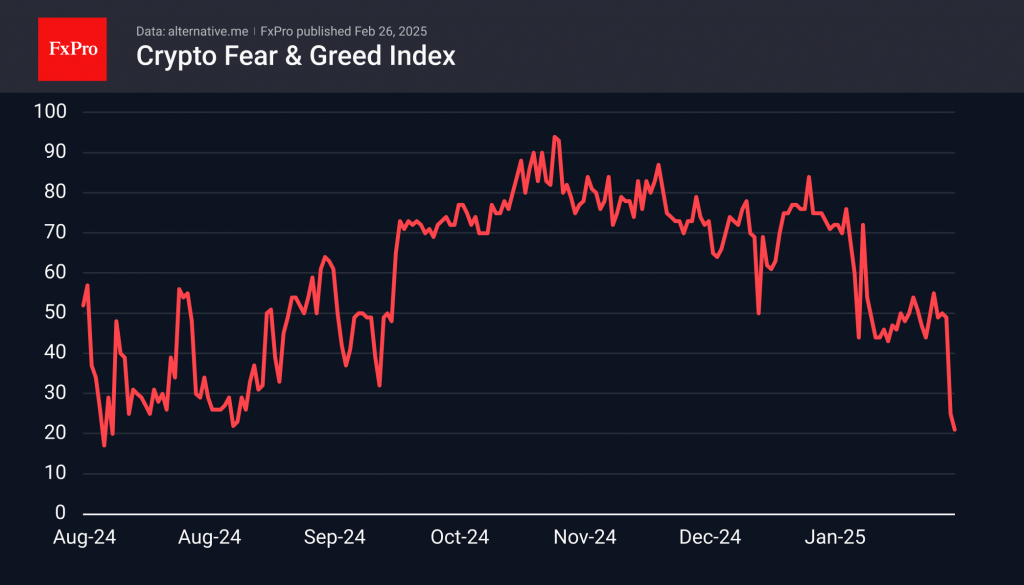
The cryptocurrency index has pulled back to the extreme fear area at 21, its lowest value since August last year. Earlier, we pointed out that the market lacked the drop into the fear region to attract greedy speculators. But now the question is whether those speculators have enough courage to buy.
Bitcoin broke through support in the 92000 area on Tuesday, near where the 61.8% retracement level of the November-December rally was. Bitcoin has given up half of the gains of that rally. The local target for the bears now looks like the area of the 200-day moving average at 82000. But already, Bitcoin is walking the edge of a bear market, losing about 20% from the peak. Further declines could open the floodgates for expanded liquidation of long positions in the crypto. As usual, saying, ‘I’ll be greedy when everyone else is scared,’ is much easier when you don’t have skin in the game.
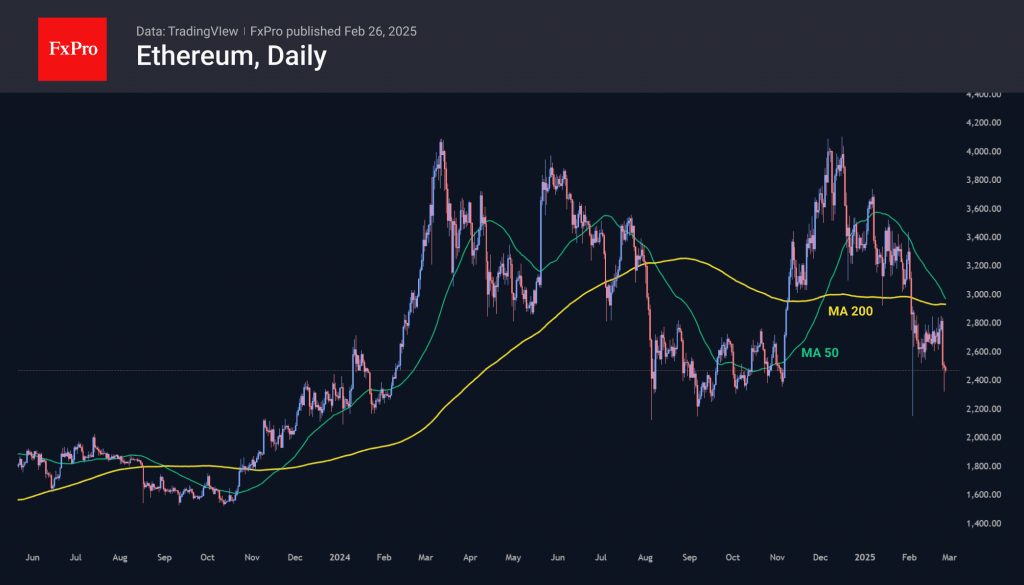
Ethereum and Solana have already rolled back to October-November levels, with huge technical potential for further capitulation. In the event of a further sell-off, Ethereum could fall another 35% to $1600, while Solana faces a much steeper potential decline of over 80% from its current price.
News Background
Bitcoin will fall to $70,000 if hedge funds liquidate positions in spot bitcoin ETFs, ex-BitMEX chief Arthur Hayes said. He noted that the funds are focused on gaining the so-called ‘basis spread,’ which is generated by the difference between longs in ETFs and shorts on CME-traded futures. The strategy looks attractive if its profit exceeds the yield on short-term US government bonds.
Strategy last week bought an additional 20,356 BTC for $1.99bn at an average price of $97,514. The company now holds 499,096 BTC worth $33.1bn at an average price of $66,357.
Pectra’s update to Holesky’s Ethereum testnet didn’t go according to plan, so the network stopped finalising slots. A bug related to Holesky’s features has already been identified, and it does not affect the main network in any way.
OKX will pay more than $504 million in settlement of the US Department of Justice claims. The exchange pleaded guilty to operating an unlicensed money transfer business in the US.
EUR/USD Appreciates as Optimism Builds Around Germany’s Fiscal Plans
EUR/USD climbed to 1.0504 on Wednesday, nearing its monthly high of 1.0528. The pair gained momentum following positive news from Germany, fuelling market optimism.
Key factors driving EUR/USD
Reports have emerged suggesting that Germany is considering the creation of a 200-billion-euro emergency fund, boosting expectations for increased local fiscal spending.
Additionally, Friedrich Merz, a leading candidate for the next German Chancellor, has proposed reforming the country’s debt brake to allow for more flexible financing of key expenditures. This could include tax cuts, lower energy prices, and a significant increase in defence spending – all of which could stimulate the German economy and support the euro.
Meanwhile, market participants are closely analysing recent comments from the European Central Bank (ECB) comments ahead of next week’s policy meeting. The ECB is widely expected to cut interest rates for the fifth consecutive time. However, some policymakers, including Isabel Schnabel, suggest that the central bank may soon need to pause or halt rate cuts altogether. The euro could find additional support if the ECB signals a more cautious stance on further easing,
Technical analysis of EUR/USD
On the H4 chart, EUR/USD completed a growth wave to 1.0524 and is now developing a downward wave towards 1.0450. A breakout below this level would open the potential for a further decline towards 1.0380. After reaching this target, a corrective rebound towards 1.0450 is likely. The MACD indicator confirms this scenario, with its signal line positioned above zero but pointing sharply downward.
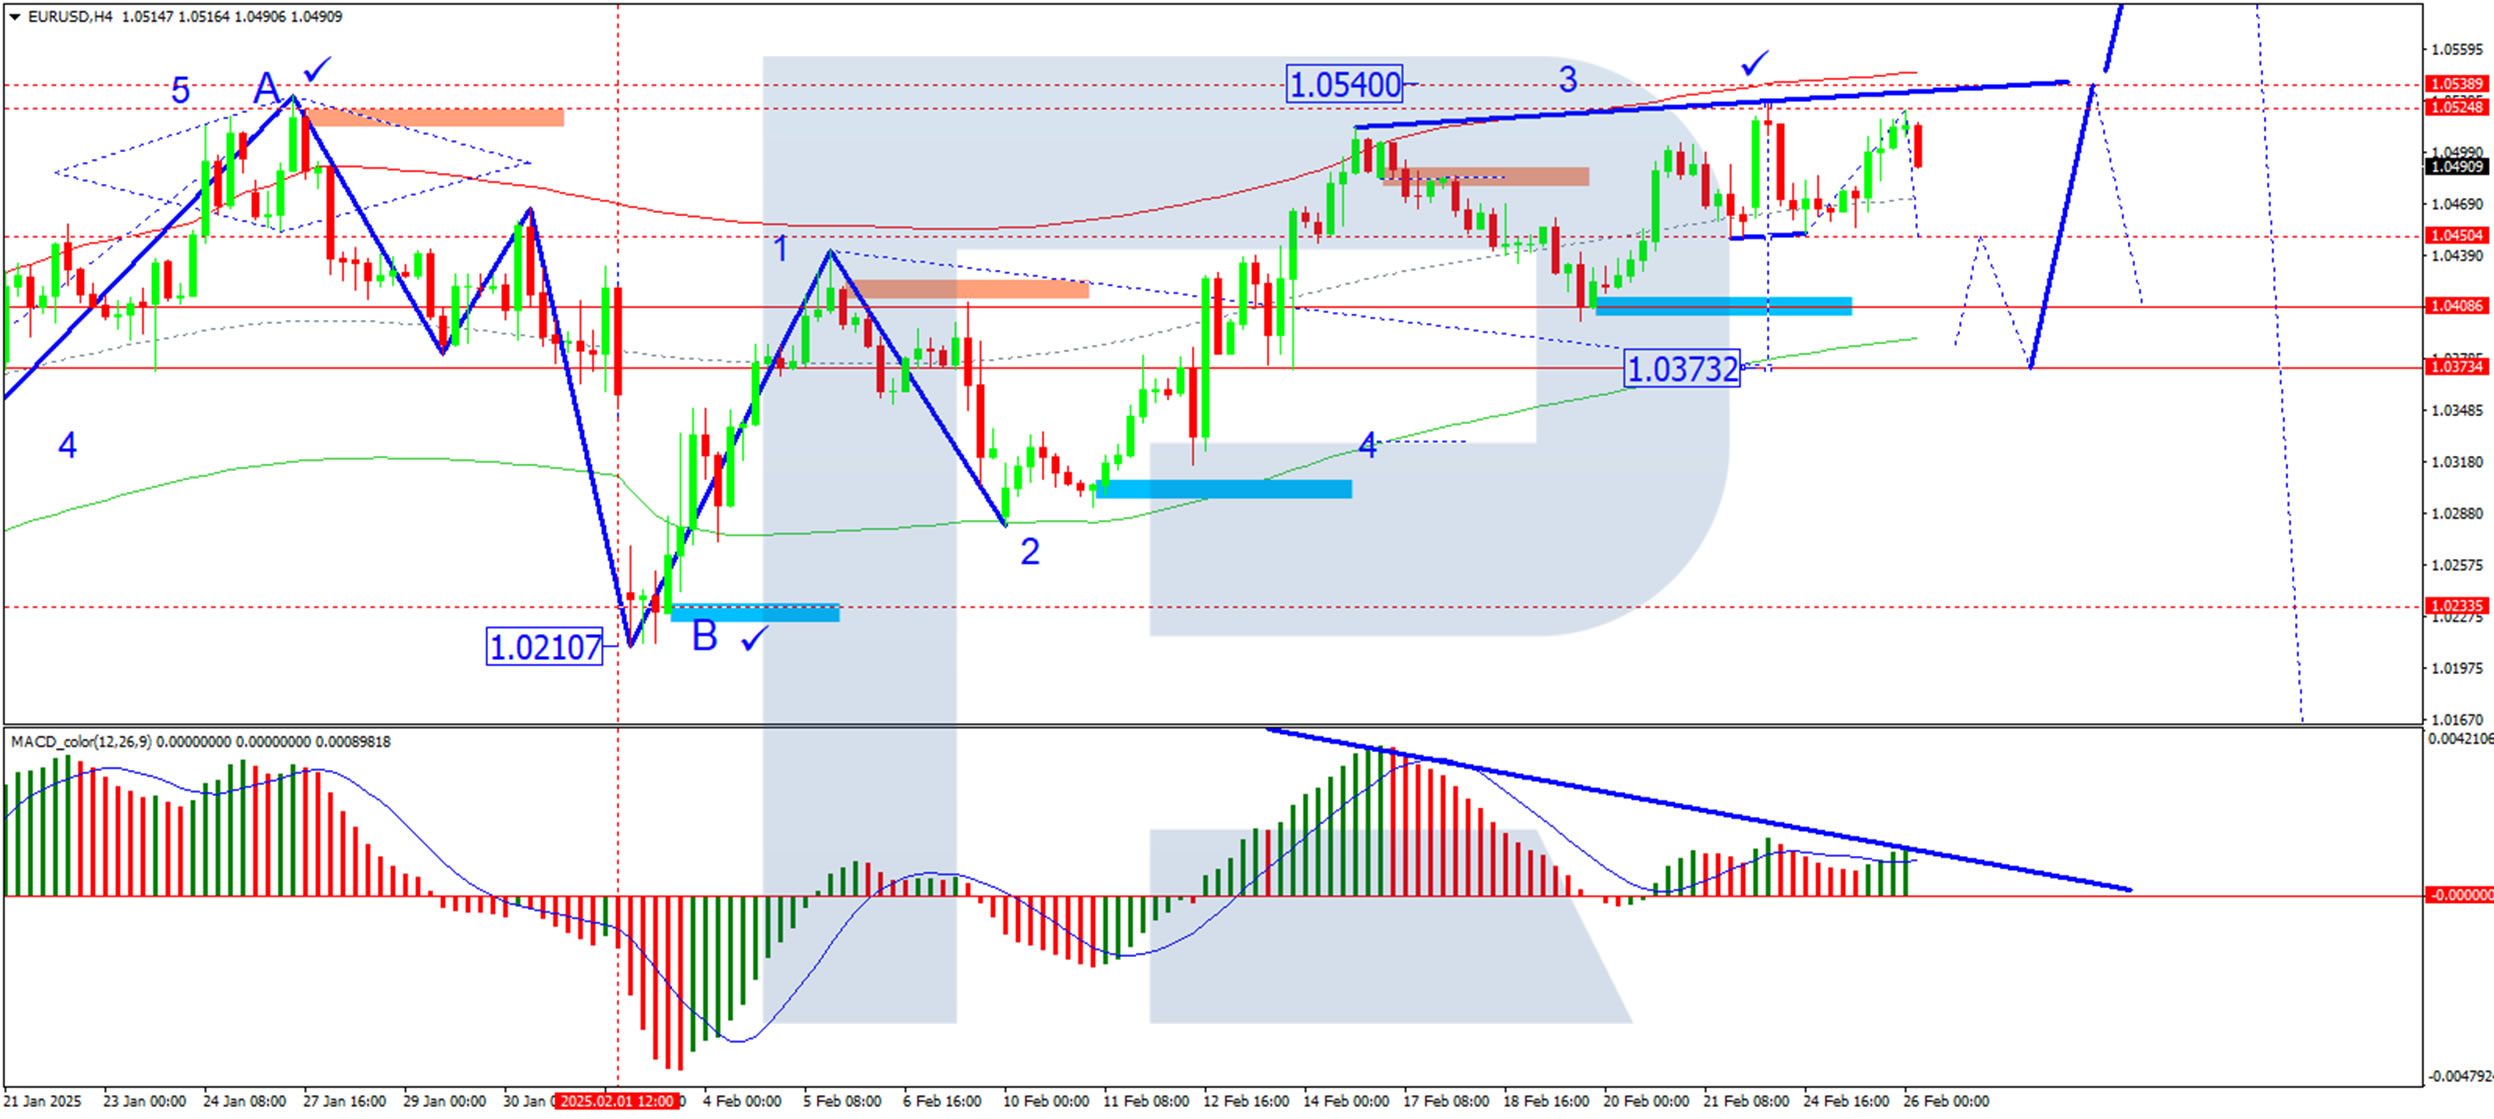
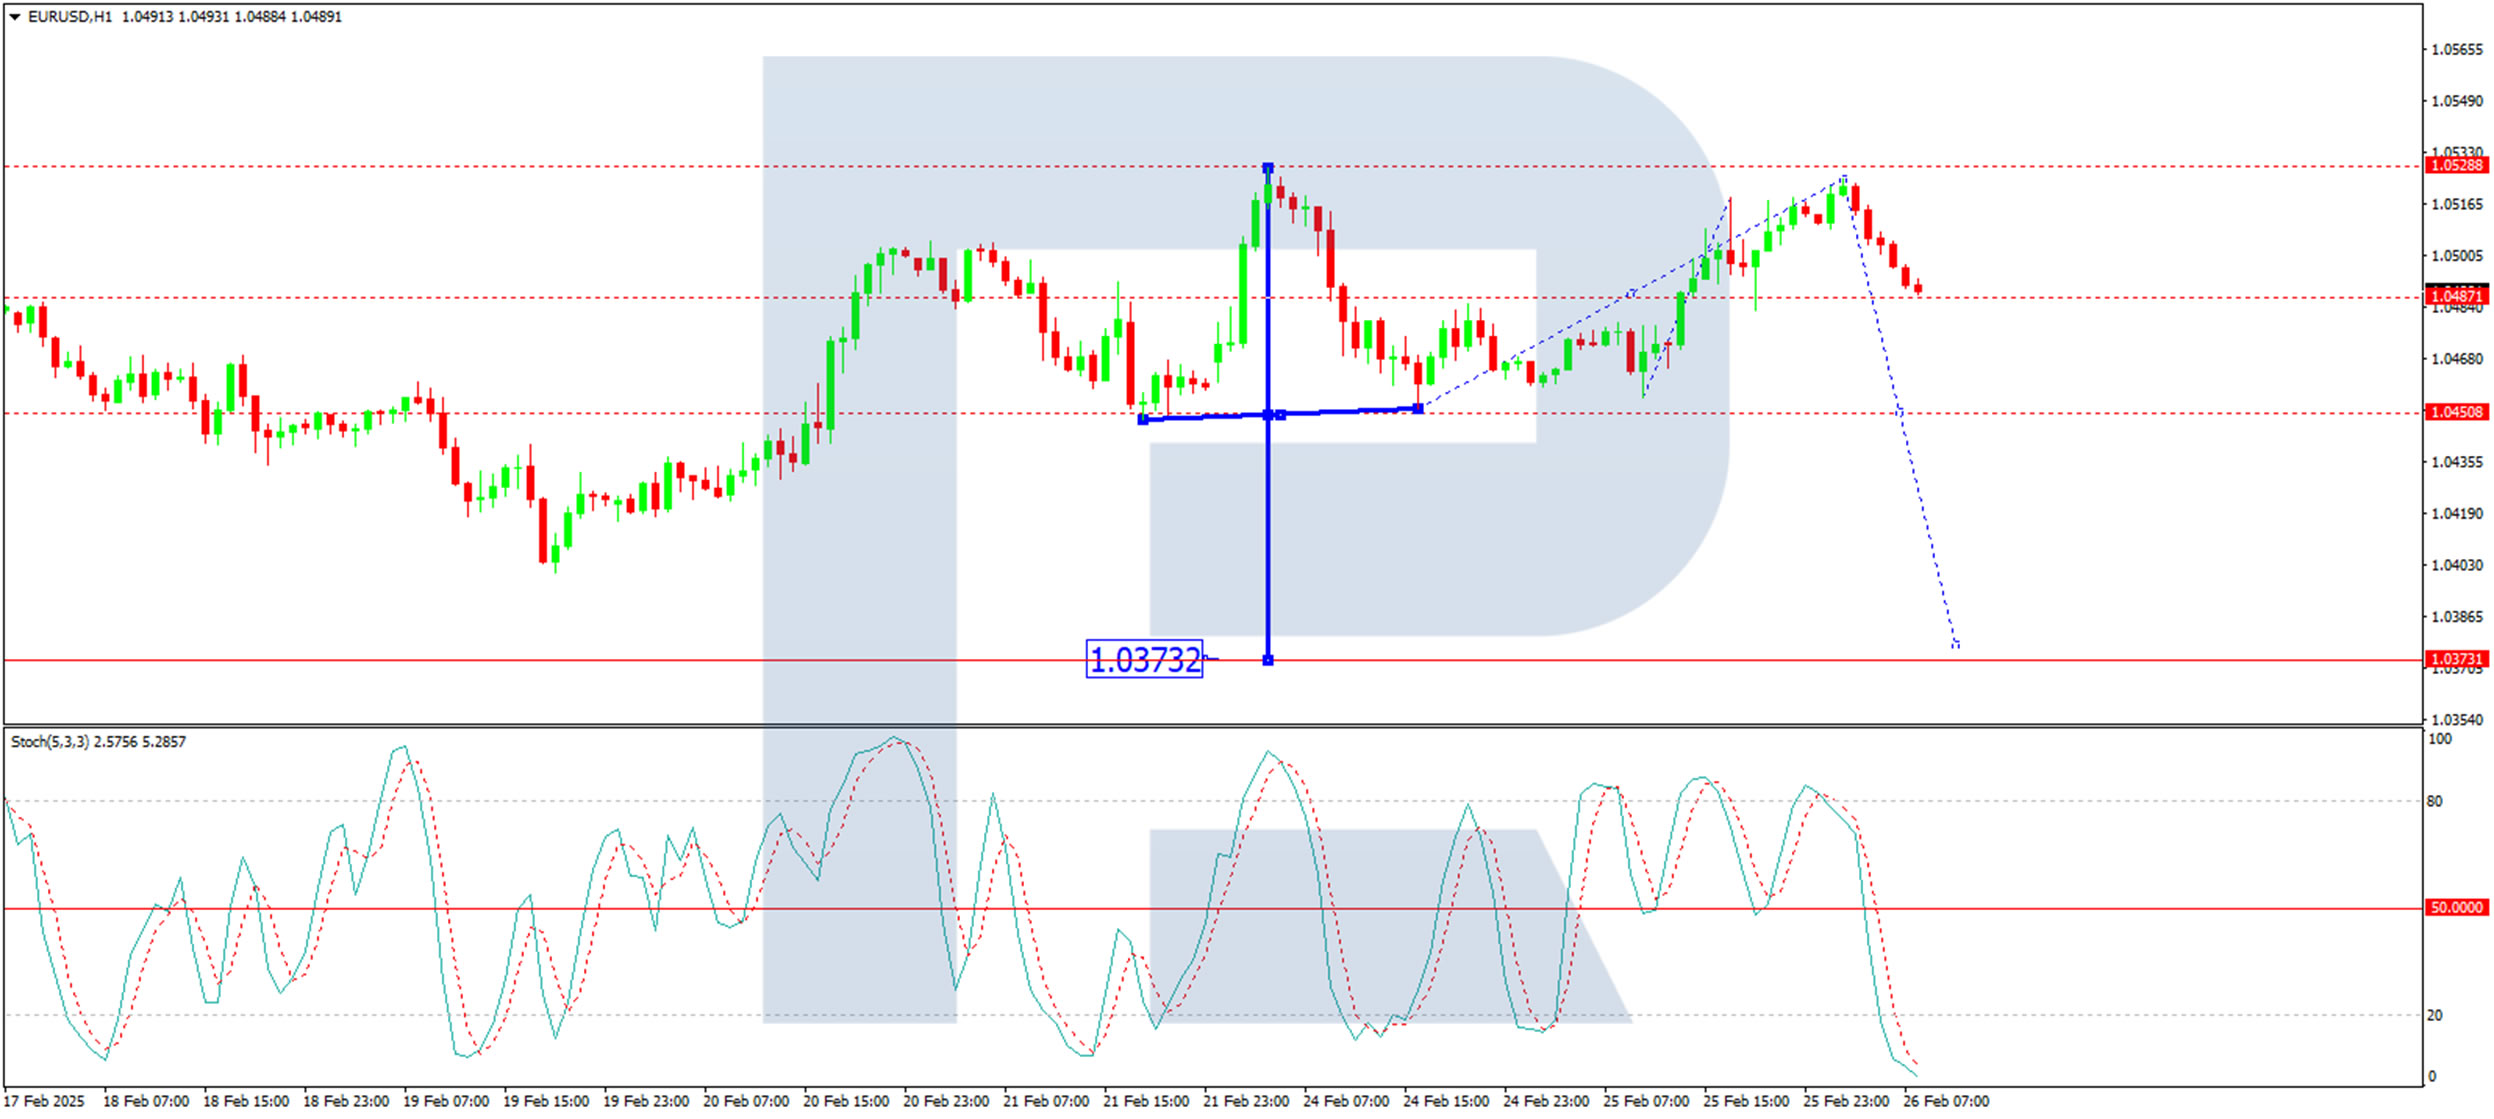
On the H1 chart, the market declined to 1.0453, followed by a correction to 1.0524. The likelihood of the downward wave continuing towards 1.0450 remains high. If this level is breached, the correction could extend towards 1.0380, with the broader trend potentially targeting 1.0373. The Stochastic oscillator supports this outlook, with its signal line above 50 and pointing decisively downward.
Conclusion
EUR/USD benefits from renewed optimism surrounding Germany’s potential fiscal expansion, but downside risks persist due to the uncertainty surrounding ECB policy. While technical indicators suggest an ongoing downward wave, the pair’s movement will depend on key support levels around 1.0450 and 1.0380. The upcoming ECB meeting remains a critical event that could shape the euro’s near-term direction.
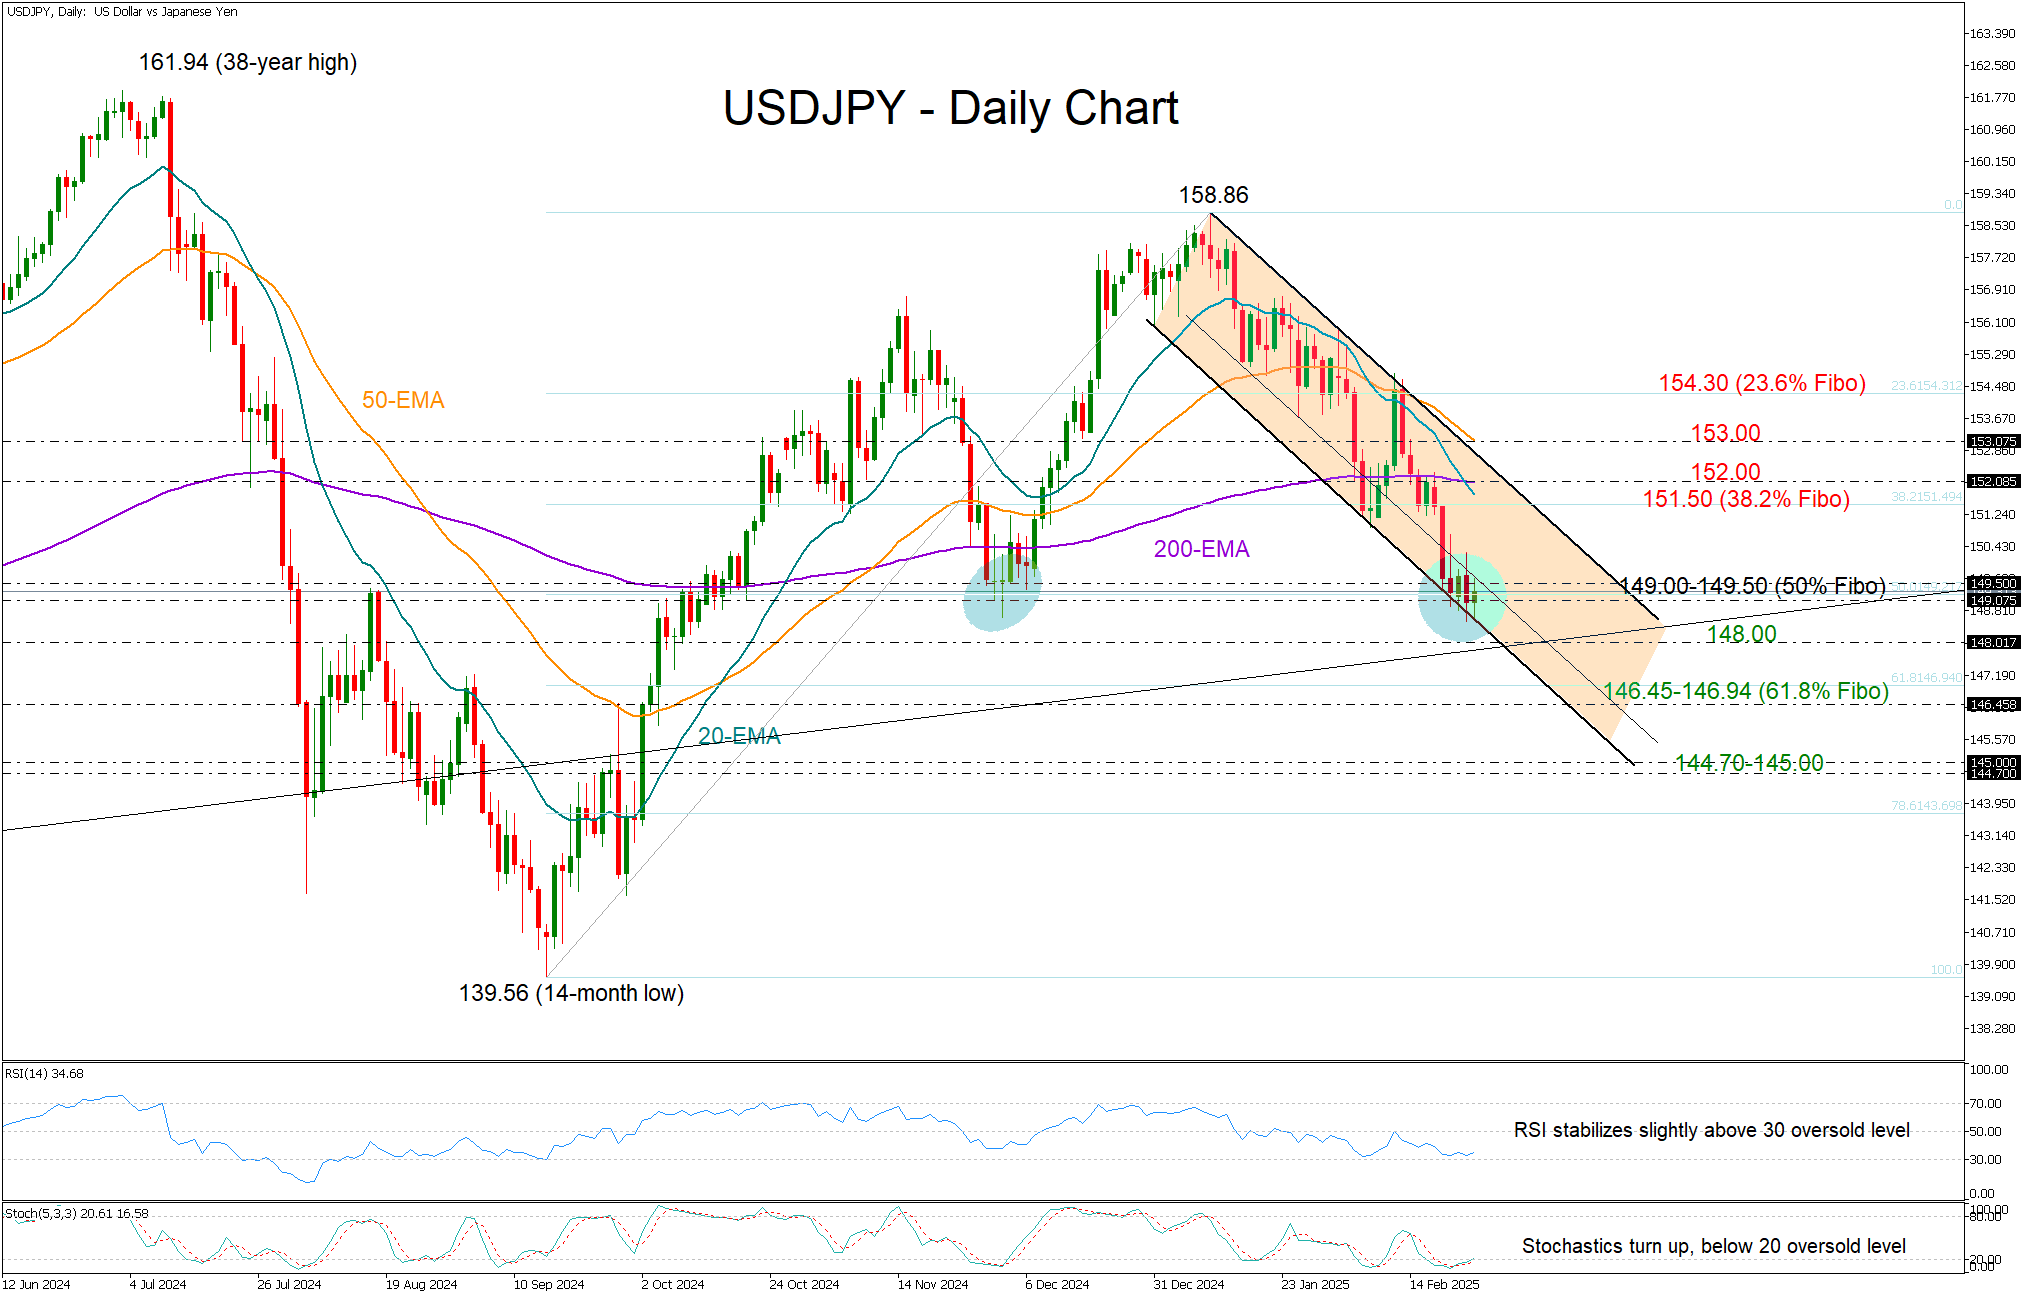
USD/JPY Holds the Line at 149.00
- USD/JPY retains support around 149.00 after slide to four-month low.
- Trend signals are negative, but a pause might be possible in short term.
USDJPY slid to a four-month low of 148.59 on Tuesday but managed to close just around the 149.00 psychological level, where the price found significant support back in December.
There is growing speculation now about whether the pair can replicate its December-January rally after shedding nearly 6% from its peak of 158.86.
The technical indicators are flagging oversold conditions as the RSI is forming a double bottom slightly above its 30 level and the stochastic oscillator is set for an upside reversal from below 20. However, the recent bearish crossover of the 20- and 200-day exponential moving averages (EMAs) – the first since August – is feeding concerns that any recovery may be short-lived.
The 149.50 barrier, which switched from support to resistance, must give way for an advance towards the 20- and 200-day EMAs seen within the 151.50-152.00 area. The 38.2% Fibonacci retracement of the December-January upleg is also in the neighborhood, while the descending trendline coming from January’s peak could cement that ceiling too. In the event of a bullish breakout above the 50-day EMA at 153.00, the rally could pick up steam towards the 23.6% Fibonacci of 154.30.
In the opposite case where the price closes below 149.00, the 148.00 mark may attempt to prevent a drop into 146.45-146.94, where the 61.8% Fibonacci level resides. A step lower could see a test within the 144.70-145.00 area.
Overall, USDJPY bulls may have another chance for an upside reversal, but confirmation above 149.50 remains crucial.
Australian CPI Lower Than Expected, Australian Dollar Drops
The Australian dollar has declined by 0.37% on Wednesday and is trading at 0.6320 in the European session. AUD/USD is down for a fourth consecutive trading day and has lost 1.2% during that time.
January inflation unchanged at 2.5%
Australia’s consumer price index was unchanged at 2.5% y/y for a second straight month in January. This was below the market estimate of 2.6% but inflation stayed at its highest level since August 2024. The drivers behind CPI were higher prices for food, electricity, alcohol and tobacco. Core CPI, a more reliable inflation indicator than headline CPI, edged up to 2.8% year-on-year from 2.7% in January.
The monthly inflation indicator is not as comprehensive as the quarterly inflation report, but shows that inflation remains relatively soft. The Reserve Bank of Australia won’t be too concerned as the inflation figures support last week’s decision to lower rates by 25 basis points, which brought the cash rate down to 4.1%.
RBA joins easing cycle but remains hawkish
Inflation is running within the Reserve Bank of Australia’s (Reserve Bank of Australia) target band of between two and three percent but the central bank remains concerned about upside risks to inflation. The RBA finally pressed the rate-cut trigger last week after maintaining rates for over a year and joined most of the major central banks which are well into their easing cycles.
Still, the RBA decision can be considered as a “hawkish cut” as the central bank stated at the last meeting that it “remains cautious” about the possibility of further cuts. The easing cycle could end up being very short and the markets aren’t expecting another rate cut before May.
Central banks across the globe are concerned about US President Trump’s trade policy, specifically the threat of tariffs, which would dampen global growth and boost inflation. The Trump administration has already imposed tariffs and China has imposed counter-tariffs. Another US-China trade war would damage the Australian economy as China is Australia’s largest trading partner.
AUD/USD Technical
- AUD/USD is testing support at 0.6320. Below, there is support at 0.6284
- 0.6365 and 0.6401 are the next resistance lines