Sample Category Title
Crypto Market Finds a Pain Point
Market Picture
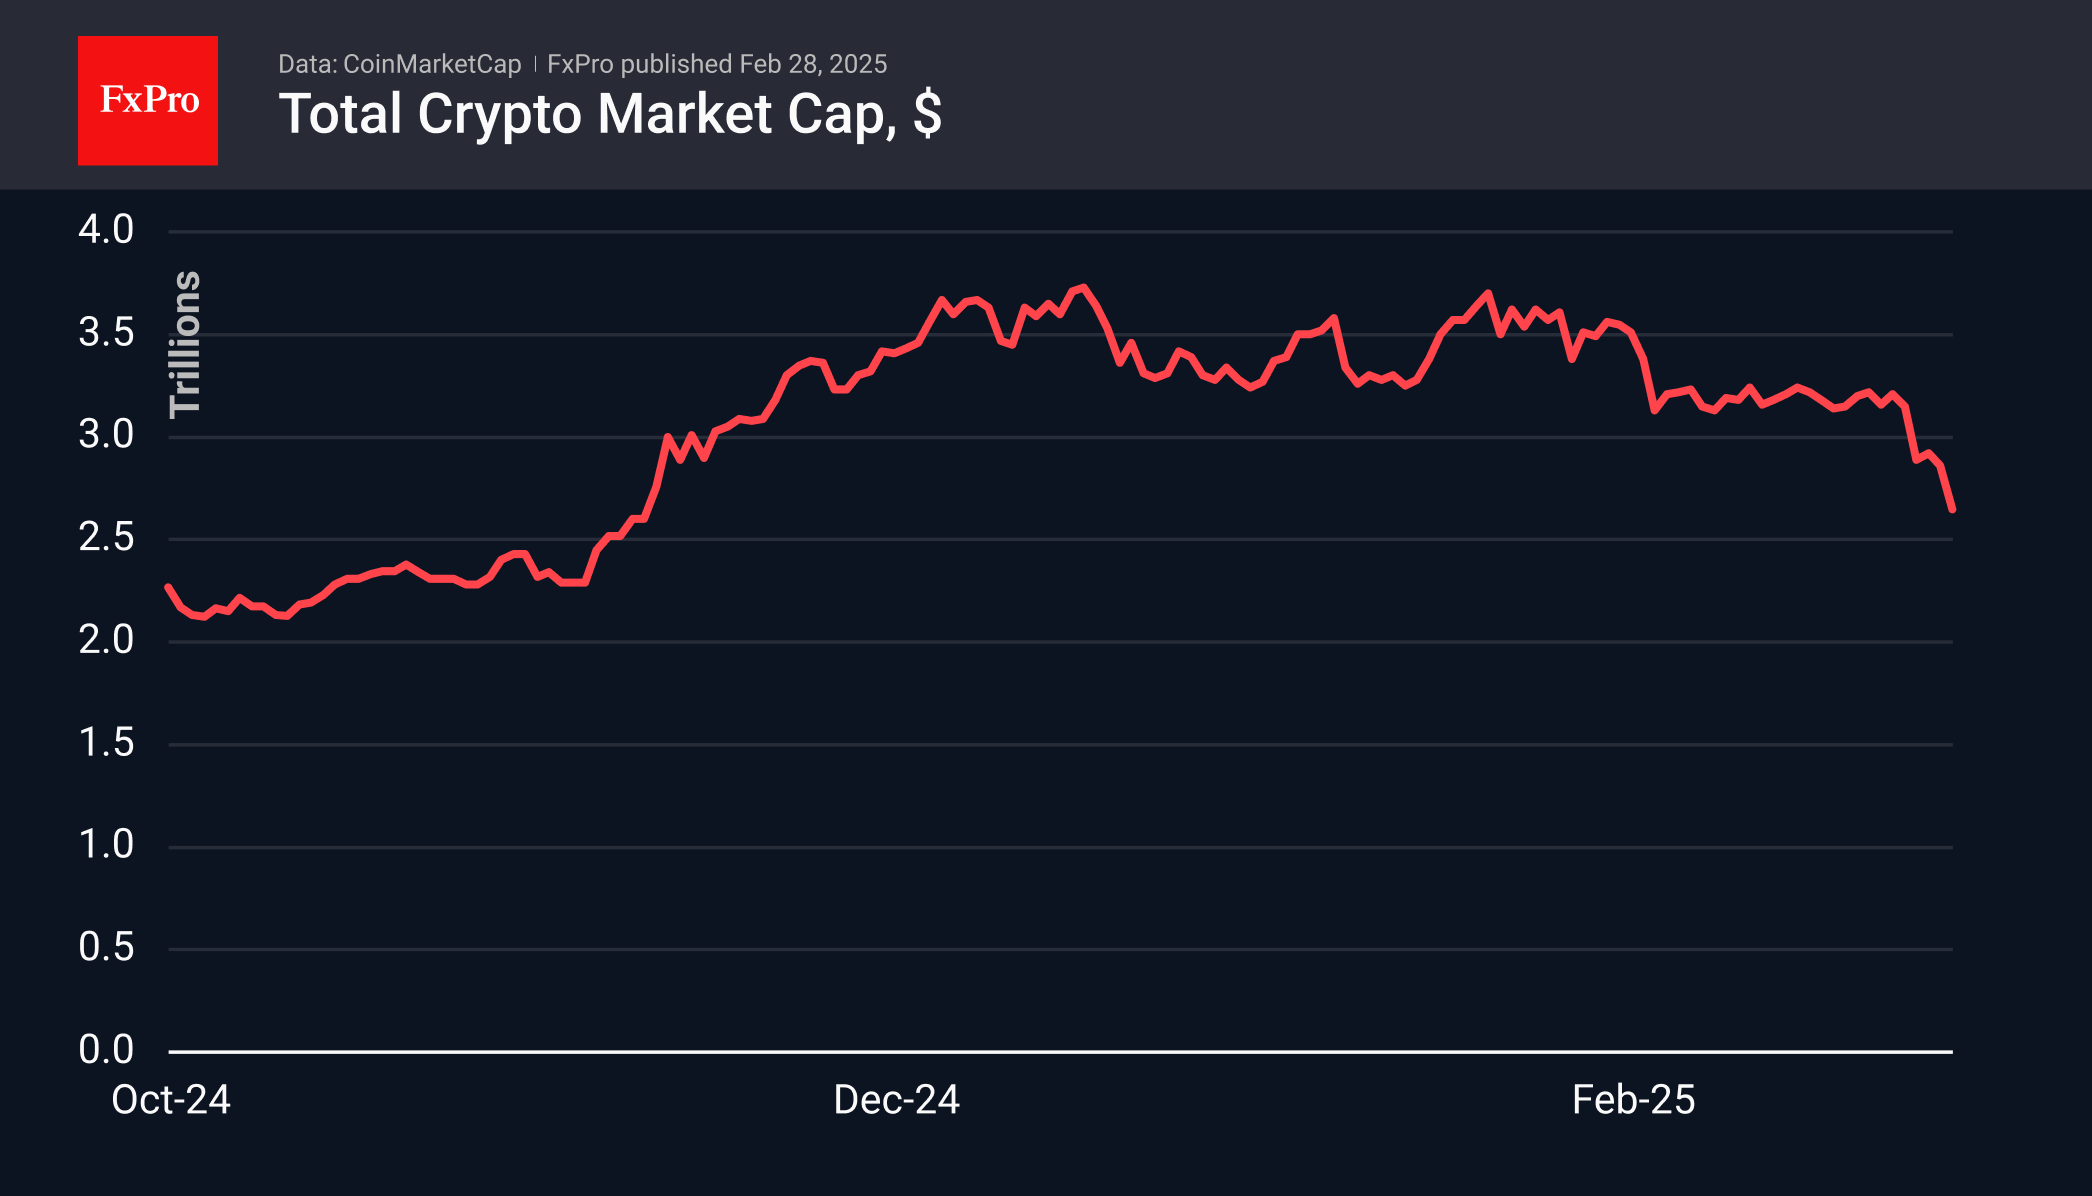
Crypto market capitalization collapsed by 7.5% in the last 24 hours to $2.65 trillion, the lowest level since November 10th. Unlike the dynamics of the previous two days, there was no rebound at the beginning of Friday; there was just a timid attempt at consolidation. It seems that the market has found the pain point of short-term buyers, knocking out the “weak hands.”
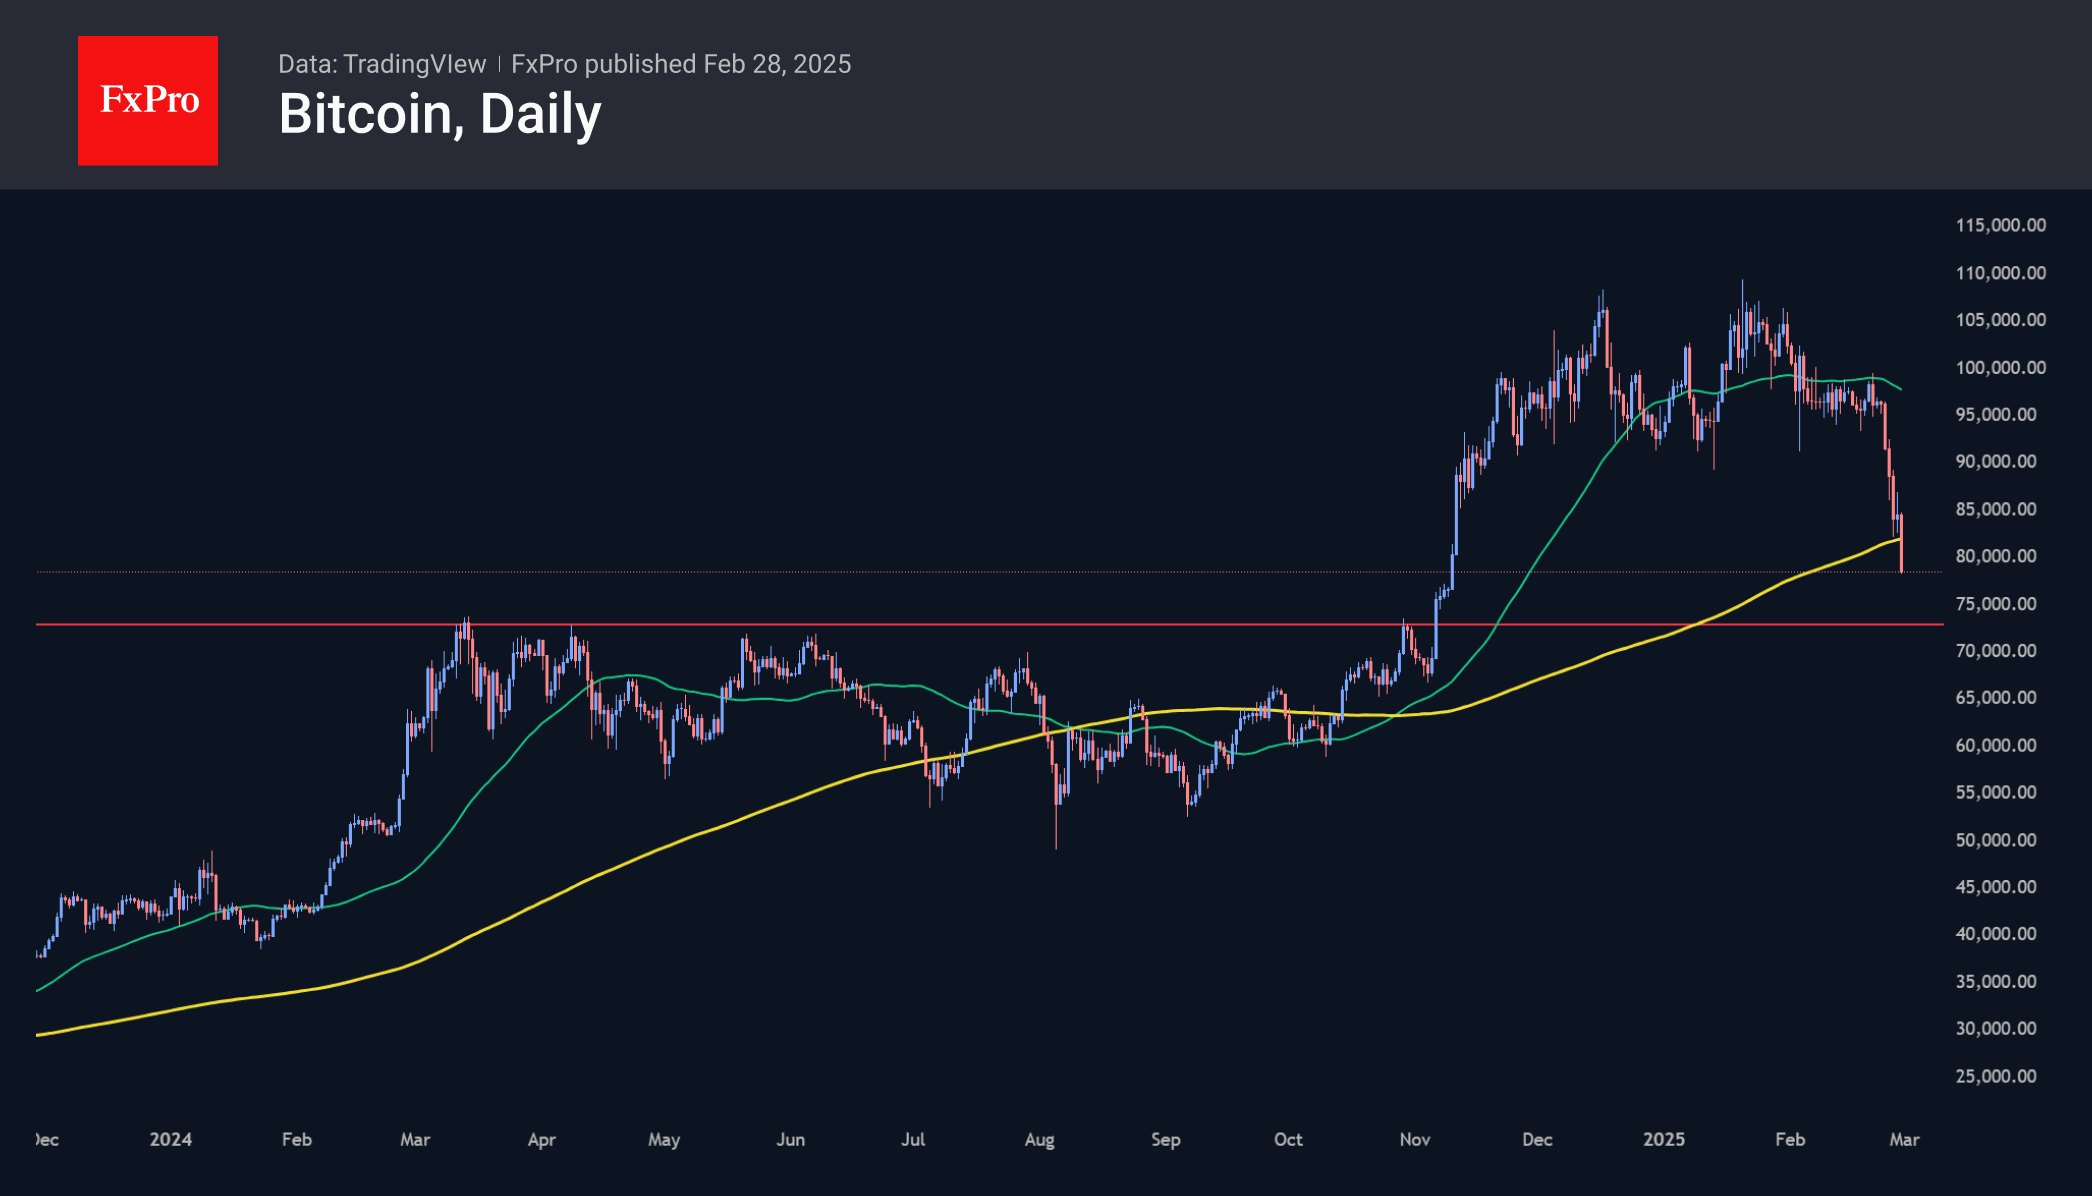
Bitcoin has lost 8.6% over the last day, having pulled back under $79,000. The formal bearish trend boundary and the 200-day moving average remain above the current price level. Bitcoin will completely nullify Trump’s rally if it pulls back to the $70K area, which has acted as resistance for most of the past year. Going below will not be easy—the market is too oversold.
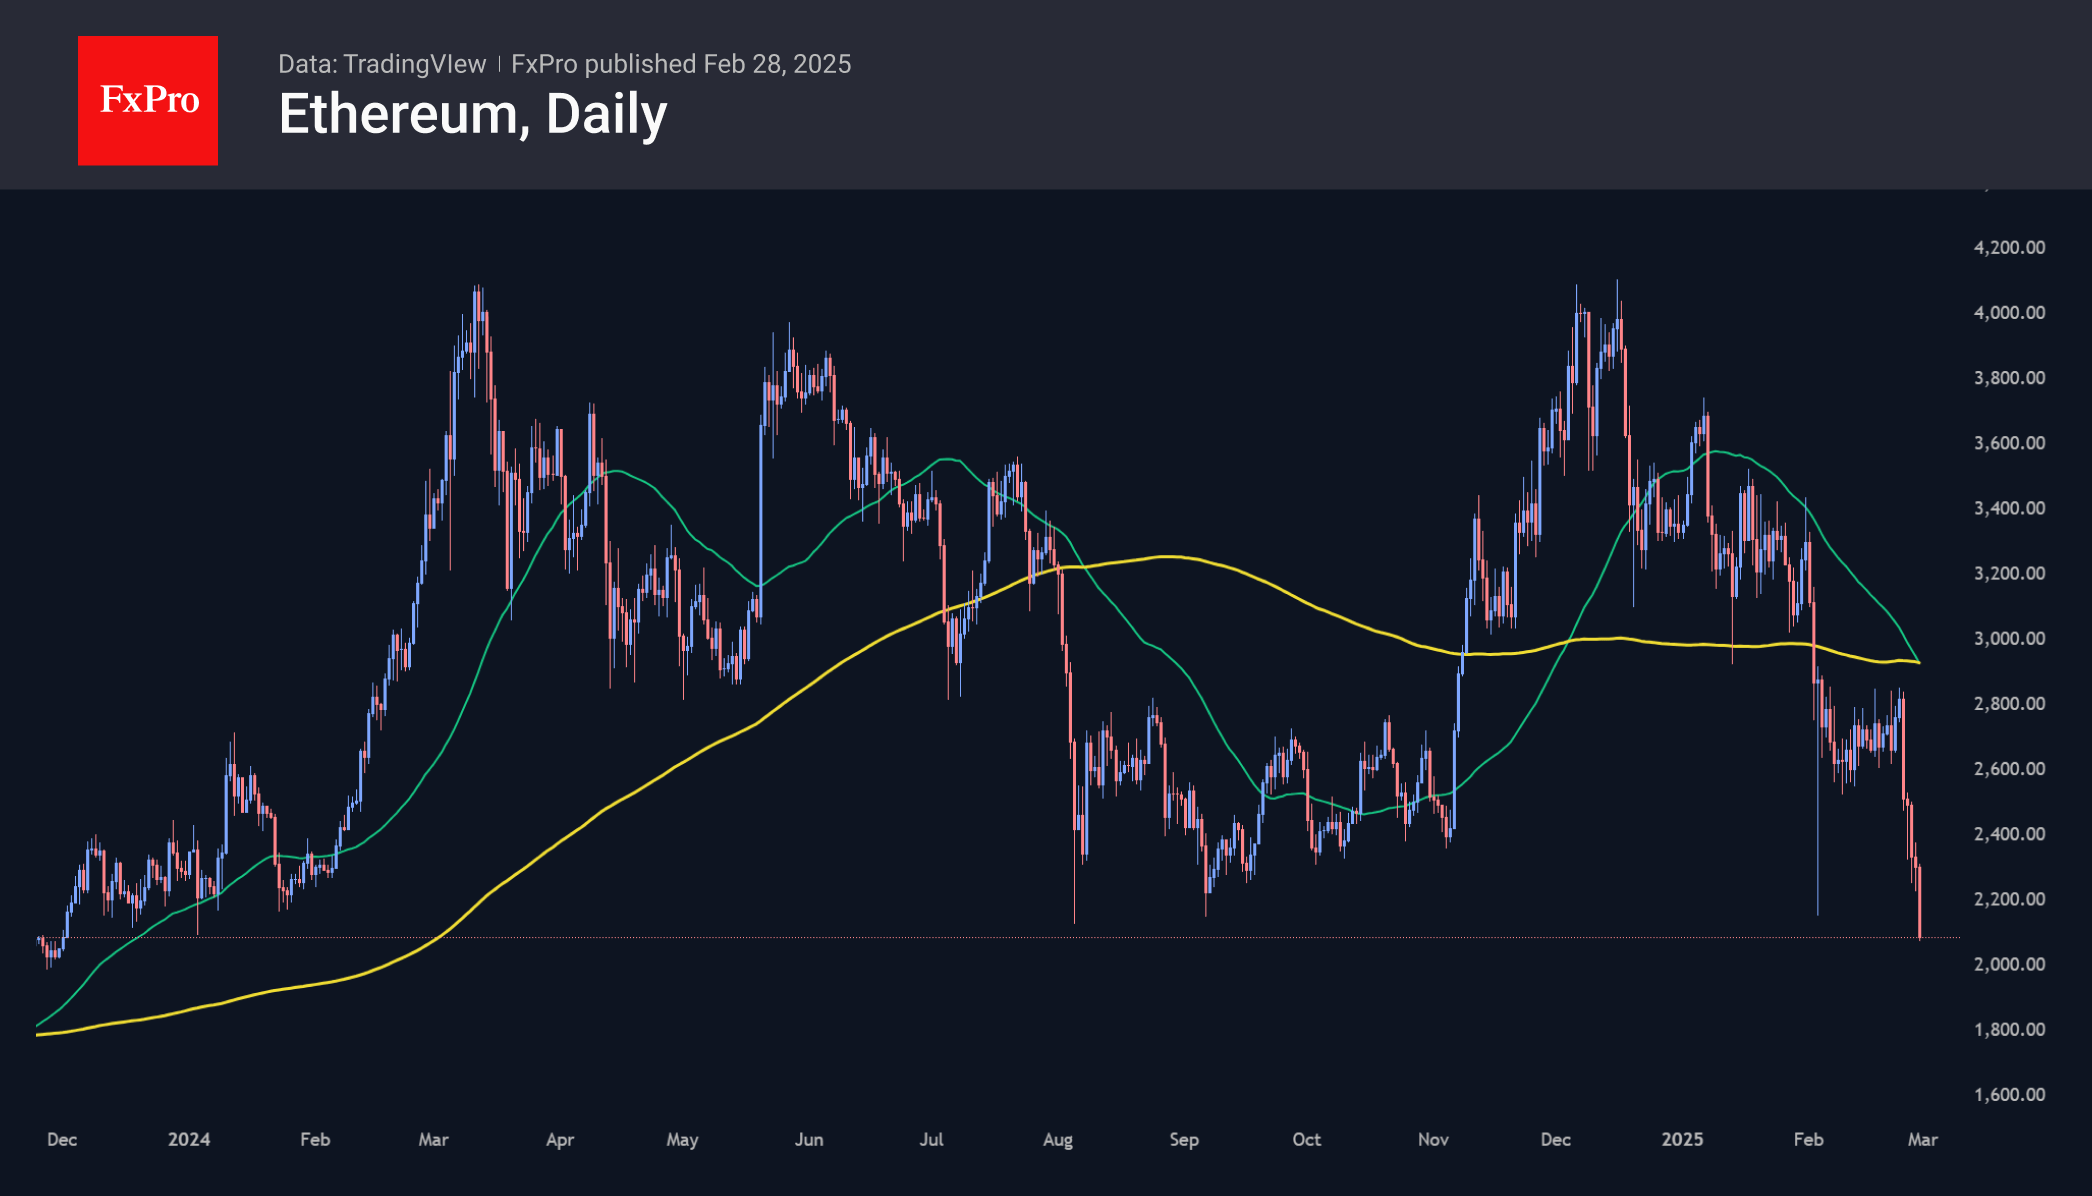
Ethereum has pulled back below $2100, trading in the area of last year’s lows and attempting to break lower. This bad news is amplified by the “death cross,” a bearish signal that occurs when the 50-day moving average dips below the 200-day moving average. Ironically, this signal was followed by stabilization last August, although a full-fledged return of buyers had to wait three months.

News Background
Presto Research attributes the sharp drop in Bitcoin in recent days to hedge funds winding down positions focused on “basis spread” arbitrage. Basis on CME and Binance, in terms of annualized rates, are not yet showing signs of recovery.
SignalPlus draws attention to the weakening of Bitcoin’s implied volatility as prices fall, which acts as a symptom of speculators abandoning near-term growth expectations.
Gemini cryptocurrency exchange co-founder Cameron Winklevoss said that the US SEC has stopped investigating the platform and will not recommend any enforcement action.
Tether’s USDT stablecoin will soon support transactions on the Tron blockchain with no fees in TRX. According to Justin Sun, founder of the Tron ecosystem, the new option will become available in early March.
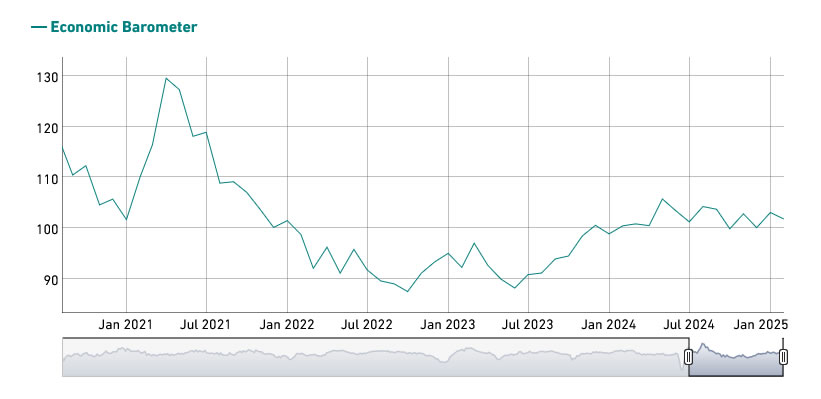
Swiss KOF falls to 101.7, manufacturing and services under pressure
Switzerland's KOF Economic Barometer declined from 103.0 to 101.7 in February, missing expectations of 102.1.
The data suggests weakening momentum in the economy, with most production-side sectors facing increasing pressure. According to KOF, manufacturing and services sectors saw the most notable deterioration.
However, the report also pointed to some stabilizing factors, as foreign demand and private consumption showed resilience, helping to offset some of the negative trends.
BoE’s Ramsden sees inflation risks two-sided
BoE Deputy Governor Dave Ramsden indicated a shift in his inflation outlook, stating that he no longer views risks to achieving the 2% target as skewed to the downside. Instead, he now sees inflation risks as "two-sided," acknowledging the potential for "more inflationary as well as disinflationary scenarios".
Ramsden also raised concerns about the UK's sluggish economic growth, highlighting the possibility that the economy's supply capacity might be "even weaker" than previously assessed by BoE.
If this proves true, the UK’s "speed limit" for growth would be lower, leading to prolonged tightness in the labor market and sustained wage pressures. That would result in "greater persistence in domestic inflationary pressures."
Stars Aligned for a Significant Risk-off Correction
Markets
The stars aligned for a significant risk-off correction yesterday. First and foremost, the market narrative changed since the end of last week with investors attaching a higher probability to a mid-term US recession. Especially sentiment surveys highlighted numbing uncertainty with consumers and businesses as DOGE efforts bite and as the overall policy mix risks working inflationary. A (too) restrictive monetary policy (from a growth point of view) could end up being the straw that breaks the camel’s back. In this respect, we started noting a first change of tone in some Fed speeches. Cleveland Fed Hammack said that rates are restrictive enough to lower inflation. Kansas City Fed Schmid suggested that the Fed could have to balance inflation risks against growth concerns. Philly Fed Harker thinks that the policy rate remains restrictive enough to continue putting downward pressure on inflation over the longer term. Second, tariffs have an amplifying market impact in this negative setting. The confirmation of the March 4 deadline for 25% tariffs on Mexico and Canada, the 10%pts increase on the earlier 10% on Chinese goods, the April 2 deadline for reciprocal tariffs and the first growl against Europe (“25% on autos, other things”) added to the rally in US Treasuries and weakness in stock markets. In FX space though, it sparked a turnaround in the USD’s fortunes: currencies of trading partners yesterday underperformed a USD being vulnerable to the idea of a US recession. A battle of weakness. EUR/USD slipped back below 1.04 after a failed test of first resistance at 1.0533 earlier this week. USD/CAD left YTD lows below 1.42 at the start of the week to currently change hands around 1.4450. Finally, the reigning negative risk sentiment determined the interpretation of AI-bellwether Nvidia’s Q4 earnings. Strong and a beat, but not fantastic as investor’s got used too. The stock entered the ongoing vicious spiral, correcting around 8.5% and dragging the AI- and tech-heavy Nasdaq almost 3% lower with the index losing support at 18831 (YTD low and downside of sideways trend channel since December).
Risk sentiment remains key today and we continue to err on the side of caution. Last-minute deals to fend off the 25% tariffs in Mexico and Canada are possible but risk-reward it could be more interesting to await the facts. There are asymmetric risks to US PCE deflators today with in-line or lower outcomes able to extend a continuation of trends in especially US Treasuries. German and French CPI data serve as a prelude for the EMU number on Monday and could bolster the case of an April pause in the ECB’s cutting cycle.
News & Views
Tokyo February inflation eased a little more than expected in February. The headline gauge fell from 3.4% to 2.9% vs a 3.2% estimate. The central bank’s preferred measure which excludes fresh food retreated from 2.5% to 2.2% (2.3% expected). Both continue to be impacted by government subsidies that offset some of the energy costs though, masking some of the underlying price strength. CPI ex fresh food and energy matched last month’s 1.9% in a sign of ongoing steady price rises. Tokyo inflation is often seen as a good indication of the national figure’s (March 21) direction. Education subsidies in the country’s capital keeps the pace slower than in the rest of Japan, though. Other data showed Japanese industrial production tumbling 1.1% m/m. This sharp drop is partially the result of the Chinese Lunar New Year, which probably disrupted trade flows. Retail sales in Japan climbed 0.5% m/m to 3.9% y/y. The Japanese yen holds up pretty well this morning against overall USD strength after the data releases. USD/JPY trades around 150.
Bloomberg had a sneak peak in the European Council’s draft conclusions ahead of the important March 6 summit during which EU leaders will be seeking ways to finance massive - to the tune of €500bn - rearmament investments. It will call on the Commission “to propose additional funding sources for defense at EU level, including by means of additional flexibility in the use of structural funds, and to present swiftly relevant proposals,” the news agency reported. The draft text also said the Council will ask the European Investment Bank to adapt lending practices to the defense industry, noting it should re-evaluate the list of excluded activities, as well as urge the Commission to present options to use the flexibility within the fiscal rules. The latter should allow for “significant defense spending” at the national level without breaching the 3% deficit rules.
US Dollar Gains on Renewed Tariff Fears, Focus on PCE Data
Despite beating both revenue and earnings expectations and the forecasts for the current quarter, Nvidia got beaten by the market. The share price tanked 8.50% in yesterday’s post-earnings session, took out the 200-DMA and closed near the $120 level – which also matches the minor 23.6% Fibonacci retracement on the AI rally. The stock remains in the bullish trend, from a technical perspective, following a more than 900% surge since the beginning of 2023, and will remain in the bullish trend above the $100 per share – which beautifully matches the major 38.2% Fibonacci retracement that could distinguish between the AI rally and a medium-term and a more persistent pullback. But the short-term direction looks bearish, with trend and momentum indicators hinting at the possibility of a deeper pullback.
And while Nvidia was bearing the brunt of having fallen short of the most euphoric analyst expectations this Wednesday, Amazon revealed an update to its Alexa which now uses AI to answer questions. The company also announced to have built its first quantum-computing chip – that may not be excellent news for Nvidia. But Amazon fell too, by more than 2.50%, on the kind of news that could’ve easily trigger a rally. Salesforce’s results also fell short of market expectations and further weighed on optimism that their AI product would boost sales. CRM is on its way to test an important critical support range between $275/290 area including the 200-DMA and the major 8.2% Fibonacci retracement on the AI-boosted rally since the beginning of 2023. One bright spot this week was Snowflake. The company forecasted a better-than-expected revenue growth thanks to its AI products and expanded a deal with Microsoft Azure to give access to OpenAI’s services. The share price jump opened but couldn’t resist to the overall selloff and spent the session giving back gains. It closed some 4.50% higher. Microsoft lost 1.80%.
Overall, Nvidia’s failure to satisfy the increasingly-hard-to-satisfy investors weighed on market mood, along with new tariff talk from Donald Trump. The Tariff Man said that he would go ahead with tariffs on Mexico and Canada as soon as the beginning of March and unveiled plans to impose 25% tariffs on EU imports – details will land soon. The Stoxx 600 eased yesterday, the DAX lost more than 1% as the carmakers, there, will almost certainly be concerned by the 25% levies that Trump is referring too. But the European defense stocks continued to see demand. BAE Systems rose near 3.50% yesterday, Rheinmetall gained 3.50% and traded at a record high, and Leonardo gained nearly 4% and hit a fresh ATH level, too.
Meanwhile, the British PM Keir Starmer met Trump in Washington yesterday to try to smooth things over between the two old friends. And he probably did better than Macron earlier this week... who couldn’t prevent the announcement of 25% tariffs on the EU products hours later... As such, the FTSE 100 index was standing out yesterday, as the index eked out gains as its European peers were hit by tariff fears.
In the FX, the fresh tariff threats hammered both the euro and sterling. The EURUSD slipped below the 1.04 level and is testing the 50-DMA to the downside this morning despite higher-than-expected Spanish CPI update yesterday. More CPI updates from euro are countries are due today but the data could remain under the shadow of the tariff fears. Potentially stronger-than-expected numbers may not weaken European Central Bank (ECB) rate cut expectations; the tariffs and their negative implications are expected to hit the European economies enough to give the ECB doves a leverage beyond data.
Across the Channel, Cable slipped below its 100-DMA and sterling bulls abandoned the fight near the major 38.2% Fibonacci retracement front on September to January Trump-led selloff, and is preparing to close the week without having successfully reversed the bearish trend. The USDJPY is testing the 150 resistance on the back of a broadly stronger US dollar and weaker-than-expected inflation numbers released in Japan. You want to laugh? The latest Marvel movie pictures US entering in war with Japan, apparently. Anyway, even gold fell yesterday faced with a stronger US dollar. The price of an ounce slipped below the $2900 level. While a pullback after having flirted with the $3000 level is healthy, the outlook for gold remains positive on the back of tense global geopolitical environment.
US PCE in focus
Yesterday, the US GDP data confirmed that the US grew 2.3% in Q4, as expected, but the price pressures were stronger than pencilled in by analysts. Initial jobless claims, on the other hand, hit the highest level since last October, with a visible rise in Washington’s jobless claims – as Federal workers are being thanked en masse by Elon Musk’s DOGE. Will the latter soften the Federal Reserve (Fed) outlook and increase bets for more rate hikes this year? It depends on the inflation’s trajectory. Due today, the US will reveal its latest core PCE data – the Fed’s favourite gauge of inflation - that could show easing in January. If that’s the case, we could maybe see the US indices recover a part of the latest weakness.
Trump Tariff Whammy Strikes Again
In focus today
In the US, the Fed's preferred measure for inflation, the PCE, is due for release for January. While the earlier CPI showed a notable uptick in inflation pressures at the beginning of the year, the components from CPI and PPI that feed into the PCE indicated a more modest rise in the latter.
Today, we receive February inflation data from Germany and Italy.
A bunch of Swedish data released at 08.00 CET today. Retail sales for January, where we would not be overly surprised to see a setback following the strong December figure. The Swedish National Mediation Office also publishes data on Swedish wage developments up until December 2024. But most interestingly, we can summarize the Swedish growth year of 2024 as we receive the final piece to the puzzle, namely the Q4 figure. We expect +0.4% in Q4, which would result in yearly GDP growth of 0.6% for 2024, aligned with our December Nordic Outlook forecast.
Economic and market news
What happened overnight
In Japan, Tokyo CPI inflation for February was slightly below expectations, with CPI excl. fresh food printing 2.2% y/y (cons: 2.3%, prior: 2.5%). While this marked a slowdown for the first time in four months, the downtick mainly reflected revived energy subsidies. Hence the underlying trend remains unchanged with high food prices. The Tokyo CPI is normally a leading indicator for national CPI data, suggesting some potential downside risks when the February report is released late March. All in all, the measure remains above the central bank's 2% target, supporting our view of further rate hikes by the BoJ. Speaking of BoJ, deputy governor Uchida stated that the central bank will keep tapering its government bond purchases despite recent rises in yields. Uchida also reaffirmed BoJ's readiness to hike rates if data evolve as projected.
What happened yesterday
In the US, tariffs were in the limelight, as Trump announced that the proposed tariffs on Mexico and Canada will come into effect on 4 March as scheduled, while announcing an additional 10% tax on China. This naturally led to USD-strengthening against CAD, MXN and CNH, but the overall market reaction was relatively muted, indicating that markets may be waiting for actual implementation of the much-discussed tariffs. The rhetoric was relatively mild toward the UK, as Trump said that the UK could escape levies if the two countries agree on a trade deal after meeting UK PM Starmer yesterday.
Data-wise, yesterday was somewhat of a nothing burger, as the second estimate of Q4 GDP remained unchanged from the flash release with no meaningful revisions in the details, and initial jobless claims and continuing claims showed no major surprises. Similarly, the overall signals from Fed speak did not rock the boat, as Harker (hawk and non-voter) and Hammack (hawk and non-voter) emphasized that the Fed should keep the policy rate at current levels. Schmid (hawk and voter) pointed out that the Fed should stay on its toes amid the rise in inflation expectations, while also noting looming growth concerns. Looking ahead, we believe that the Fed will be on pause in March and May, though we think the cutting cycle is far from over.
In the euro area, credit growth for January ticked up to 1.3% y/y from 1.1% y/y in December. The increasing credit growth should support the economy and shows that the recent easing of monetary policy is starting to affect the economy. While the ECB's Schnabel argues that the rising credit growth is a sign that monetary policy might not be restrictive anymore, we continue to believe that monetary policy is restrictive. As such, we expect the ECB to cut the policy rate below 2% as the growth rate in credit remains very low in yearly terms and highlight that recent momentum in the credit impulse has flatlined in recent months. For more details on our expectations for the ECB, please see ECB Preview - A cut is the easy part, 28 February.
In Spain, headline inflation for January was held up by energy prices as expected. Conversely, core was weaker than consensus declining to 2.1% y/y (cons: 2.3%, prior: 2.24%). The February report affirmed the trend seen in the recent months, namely that energy inflation is holding up the headline figure, while the core measure is much softer. On Monday, we expect euro area inflation to decline to 2.3% from 2.5% and core inflation to 2.5% from 2.7% due to lower energy and services inflation. The Spanish data suggests some small upside risk to the headline figure amid high energy inflation, but we will know more when we get French and German inflation today.
In Sweden, the NIER economic tendency indicator decreased marginally in February to 97.1, indicating somewhat subdued sentiment. Price plans rose, mostly driven by food prices. The consumer confidence indicator fell by 3.3 units to 95.0, showing weaker sentiment than usual. While we did not expect this after the high PPI figures and last week's high inflation print, food prices are the main driver, yielding some comfort.
In Norway, the LFS-unemployment rate (trend adjusted) was 3.9% in January, unchanged from the revised December figures. This confirms our expectation that the labour market remains relatively tight even though growth in employment seems to have slowed. As always, we put more emphasis on the NAV-figures, where February numbers are due this morning. Also, Norges Bank's Expectations Survey has been postponed to today.
Equities: Risk-off was the story yesterday. We have been surprised by how isolated the sell-off has been to the US but this time selling took place in Europe and Asia as well. Trump 2.0 policy is an easy excuse for the pullback. While markets have so far viewed tariff threats as a negotiating tactic, it is not completely immune to the volatility. Stoxx 600 dropped -0.5%, led by the auto sector that slid -4%. Asian markets reacting more harshly with most Asian markets <-3% this morning. However, tech sell-off is just as much to blame for the big market moves. Despite the strong Nvidia report, the stock plunged almost -10% yesterday. This is rather a reflection of high US valuation getting questioned which is more of a rotation story than a risk-off story. US futures are little changed this morning.
FI: President Trump's announcement of tariffs on Mexico, Canada and China will take effect next week sparked renewed downward pressure on global yields yesterday. The 10Y US Treasury yield is now trading very close to our 12M target of 4.20%, while the Fed Funds terminal rate pricing is moving closer to 3.5%. EGB yields fell a couple of basis points across the curve, while Bund ASW spreads saw a bit of reversal of the past week's downward trend.
FX: The USD rallied broadly yesterday after US President Trump confirmed upcoming import tariff hikes on Canada, China and Mexico. Of noticeable moves, EUR/USD fell towards 1.04 and EUR/SEK rose close to 11.19.
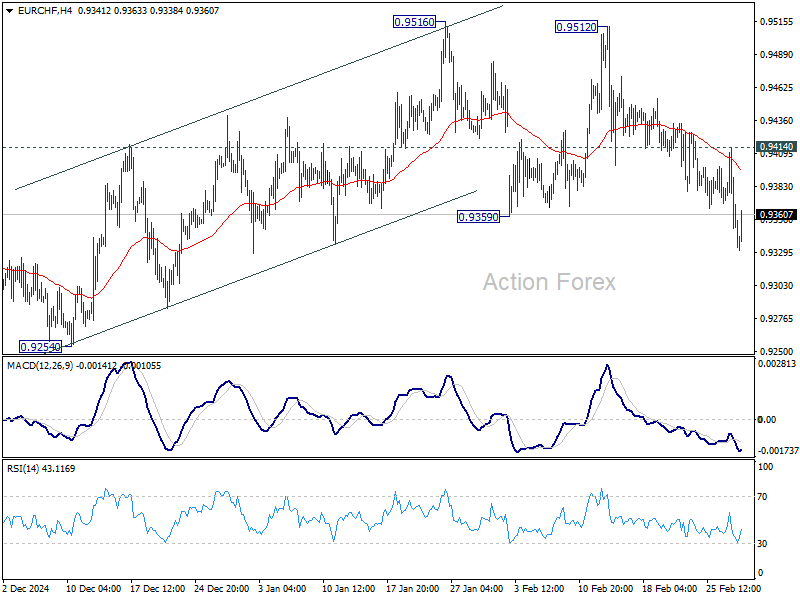
EUR/CHF Daily Outlook
Daily Pivots: (S1) 0.9332; (P) 0.9374; (R1) 0.9397; More....
EUR/CHF's break of 0.9359 support revives the case that corrective rebound from 0.9204 has completed after rejection by 0.9481 fibonacci resistance. Intraday bias is back on the downside for retesting 0.9204 low. On the upside, though, break of 0.9414 resistance will mix up the outlook again and turn intraday bias neutral.
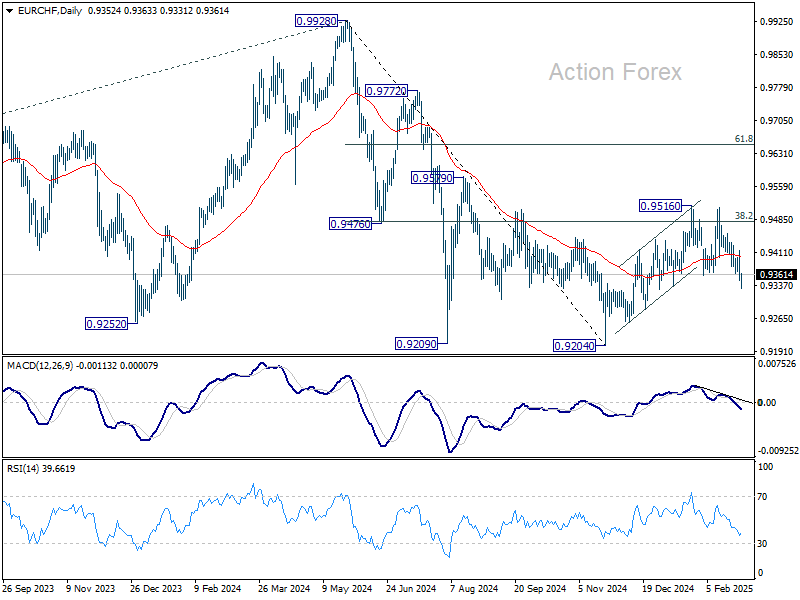
In the bigger picture, sustained trading above 38.2% retracement of 0.9928 to 0.9204 at 0.9481 should confirm that whole fall from 0.9928 has completed at 0.9204. Further rally should then be seen back to 61.8% retracement at 0.9651 and above. However, another rejection by 0.9481 will keep outlook bearish for extending larger down trend through 0.9204 at a later stage.
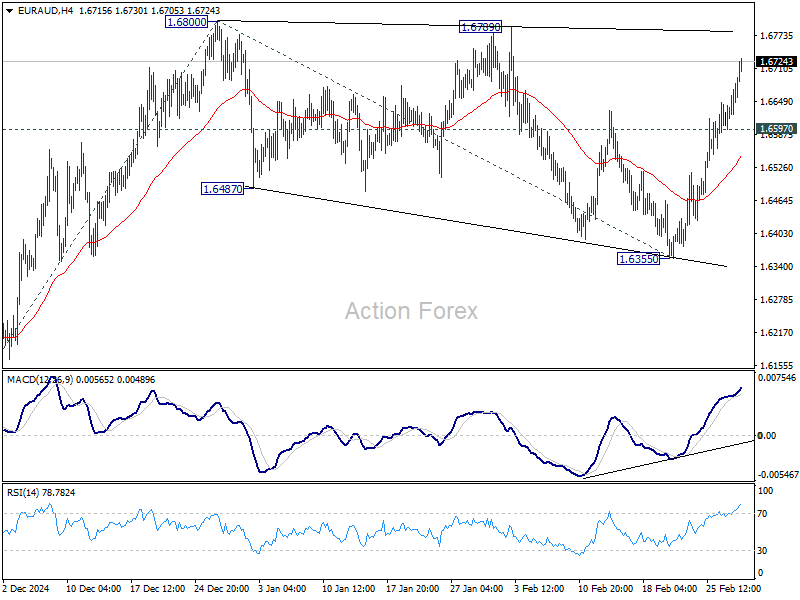
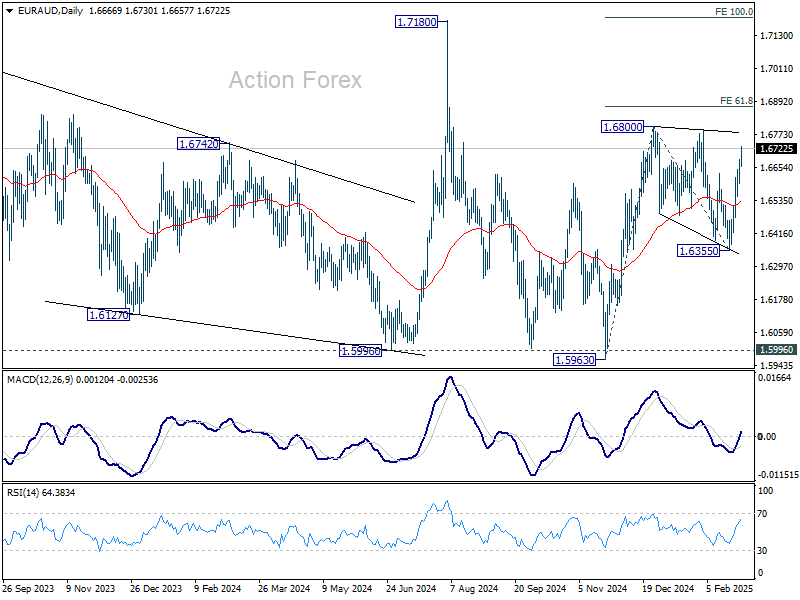
EUR/AUD Daily Outlook
Daily Pivots: (S1) 1.6621; (P) 1.6654; (R1) 1.6709; More...
Intraday bias in EUR/AUD stays on the upside for retesting 1.6800 resistance. Break there will resume the rise from 1.5963 to 61.8% projection of 1.5963 to 136800 from 1.6355 at 1.6872. Sustained trading above there should bring upside acceleration to 100% projection at 1.7192, which is close to 1.7180 high. On the downside, below 1.6597 minor support will delay the bullish case and turn intraday bias neutral first.
In the bigger picture, with 1.5996 key support (2024 low) intact, larger up trend from 1.4281 (2022 low) is still in favor to resume through 1.7180 at a later stage. Nevertheless, sustained break of 1.5996 will indicate that such up trend has completed and deeper decline would be seen.
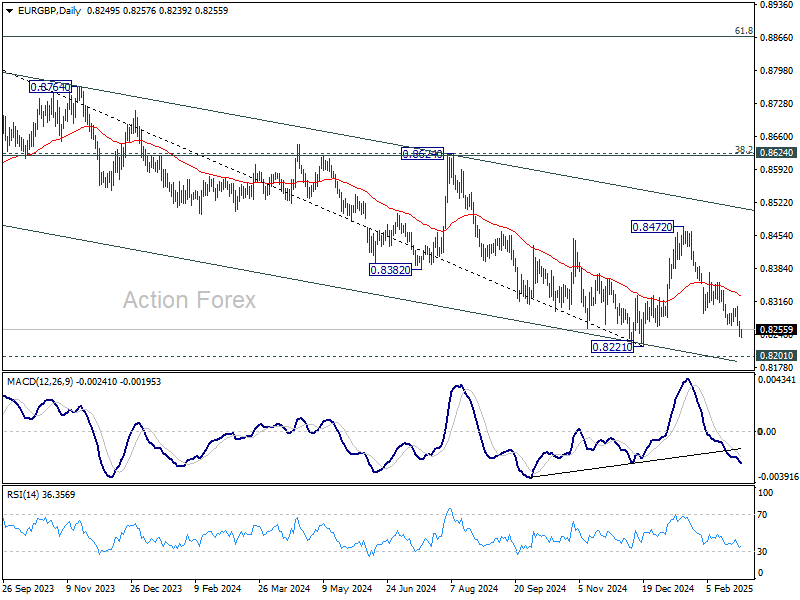
EUR/GBP Daily Outlook
Daily Pivots: (S1) 0.8238; (P) 0.8256; (R1) 0.8271; More...
Intraday bias in EUR/GBP remains on the downside as fall from 0.8472 is in progress for retesting 0.8201/21 key support level. Firm break there will carry larger bearish implications. For now, risk will stay on the downside as long as 0.8304 resistance holds, in case of recovery.
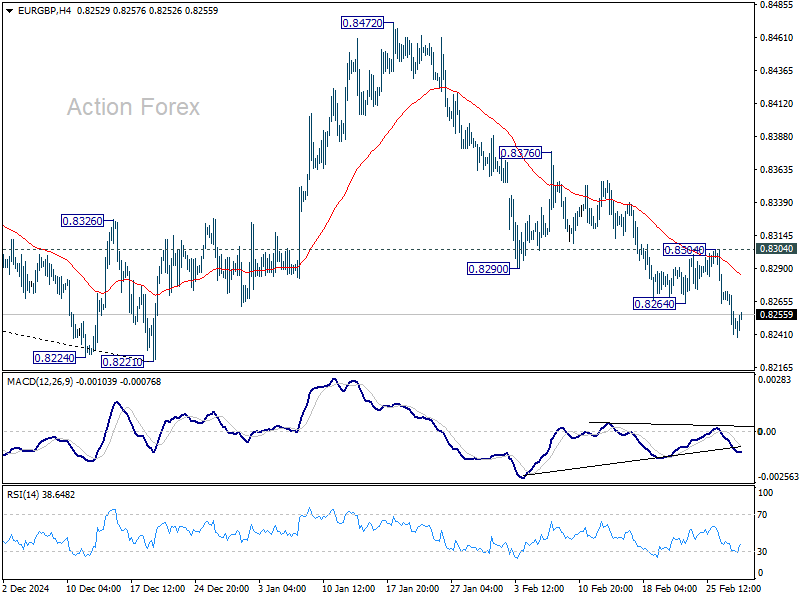
In the bigger picture, the medium term down trend remains intact with EUR/GBP staying well inside the falling channel. Prior rejection by 55 W EMA (now at 0.8431) also affirm bearishness. Decisive break of 0.8201/8221 support zone will resume whole down trend from 0.9449 (2020 high) and carry larger bearish implications.
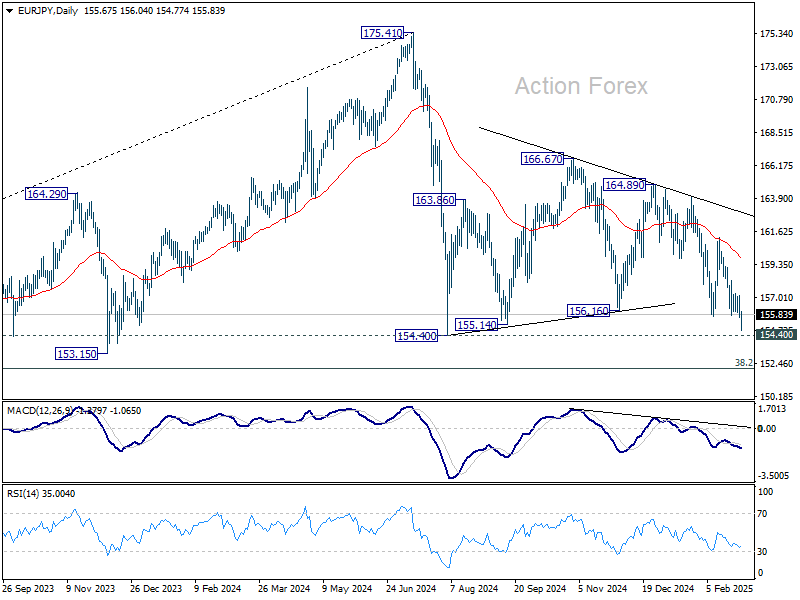
EUR/JPY Daily Outlook
Daily Pivots: (S1) 155.21; (P) 156.22; (R1) 156.77; More...
Intraday bias in EUR/JPY is back on the downside with break of 155.72 support, and deeper fall should be seen to 154.40 key support. Firm break there will confirm resumption of whole decline from 175.41 and target 152.11 fibonacci level next. On the upside, above 157.29 resistance will turn intraday bias neutral again first.
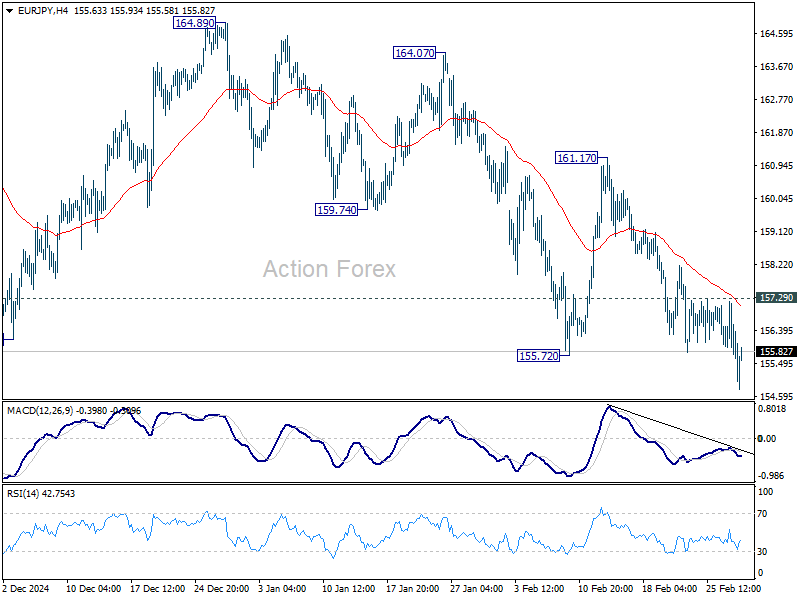
In the bigger picture, price actions from 175.41 are seen as correction to rally from 114.42 (2020 low). Strong support should be seen from 38.2% retracement of 114.42 to 175.41 at 152.11 to contain downside. However, sustained break of 152.11 will bring deeper fall even still as a correction. Next target will be 100% projection of 175.41 to 154.40 from 166.67 at 145.66.