
Sample Category Title
USD/JPY Mid-Day Outlook
Daily Pivots: (S1) 148.63; (P) 149.97; (R1) 150.83; More...
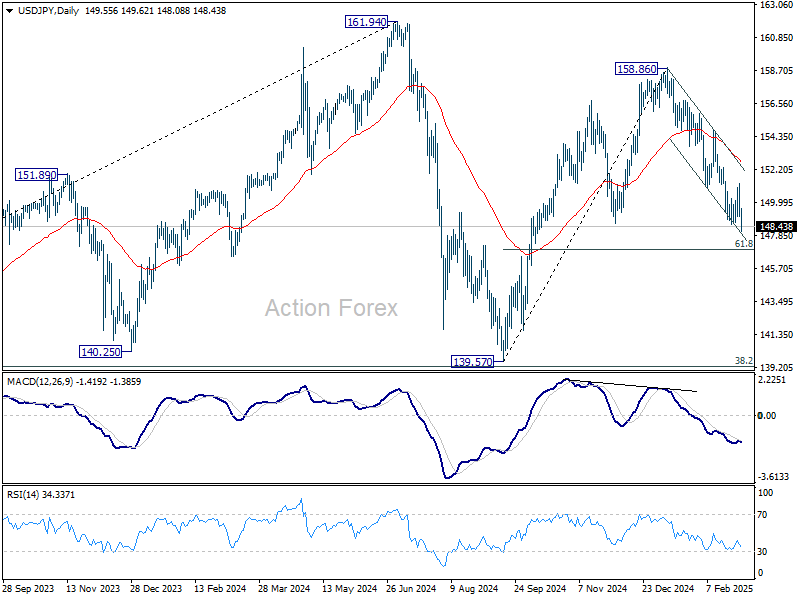
USD/JPY's fall from 158.86 resumed after brief consolidations and intraday bias is back on the downside. This decline is as the third leg of the corrective pattern from 161.94 high. Next target is 61.8% retracement of 139.57 to 158.86 at 146.32. Sustained break there will pave the way back to 139.57 low. For now, risk will remain on the downside as long as 151.29 resistance holds, in case of recovery.
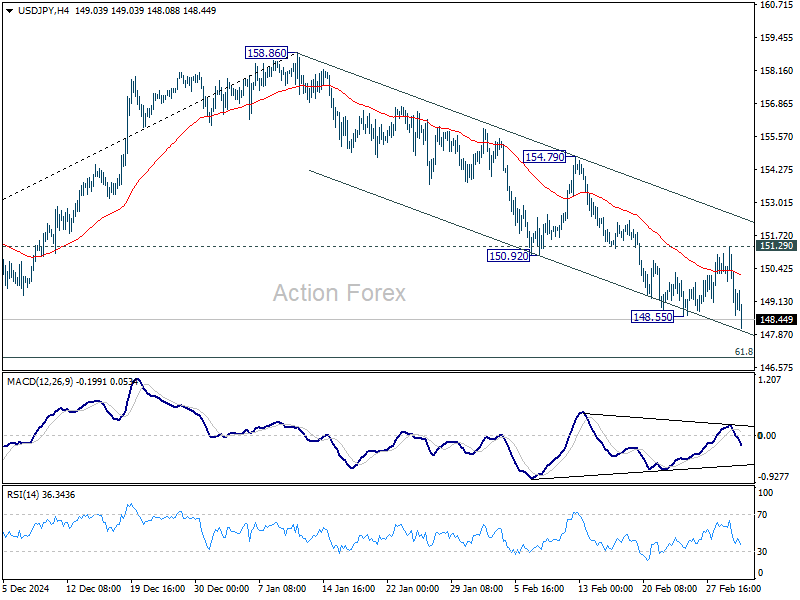
In the bigger picture, price actions from 161.94 are seen as a corrective pattern to rise from 102.58 (2021 low). In case of another fall, strong support should be seen from 38.2% retracement of 102.58 to 161.94 at 139.26 to bring rebound. However, sustained break of 139.26 would open up deeper medium term decline to 61.8% retracement at 125.25.
‘Trumpcession’ Concerns Drag Dollar Down, Fed Rate Cut Bets Surge
Dollar fell broadly today, an unusual development in contrast to recent rallies on escalating trade tensions and tariff announcements. Market sentiment soured as traders began to weigh the risks of a “Trumpcession,” a new term coined to describe the potential for US President Donald Trump’s policies to drive the economy into contraction or a full-blown recession.
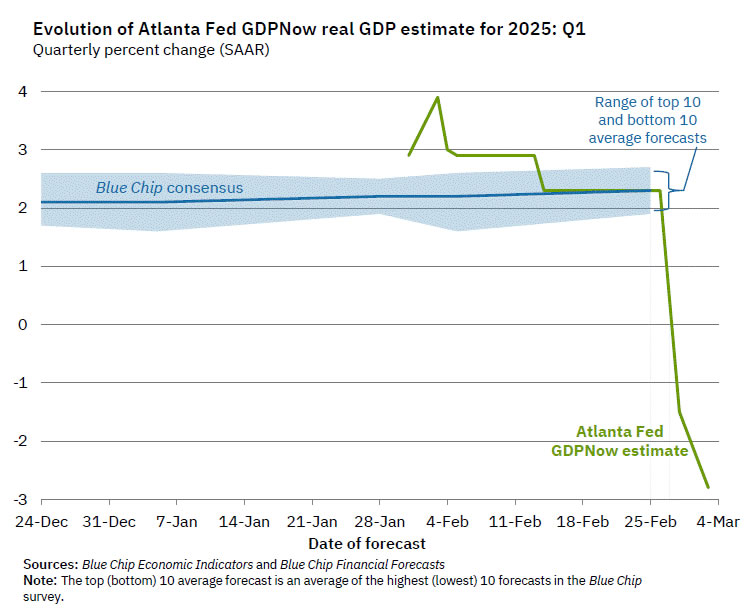
A major trigger for today’s shift in risk sentiment was the latest Atlanta Fed GDPNow estimate, which plummeted to -2.8% for Q1 2025, compared to -1.5% just days ago on February 28. This marks a dramatic deterioration in economic expectations, signaling that growth could already be already contracting at an alarming pace. Markets are increasingly recognizing that the tariff impact is not just theoretical—it is already weighing on consumption and business investment, and the effects could worsen in the coming months.
The first round of US tariffs officially took effect today, with a 25% levy imposed on Canada and Mexico, alongside a 20% additional tariff on Chinese imports. While this was expected, the concern now is the snowball effect. With more tariffs looming—including reciprocal tariffs set for April 2 and possible new levies on Japan and China for alleged currency devaluation.
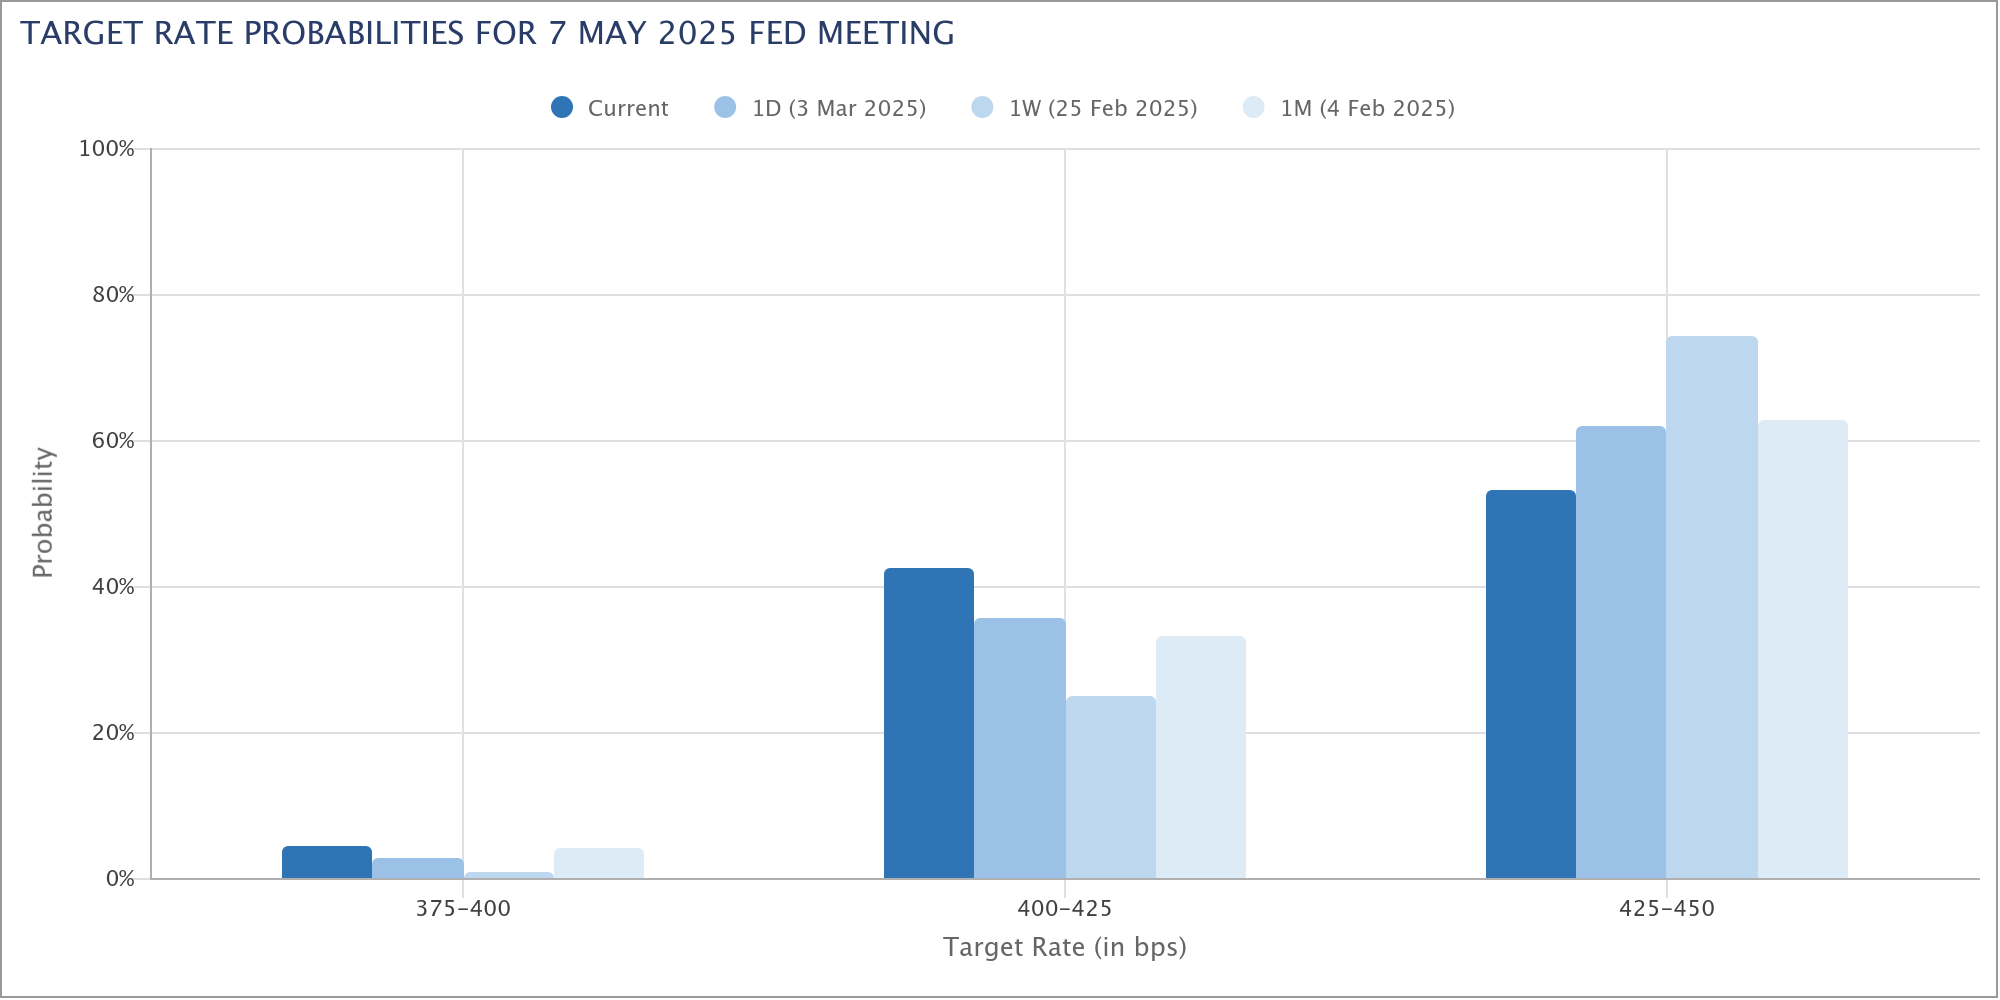
Market pricing for Fed rate cuts is accelerating too. Fed fund futures now assign a 47% probability of a rate cut in May, up from just 26% a week ago. If economic data continues to deteriorate, expectations could quickly rise above 50%, signaling that markets believe Fed will have little choice but to step in and resume monetary easing sooner than anticipated.
With overall sentiment on shakier ground, upcoming releases including tomorrow’s ISM services PMI and Friday’s non-farm payroll report have taken on added importance.
In the currency markets, Dollar is currently the worst performer of the day, followed by Aussie and Sterling. Meanwhile, Swiss Franc is leading gains, followed by Yen and Euro. Kiwi and Loonie are trading in the middle of the pack.
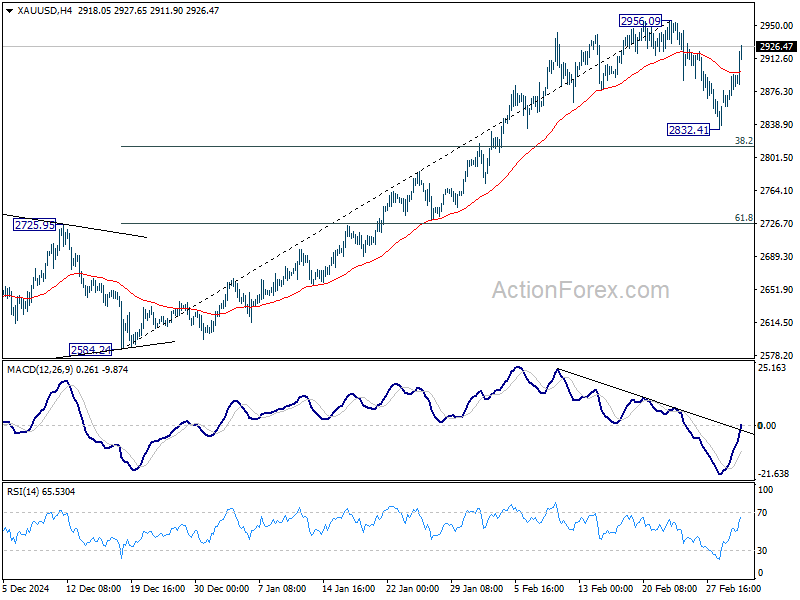
Technically, Gold reboounded strongly today following Dollar's selloff. The development suggests that pull back from 2956.09 is merely a near term correction, and has completed at 2832.41, ahead of 38.2% retracement of 2584.24 to 2956.09 at 2814.04. Retest of 2956.09 should be seen next and break there will resume larger up trend towards 3000 psychological level.
In Europe, at the time of writing, FTSE is down -0.75%. DAX is down -2.60%. CAC is down -1.68%. UK 10-year yield is down -0.068 at 4.444. Germanyu 10-year yield is down -0.027 at 2.466. Earlier in Asia, Nikkei fell -1.20%. Hong Kong HSI fell -0.20%. China Shanghai SSE rose 0.22%. Singapore Strait Times fell -0.28%. Japan 10-year JGB yield rose 0.018 to 1.428.
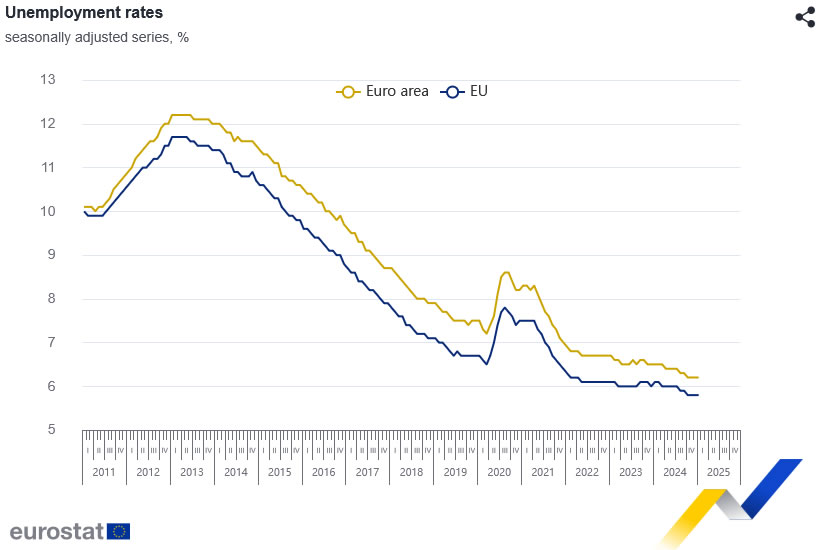
Eurozone unemployment rate unchanged at 6.2% in Jan
Eurozone unemployment rate was unchanged at 6.2% in January, coming in better than expectations of 6.3%. Across the broader EU, unemployment rate also held firm at 5.8%.
According to Eurostat, the number of unemployed individuals stood at 12.824 million in the EU, of which 10.655 million were in the Eurozone.
On a monthly basis, Eurozone unemployment fell by -42k, while the overall EU saw a more modest decline of -8k.
RBA minutes: No commitment to further rate cuts
The minutes from RBA’s February meeting reinforced the central bank’s cautious approach to monetary easing, making it clear that the recent 25bps rate cut to 4.10% does "not commit them to further reductions" in subsequent meetings.
Policymakers acknowledged that inflation has been falling at a “somewhat faster pace than expected,” which helped ease concerns over upside risks. However, they stressed that the path to returning inflation to target while maintaining labor market gains is “not yet assured.” The Board ultimately deemed that the stronger case was to ease policy, given the downside risks to the economy.
Despite the decision to cut, RBA members debated the risks of "easing policy too soon", recognizing that a premature policy shift could lead to resurgence in inflation.
They noted that if inflation proved “more persistent than expected,” holding the cash rate at 4.1% for an “extended period” or even tightening policy would be warranted.
Australia retail sales rises 0.3% mom, driving by food-related spending
Australia's retail sales turnover rose 0.3% mom to AUD 37.08B in January, matched expectations.
Robert Ewing, ABS head of business statistics, said: "While the pick-up in retail spending since mid-2024 has been boosted by more discretionary spending, this month’s rise is mostly driven by food-related spending."
USD/JPY Mid-Day Outlook
Daily Pivots: (S1) 148.63; (P) 149.97; (R1) 150.83; More...
USD/JPY's fall from 158.86 resumed after brief consolidations and intraday bias is back on the downside. This decline is as the third leg of the corrective pattern from 161.94 high. Next target is 61.8% retracement of 139.57 to 158.86 at 146.32. Sustained break there will pave the way back to 139.57 low. For now, risk will remain on the downside as long as 151.29 resistance holds, in case of recovery.
In the bigger picture, price actions from 161.94 are seen as a corrective pattern to rise from 102.58 (2021 low). In case of another fall, strong support should be seen from 38.2% retracement of 102.58 to 161.94 at 139.26 to bring rebound. However, sustained break of 139.26 would open up deeper medium term decline to 61.8% retracement at 125.25.
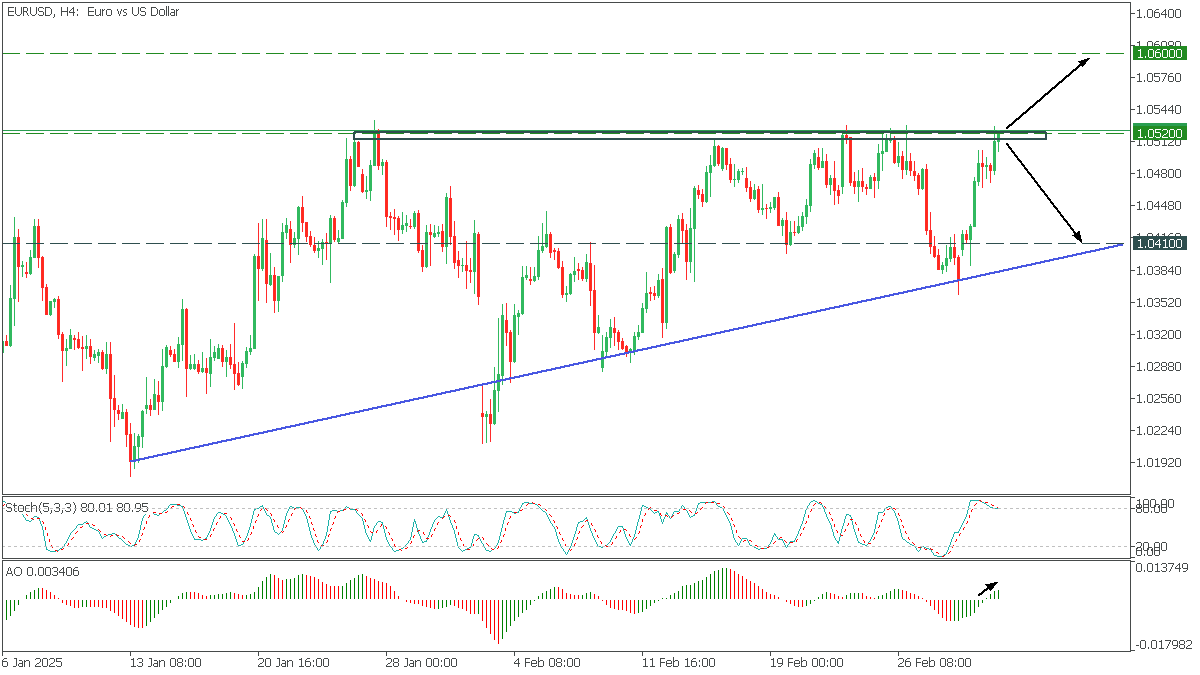
EURUSD: Rising triangle
EURUSD, H4
On the H4, EURUSD formed a rising triangle pattern, and the price reached the upper boundary. The AO confirms the growing bullish sentiment, but the Stochastic indicates the possibility of a decline.
- A break above 1.0520 will open the way to 1.0600;
- A rebound from the upper boundary will drop EURUSD to the lower trendline towards 1.0410;
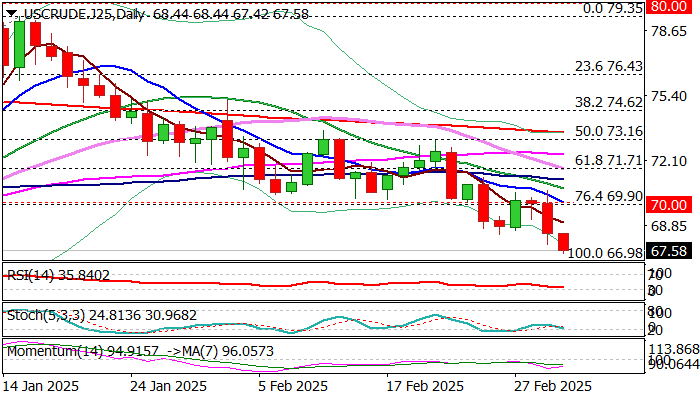
WTI: Crude Price Falls Further on Increased Output, Trade War Escalation
WTI Oil extends steep fall from Monday’s $70.58 lower top and hit the lowest in nearly three months on Tuesday.
A number of factors continue to weaken oil’s sentiment, with the latest decision of OPEC+ group to proceed with planned production increase, adding to growing uncertainty over escalation of trade war, as well as halt of US military aid to Ukraine.
Markets anticipate that economic slowdown in deepening trade conflict would significantly impact demand, while supply is expected to continue to rise and that would further weigh on oil prices.
Bearish technical picture on daily chart contribute to negative outlook, with recent break through significant supports at $70/$69.90 (psychological / Fibo 76.4% of $66.98/$79.35 rally) and multiple recovery rejections at this zone, before bears regained control, have generated strong bearish signal.
Upticks on partial profit-taking are likely to be limited and stay under $69.70/$70, now acting as solid resistances and reinforced by falling 10DMA, to keep larger bearish structure intact and offer better selling opportunities.
Res: 68.37; 69.00; 70.00; 70.58.
Sup: 67.42; 66.98; 66.54; 65.26.
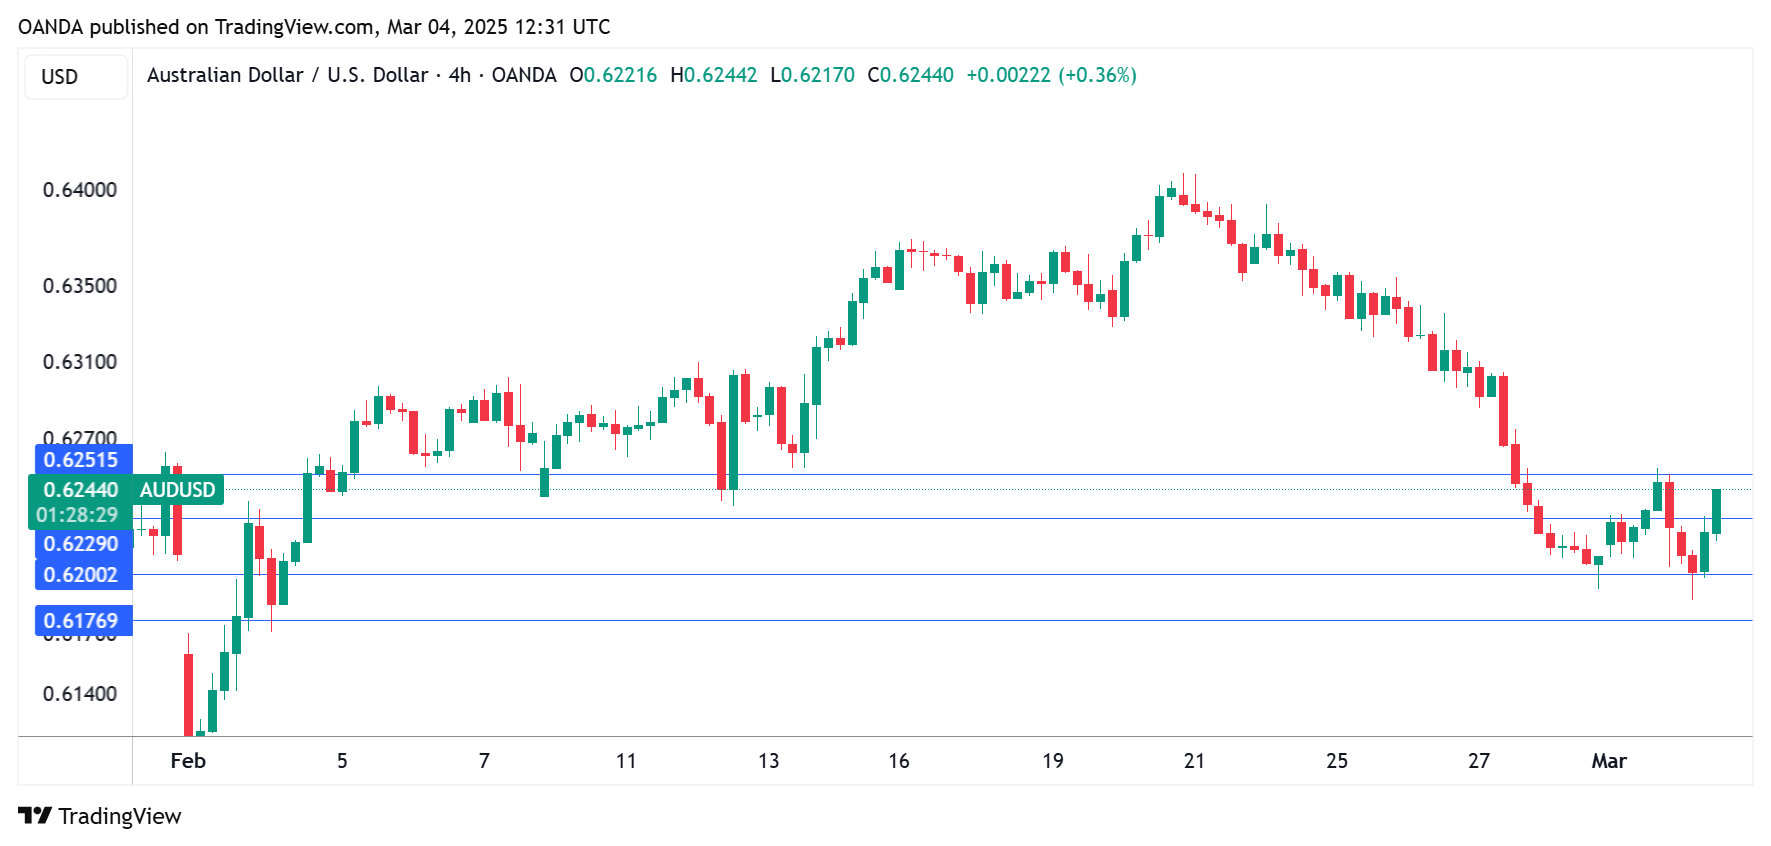
RBA Minutes Hawkish, Aussie Edges Higher
The Australian dollar has edged higher on Tuesday. AUD/USD is trading at 0.6243 in the European session, up 0.28% on the day.
RBA minutes: Don’t count on more cuts
The Reserve Bank of Australia’s minutes from the February meeting reiterated the central bank’s cautious stance. The meeting marked a milestone as the RBA pressed the rate-cut trigger for the first time in four years, after maintaining the cash rate at 4.35% for over a year. The decision was a “hawkish cut” with a message for the markets not to expect a series of rate cuts.
In the minutes, members said the rate cut did not “commit them to further rate cuts”, a warning that the easing cycle could be short. The RBA remains concerned about inflation even though it has dropped to 2.4%, in the mid-range of the RBA’s target band of 2%-3%. Governor Bullock has said that the RBA is keeping a close eye on the labor market, which has been resilient and not supportive of further rate cuts.
Another headache for the RBA is the threat of US tariffs, in particular the specter of another US-China trade war. Both countries have imposed new tariffs on the other, and a damaging trade war would hurt Australia’s export industry, as China is Australia’s largest trading partner.
Australian retail sales rebound
Australia’s retail sales posted a turnaround in January, with a gain of 0.3% m/m. This matched the market estimate and followed the 0.1% decline in December. The driver of the gain was food-related spending and most sub-categories showed an increase in spending. The outlook for consumer spending has improved, with the RBA rate cut, the drop in inflation and cuts to income tax.
AUD/USD Technical
- AUD/USD is testing resistance at 0.6228. Above, there is resistance at 0.6251
- 0.6200 and 0.6177 are providing support
Crypto Could Not Hold Up
Market Picture
Pressure in traditional markets has clipped the wings of the crypto market, which is almost back to the point from which Sunday’s rally started. At the start of the day on Tuesday, it was capitalised at $2.76 trillion, having lost over 9% in the last 24 hours. The market fell under the 200-day average on increased momentum, and an attempt to rebound failed even with the help of cryptocurrency news.
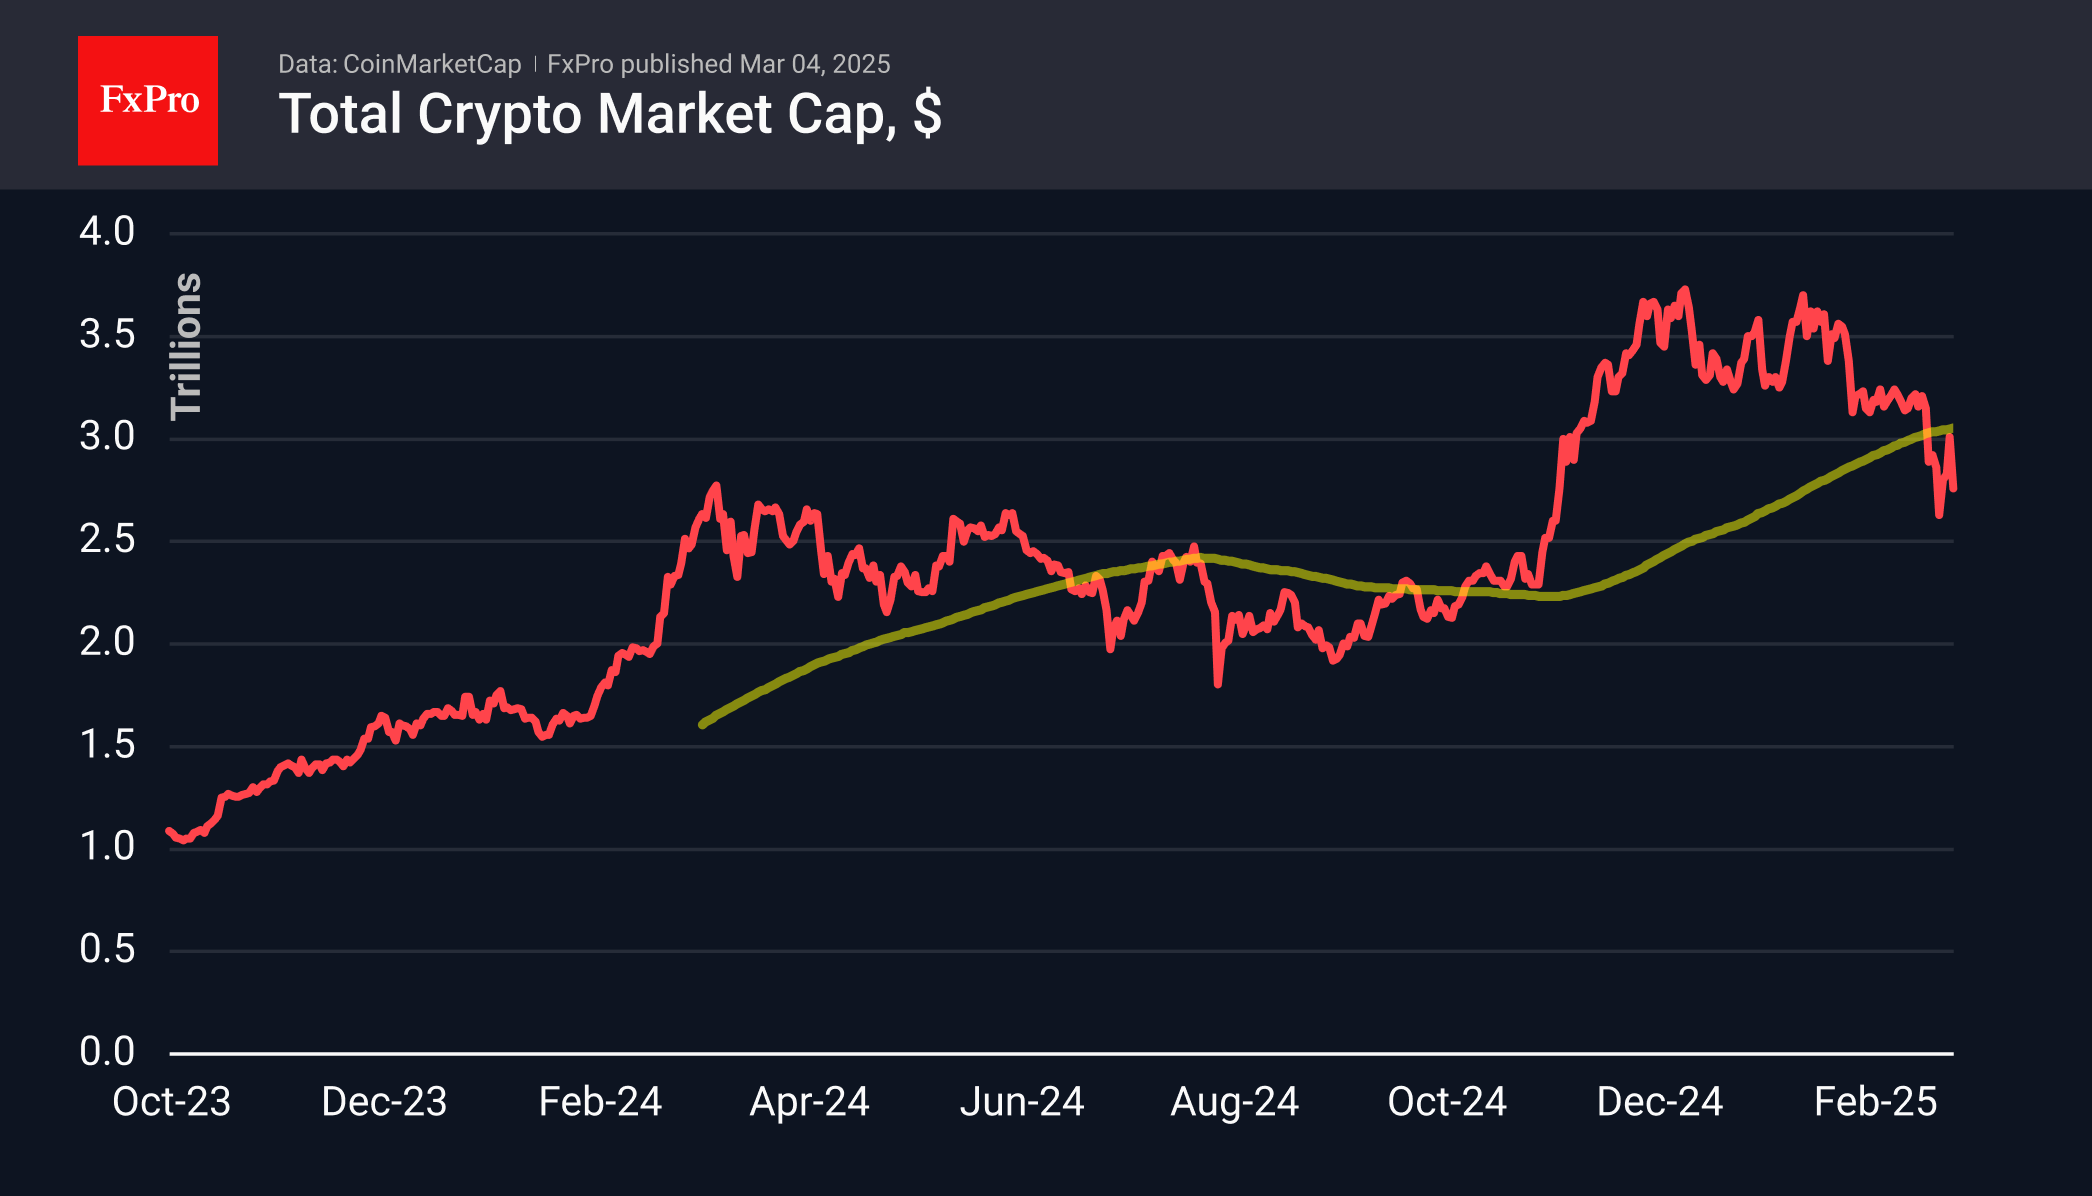
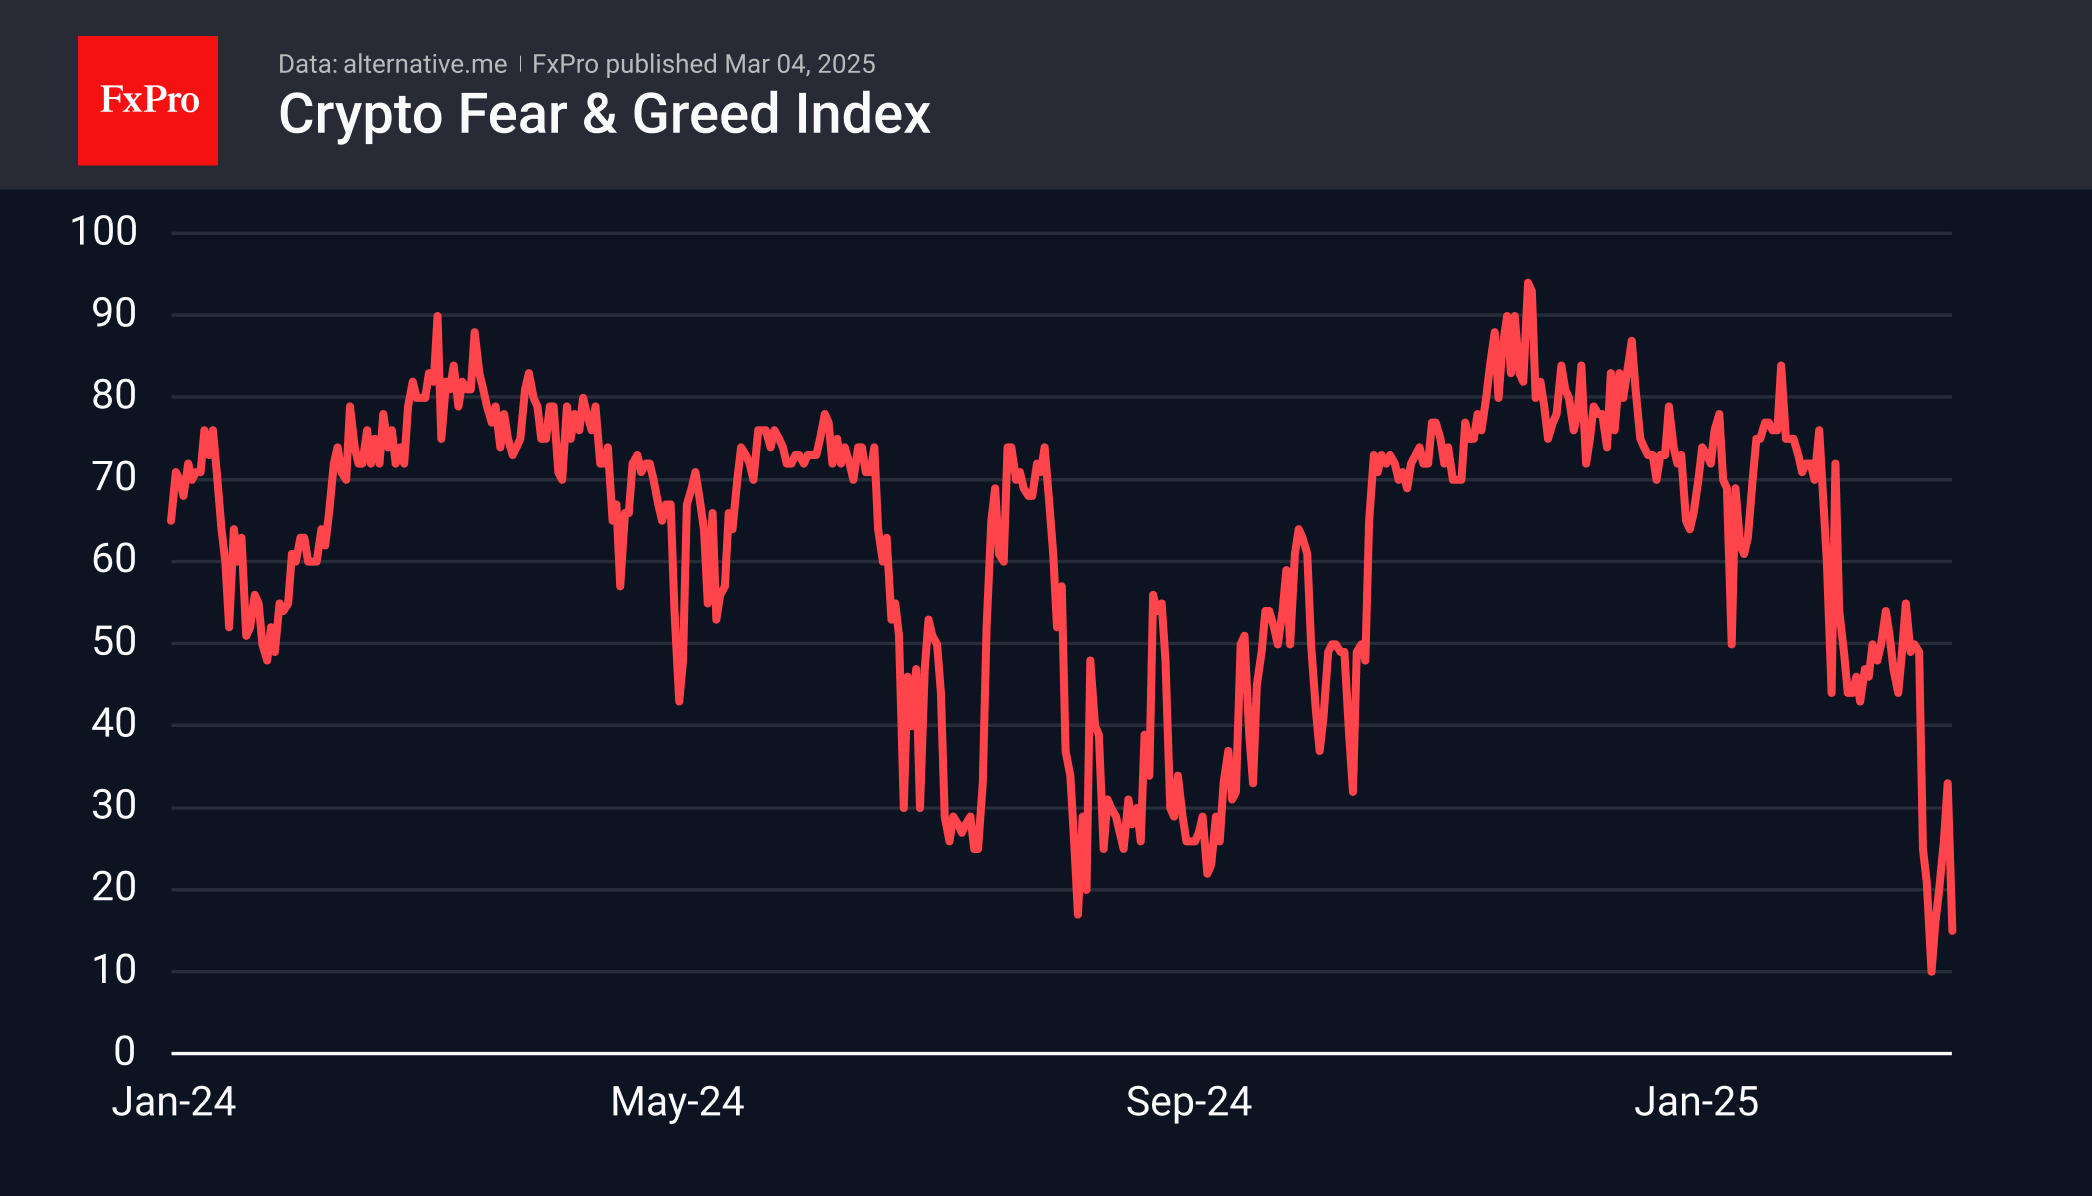
Sentiment in the cryptocurrency market has returned to extreme fear territory, to the 15 level – the second lowest level after 27 February in more than two and a half years.
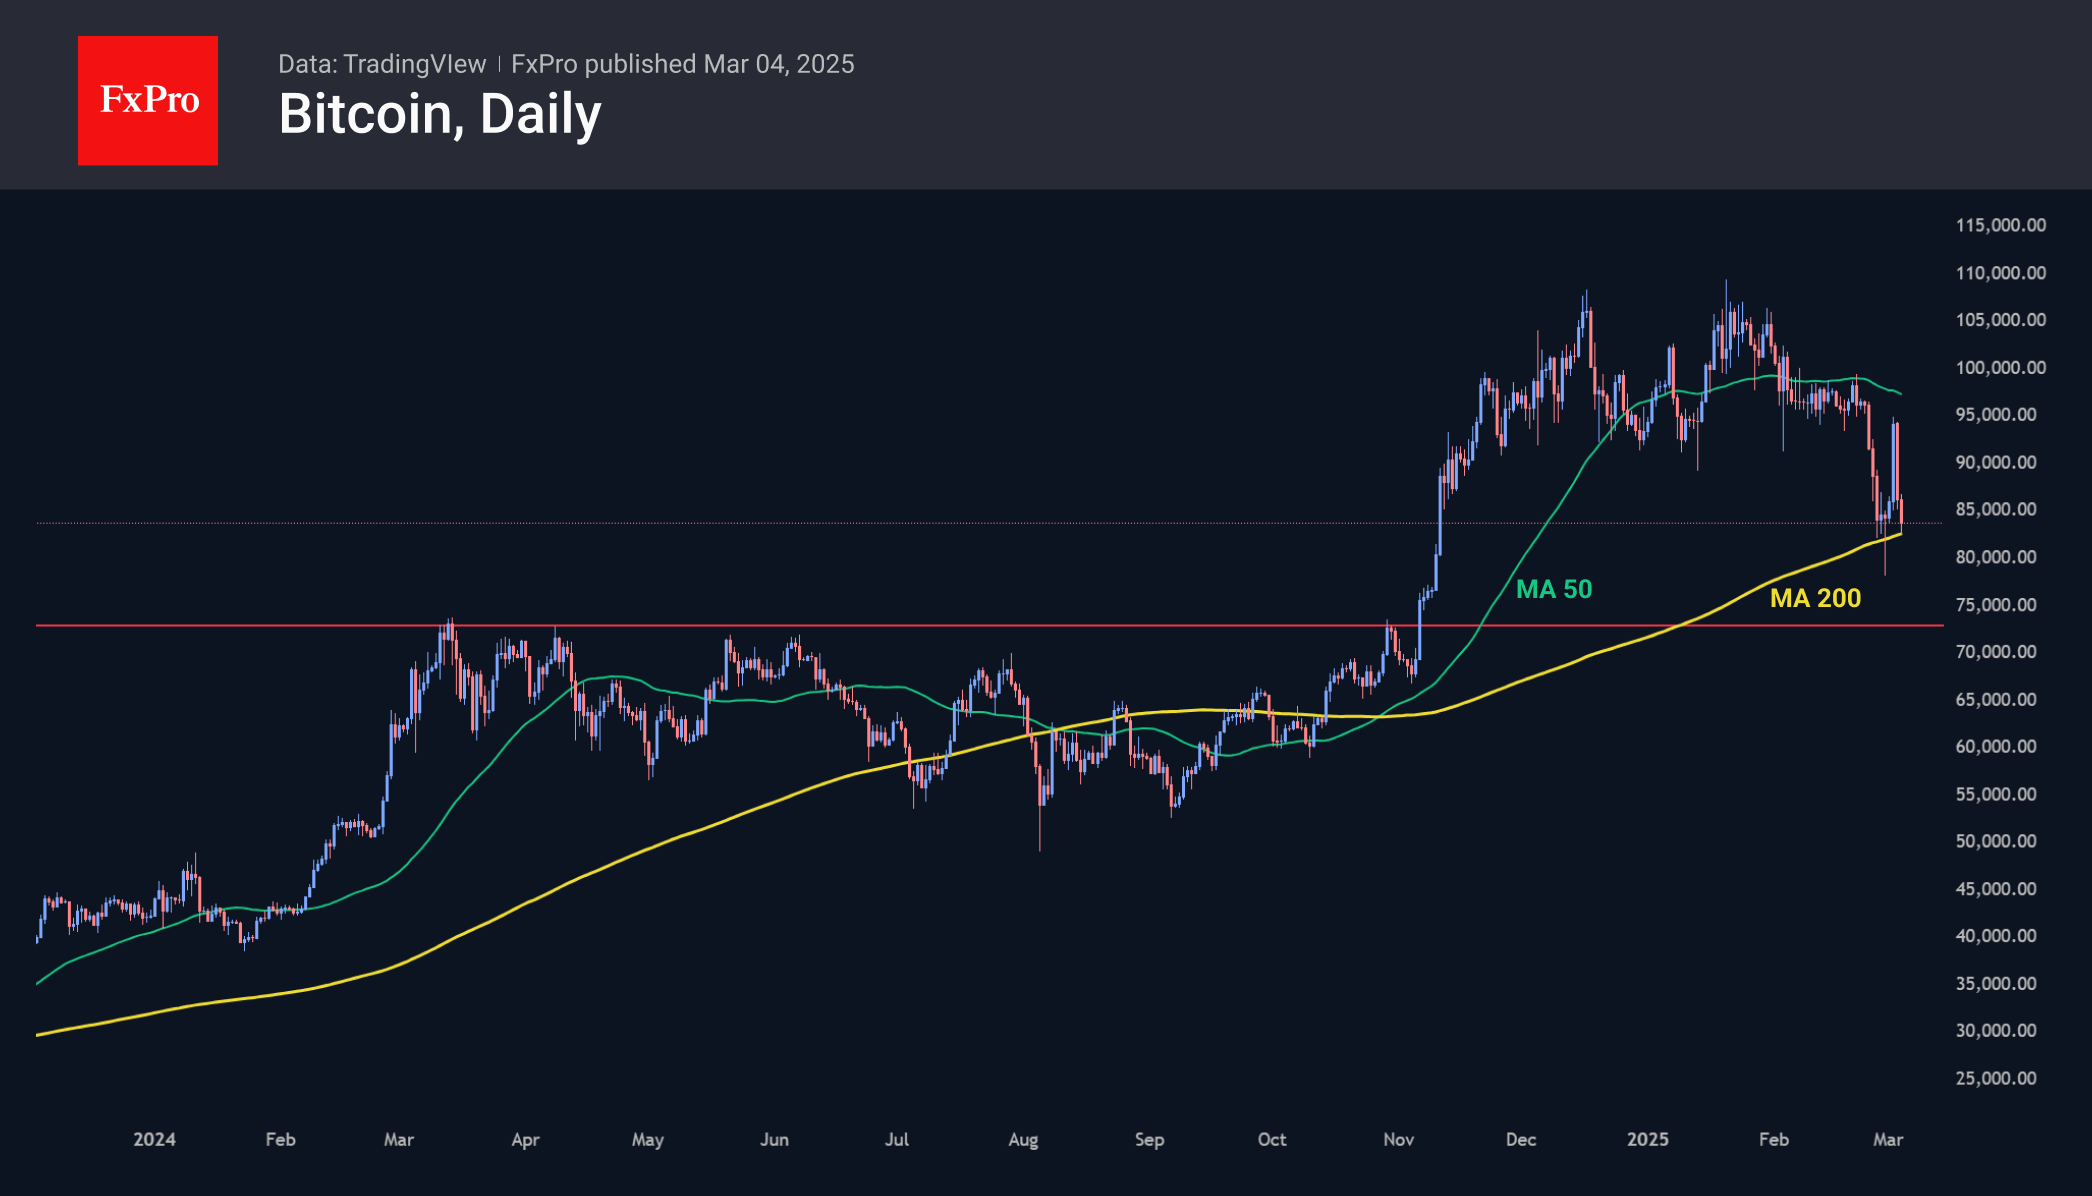
Bitcoin has lost 9.5% over the past 24 hours to levels below $83.3K. It continues to flounder between the 50- and 200-day moving averages but is dangerously assessing the latter this week. A failure below formally triggers a bearish scenario, with the potential next stop in the $70-72K area. That said, it is clear how uncomfortable this decline is for the current administration, and it may go for new industry proposals to support sentiment.
News Background
According to CoinShares, global crypto fund investments fell by a record $2.911 billion last week. Bitcoin investments were down by $2.598 billion, Ethereum by $300 million, and Solana by $7 million. Sui investments were up by $16 million, and XRP by $5 million.
CoinShares suggests that several factors, including the recent Bybit hack and the preceding 19-week streak of $29bn, influenced this trend. These factors have led to profit-taking and weakened sentiment towards this asset class.
Mint Ventures draws attention to the significant sponsorship that the companies behind XRP, SOL and ADA gave Trump before and after the election. However, this absurd approach could further reduce the likelihood of a relevant bill being passed at the federal level.
Bitcoin is not suitable for inclusion in government reserves because cryptocurrencies lack stability, liquidity and security, Swiss National Bank Governor Martin Schlegel said.
A US court dismissed the SEC’s lawsuit against Richard Hart, founder of HEX, PulseChain, and PulseX. The regulator accused Hart of raising more than $1bn through unregistered cryptocurrency offerings through the HEX, PulseChain, and PulseX projects.
Eurozone unemployment rate unchanged at 6.2% in Jan
Eurozone unemployment rate was unchanged at 6.2% in January, coming in better than expectations of 6.3%. Across the broader EU, unemployment rate also held firm at 5.8%.
According to Eurostat, the number of unemployed individuals stood at 12.824 million in the EU, of which 10.655 million were in the Eurozone.
On a monthly basis, Eurozone unemployment fell by -42k, while the overall EU saw a more modest decline of -8k.
Brent Crude Price Breaks Key Support Level
Today, Brent crude is sliding towards the psychological $70 per barrel mark, with the XBR/USD chart showing a break below a key support level (marked in blue) that had been holding since autumn last year.
Why Is Brent Crude Falling?
The bearish sentiment in the market is driven by OPEC+’s decision to increase oil production, contrary to analysts’ expectations that existing output cuts—designed to support prices—would remain in place.
According to the Wall Street Journal, analysts now predict:
→ Oil production will rise by 137,000 barrels per day from April 2025 to September 2026.
→ Brent crude may drop below $70 per barrel.
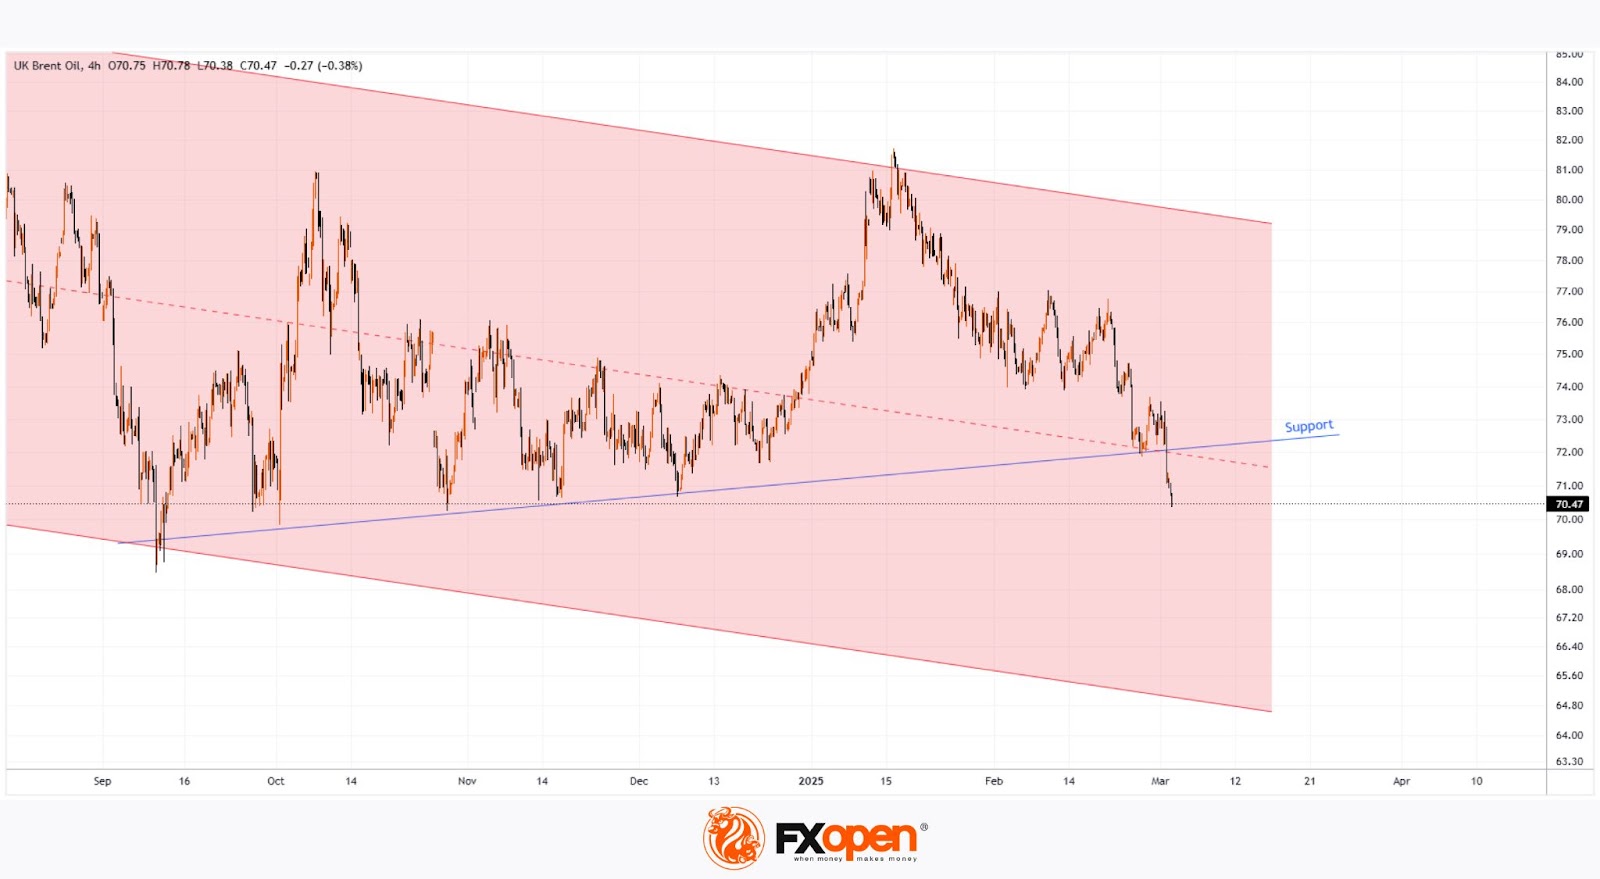
Technical Analysis of XBR/USD
From a long-term perspective, Brent crude is forming a descending channel (marked in red), connecting the April and July 2024 peaks. The break below this support level could signal a renewed downtrend following a prolonged period of consolidation.
If XBR/USD sees a short-term recovery from its yearly lows, key resistance levels to watch include:
→ The midline of the descending channel.
→ The former support level (marked in blue).
Start trading commodity CFDs with tight spreads. Open your trading account now or learn more about trading commodity CFDs with FXOpen.
This article represents the opinion of the Companies operating under the FXOpen brand only. It is not to be construed as an offer, solicitation, or recommendation with respect to products and services provided by the Companies operating under the FXOpen brand, nor is it to be considered financial advice.
Nikkei 225 Outlook: Negative Sentiment Overshadows Positive Fundamentals
- Nikkei 225 broke below its 200-day moving average and a four-month range configuration.
- US President Trump’s trade war 2.0 against major trading partners triggered a negative feedback loop in Japanese equities due to potential disruption in semiconductor supply chains.
- Positive fundamentals in the Japanese economy are likely to support the major uptrend phase of the Nikkei 225.
- In the medium-term, negative sentiment may take a foothold in the Nikkei 225 with a risk of further corrective decline below 38,520 key medium-term resistance.
Last week, the Japanese benchmark stock index, Nikkei 225, broke below its four-month range support of 37,810 and recorded a weekly loss of 4.2%, its worst performance since early September 2024.
The recent dismal performance of Japanese equities has been driven by negative sentiment towards US President Trump’s upcoming tariffs threat to impose 25% duties on Canadian and Mexican goods as well as an extra 10% levy on Chinese imports with effect from Tuesday, 4 March.
Fundamentals are still on a firm footing
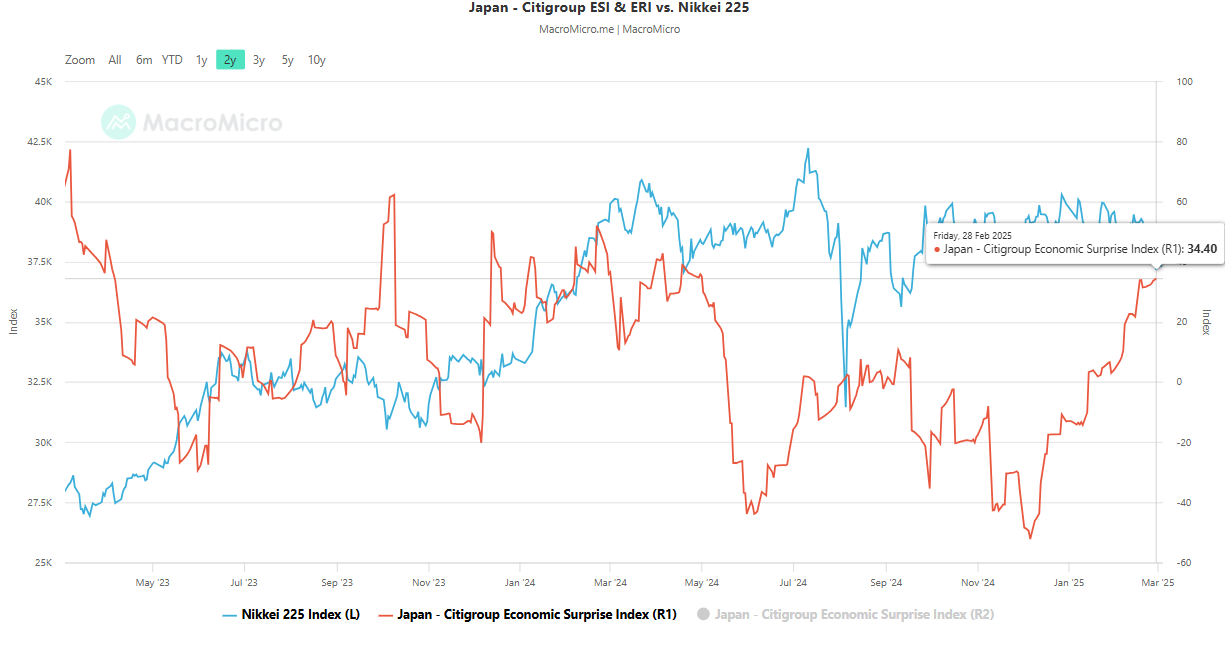
Fig 1: Citigroup Japan Economic Surprise Index as of 28 Feb 2025 (Source: MacroMicro, click to enlarge chart)
In contrast, several key leading economic indicators of the Japanese economy have exceeded expectations in December and January, such as wage growth, services PMI, inflation trend, and household spending.
The Citigroup Japan Economic Surprise Index can be used as a leading gauge to track the improvements of key economic data, which is the sum of the difference between the actual value of various data and their consensus forecast. If the index value is more than zero, it suggests that the overall economic condition in Japan is generally better than expected, and vice versa when the Index value falls below zero.
The Citigroup Japan Economic Surprise Index has trended upward steadily in the past two months since hitting a trough on 6 December 2024, with a value of -52.20 to 34.40 as of 28 February, its highest level in ten months. The upward trend represents an improvement in economic growth in Japan (see Fig 1).
An increase in buying interest from institutional and retail investors
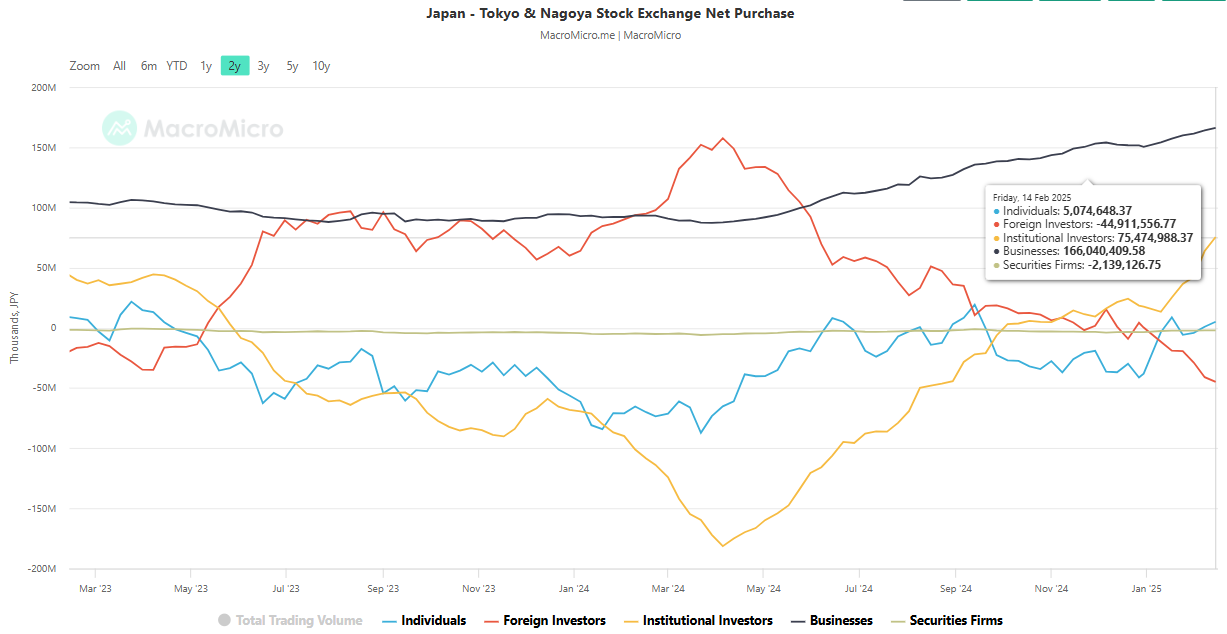
Fig 2: 52-week average net purchases of Japanese equities from various types of market participants as of 14 Feb 2025 (Source: MacroMicro, click to enlarge chart)
Based on data from the Tokyo and Nagoya stock exchanges, the 52-week average of net purchases of Japanese stocks from foreign investors has fallen significantly since early December 2024 to a net sold amount of -44,911,557 as of 14 February (see Fig 2).
On the flip side, the decrease in net purchases from foreign investors is offset by an increase in net purchases from institutional investors (from 16,088,440 to 75,474,988) and retail/individual investors (from -36,338,830 to 5,074,648).
Negative sentiment is taking centre stage in Nikkei 225
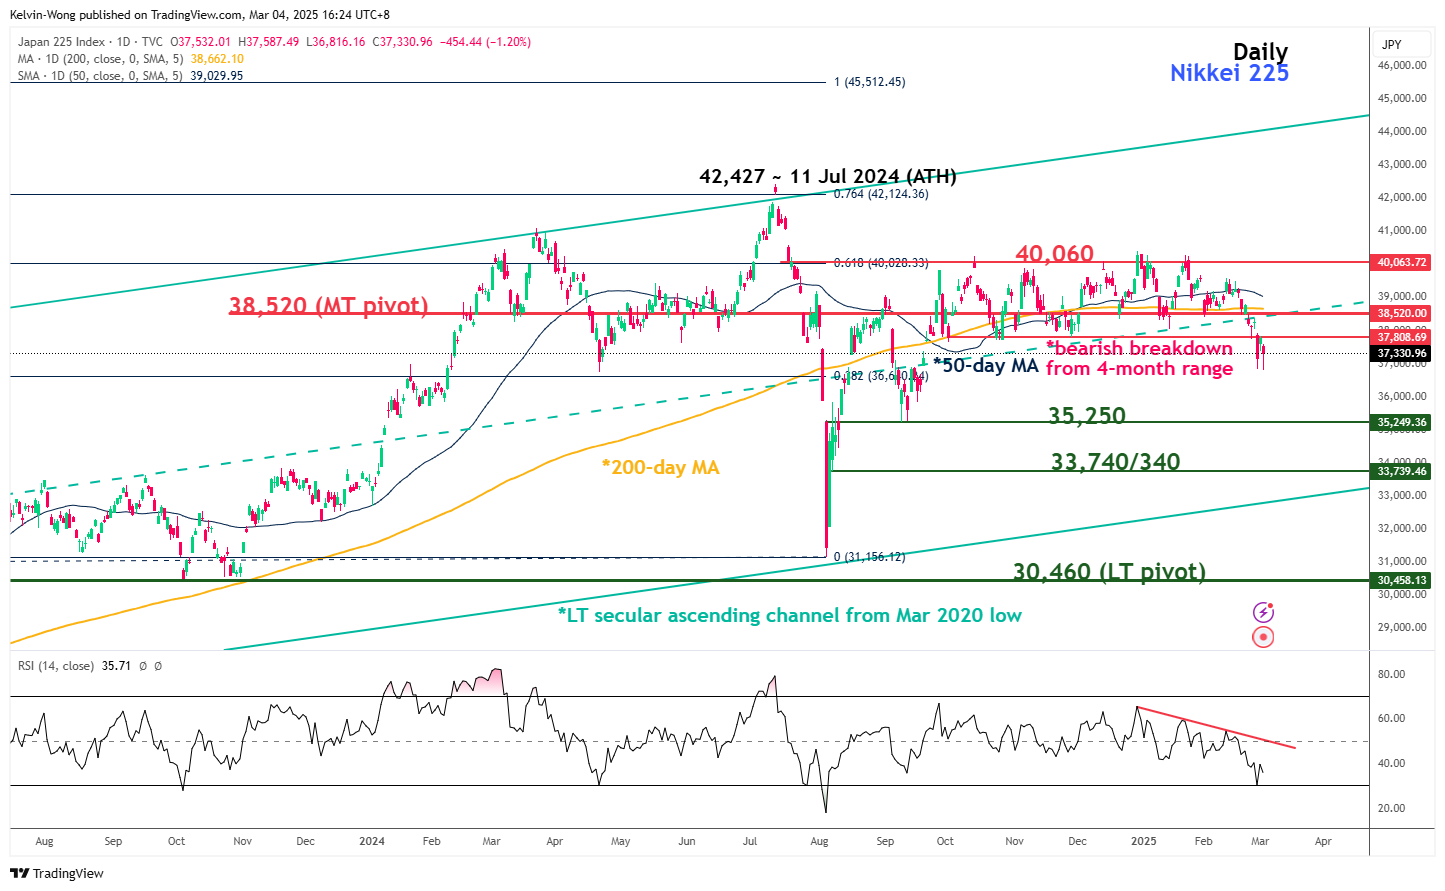
Fig 3: Nikkei 225 medium-term & major trends as of 4 Mar 2025 (Source: MacroMicro, click to enlarge chart)
The price actions of the Nikkei 225 are not moving in a similar positive trend of the improved fundamentals of the Japanese economy but instead moving in tandem with sentiment factors that have turned bearish since last Tuesday, 25 February.
The Nikkei 225 has broken below its 200-day moving average, now acting as key medium-term pivotal resistance at 38,520. In addition, the condition of the daily RSI momentum indicator remains bearish as it has not hit its oversold level (see Fig 3).
In the lens of the technical analysis, the Nikkei 225 has staged a medium-term bearish breakdown from a prior four-month range configuration that was in place since late September 2024.
Further potential weakness may be in store to expose the next medium-term supports at 35,250 and 33,740/340 (also the lower boundary of the long-term secular ascending channel from March 2020 low).
However, a clearance above 38,520 invalidates the bearish scenario for a retest at the 40,060 medium-term range resistance.
GBP/JPY Daily Outlook
Daily Pivots: (S1) 188.49; (P) 190.23; (R1) 191.65; More...
Range trading continues in GBP/JPY and intraday bias stays neutral. Further decline is in favor as long as 193.04 resistance holds. On the downside, firm break of 187.04 will extend the fall from 199.79 towards 180.00 support. That will also raise the chance that correction from 208.09 is resuming downward.
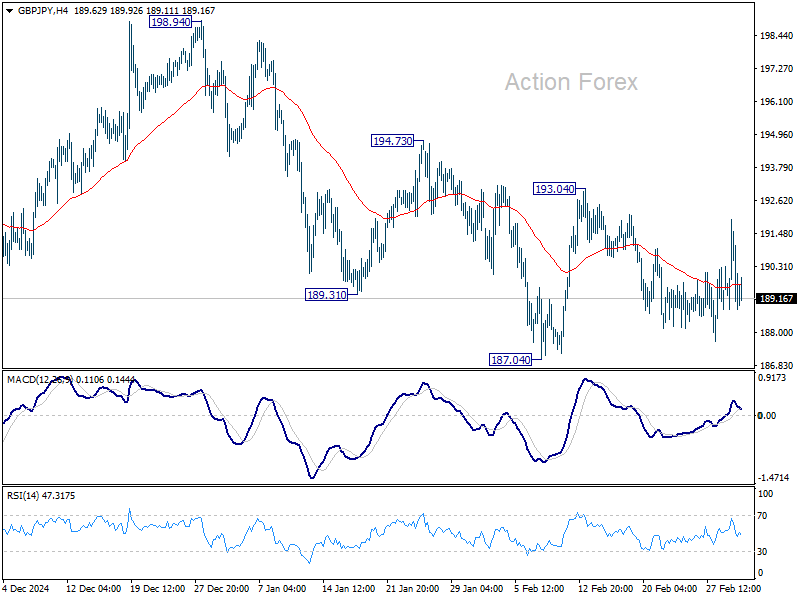
In the bigger picture, price actions from 208.09 are seen as a correction to rally from 123.94 (2020 low). Strong support should be seen from 38.2% retracement of 123.94 to 208.09 at 175.94 to contain downside. However, sustained break of 152.11 will bring deeper fall even still as a correction.
