
Sample Category Title
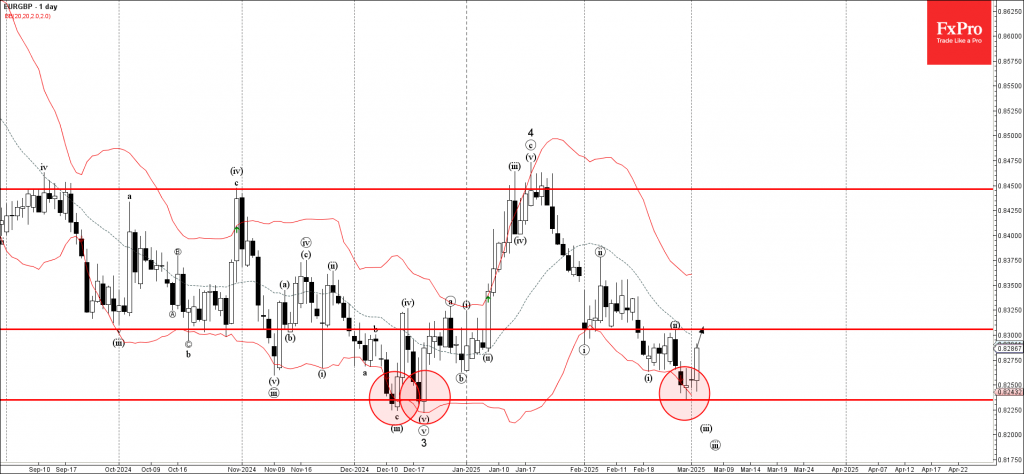
EURGBP Wave Analysis
- EURGBP reversed from support area
- Likely to rise to resistance level 0.8300
EURGBP currency pair recently reversed from the support area set between the multi-month support level 0.8235 (which created the Double Bottom in December) and the lower daily Bollinger Band.
The upward reversal from this support zone created the daily Japanese candlesticks reversal pattern Doji which signalled the strength of this support area.
Given the strength of the support level 0.8235 and the strongly bullish euro sentiment seen today, EURGBP can be expected to rise to the next resistance level 0.8300 (top of the previous correction ii).
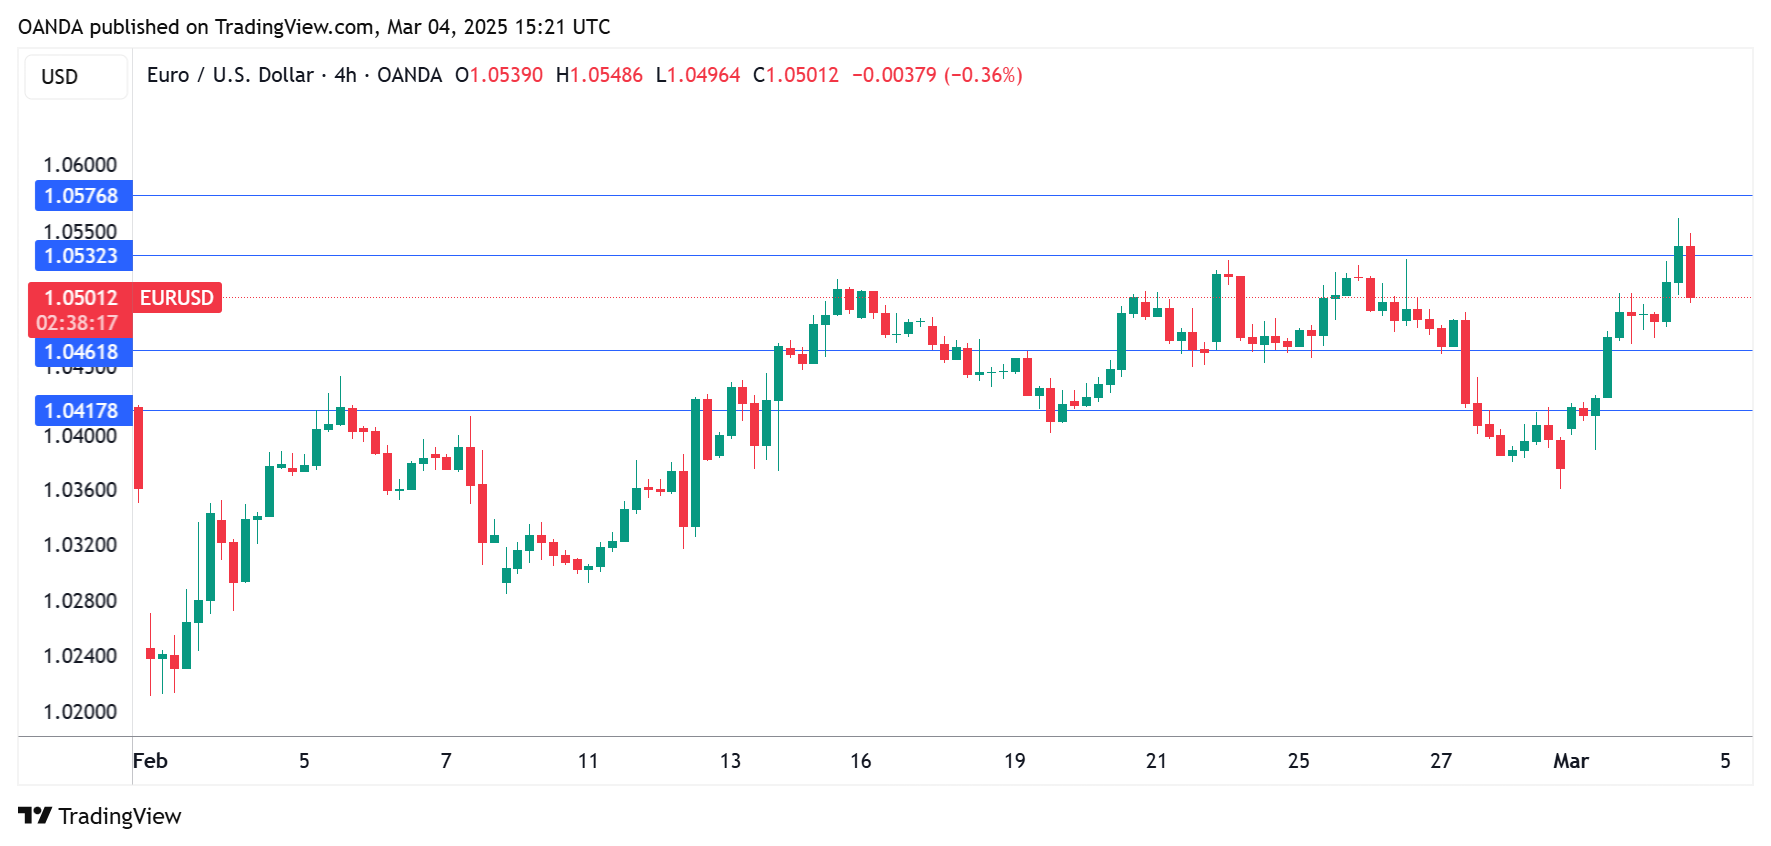
EURUSD Rises to New 2025 High as Dovish Fed Deflates Dollar
Fresh bullish acceleration extends into second consecutive day and pushed EURUSD to new 2025 high (1.0559) on Tuesday.
Weaker dollar on dovish shift in monetary policy outlook, as US Treasury Secretary signaled stronger policy easing, after a series of weak US economic data, with markets pricing in three 25 bp cuts this year, was the main driver of the single currency
Little help for dollar was seen on anticipated safe haven demand after the USA imposed new tariffs.
On the other hand, the Euro received boost from signals that the bloc is working on increase of spending on defense, which may provide some support to economic growth.
Bulls cracked pivotal barriers at 1.0533/29 (recent range tops) and pressure another key resistance at 1.0573 (Fibo 38.2% of 1.1214/1.0177 downtrend) but need a clear break above this zone to signal an end of sideways phase and bullish continuation.
Technical picture on daily chart is overall positive, as bullish momentum is strengthening and rising Tenkan and Kijun-sen are diverging after formation of bull-cross.
However, closing above cracked 100DMA (1.0517) is minimum requirement to keep fresh bulls in play and focus shifted to the upside.
Markets focus on important economic releases in coming days – EU February Services PMI, ECB interest rate decision (25bp cut is expected) and US NFP.
Res: 1.0559; 1.0573; 1.0630; 1.0695
Sup: 1.0471; 1.0426; 1.0395; 1.0360
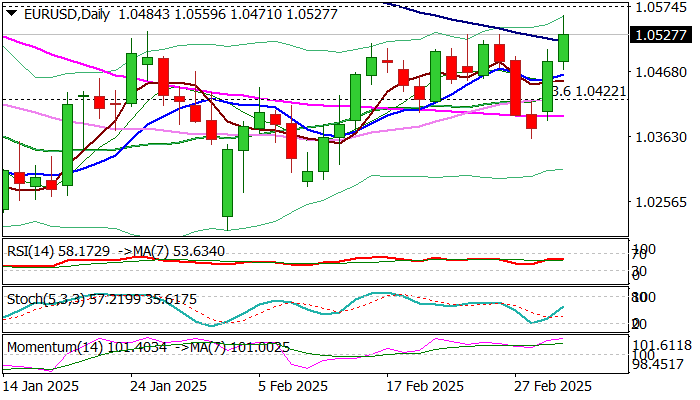
Euro Hits Three-Month High, Eurozone Unemployment Rate Unchanged
The euro has extended its gains on Tuesday. EUR/USD is trading at 1.0523 in the North American session, up 0.36% on the day. Earlier, the euro rose as high as 1.0559, its highest level since December 10.
Eurozone unemployment remains at 6.2%
The eurozone economy is sputtering but there’s nothing wrong with the employment picture. The unemployment rate remained at 6.2% for a third straight month in January, a record low. The December reading was revised downwards from 6.3%. Germany, the largest economy in the bloc, is yet to recover but unemployment is just 3.5%, the lowest in the eurozone. As well, the employment rate rose to 71.7%, its highest level in 20 years.
For the European Central Bank, inflation remains the key driver of rate decisions. In February, headline inflation dipped to 2.4% and the core rate eased to 2.6%, but both readings were higher than expected. Services inflation has been sticky and fell to 3.7% from 3.9%. Inflation remains above the ECB’s target of 2% and the February numbers could complicate the ECB’s plans to continue lowering rates. The euro responded to this sentiment which huge gains of 1% on Monday.
The ECB meets next on March 6 is widely expected to lower rates by a quarter-point, which would bring the cash rate to 2.50%. What happens after March isn’t clear and which direction inflation takes will be a crucial factor in the ECB’s rate path. Another headache for the ECB is US tariffs. The Trump administration is yet to impose tariffs on EU products but has threatened to hit the bloc with 25% on European cars and other goods. EU officials have promised to retaliate with counter-tariffs and the specter of a full-blown trade war between the US and EU will damage both economies.
EUR/USD Technical
- EUR/USD tested resistance at 1.0483 earlier. Above, there is resistance at 1.0576
- 1.0461 and 1.0417 are the next support lines
Sunset Market Commentary
Markets
There’s little left from yesterday’s (European) stock market optimism. US President Trump personally pulled the EuroStoxx50 off an all-time high by pausing all US military aid to Ukraine until he is convinced about Ukrainian president Zelensky’s intentions toward peace negotiations with Russia. The White House didn’t specify any conditions for the US to resume its military aid. The EU was already on a fast-track towards increased defense spending after Friday’s collapsed talks between Trump and Zelensky with EC von der Leyen speeding up to timeline further today ahead of Thursday’s EU Council dedicated to defense and Ukraine. She today proposed a Rearm Europe Plan. In a letter to EU leaders, she outlines five potential measures to massively boost defense spending, both to respond to the short-term urgency to act and to support Ukraine, but also to address the long-term need to take on more responsibility for our own European security. They include a new €150bn loan instrument to finance joint defense investments and €650bn from individual member states increasing defense spending by 1.5% of GDP on average and for which fiscal discipline rules will be once again lifted. Von der Leyen’s press conference unfortunately failed to lift market spirits. Party pooper Trump’s second folly came from pushing through with 25% tariffs against Canada and Mexico and raising the level for China from 10% to 20%. China and Canada immediately retaliated with Mexico joining on Sunday. The escalation extends market worries that the Tariff Man will in the short term raise inflationary pressures and in the mid-to-long run pull the US economy into recession. Prepare for more fireworks tonight as he addresses a joint session of US Congress for a first time in his second term. Today’s empty eco calendar and lack of central bank talk left markets vulnerable to this explosive geopolitical situation. Key European indices lost 2.5% on average. The front end of European bond curves outperforms as investors pour back into ECB April rate cut bets. Front end yields lose around 5 bps. The (very) long end trades flat given the avalanche of fiscal stimulus ahead of us. The dollar remains vulnerable to the US recession narrative with EUR/USD taking out the previous YTD top at 1.0533 and testing 38% retracement (1.0551) on the September to February decline in EUR/USD. US Treasury yields cede up to 6 bps at the front end with US money markets again fully discounting three additional 25 bps Fed rate cuts this year. Oil prices extend their drop after yesterday’s surprise OPEC+ production cut reversal announcement with Brent crude testing $70/b support.
The Kingdom of Belgium launched a now long 15y OLO via syndication (Jun2042). Order books ended above €37bn, allowing the debt agency to print €5bn at 8 bps over the Belgian OLO curve compared with guidance in the OLO + 10 bps area. They now raised €16.39bn YtD compared with a €42bn OLO funding need to cover the lion share of the €44.65bn gross borrowing requirement. One final syndicated deal (5y) is expected later this year.
News & Views
The Hungarian central bank’s new leadership sees no room to cut policy rates from the current 6.5%, Bloomberg reported today citing sources. Mihaly Varga, the former finance minister to prime minister Orban, took over from Gyorgy Matolcsy starting today. Varga himself in his first comments to Bloomberg said “The central bank supports sustainable economic growth by keeping inflation sustainably low and by guarding financial-market stability”. According to the people tapped by the news agency this translates into an even longer rates status quo, adding that he is committed to tackle inflation and doesn’t plan to conduct monetary policy in such a way that it would weaken the forint. Hungarian inflation rose to a 13-month high of 5.5% in January, well above the central bank’s 3% target. The Hungarian forint briefly strengthened to the highest level against the euro since early October. EUR/HUF remains near the 400 support barrier though. Hungarian swap rates swapped earlier losses for 3 bps gains.
The Japanese yen trades strong today. USD/JPY broke below 150 yesterday and extends losses to the lowest level since October of last year. Aside from the current risk-off, it was US President Trump who sparked the recent two-day JPY appreciation with his first comments since taking office on Japan. He accused the country of having an unfair advantage through its FX policy. Trump said something similar about the Chinese yuan. Believing the Chinese authorities will either partially or fully comply to Trump’s demands (of a stronger FX) or face tariffs otherwise, it helps explain today’s CNY strengthening even as the US just slapped the country with a 20% levy.
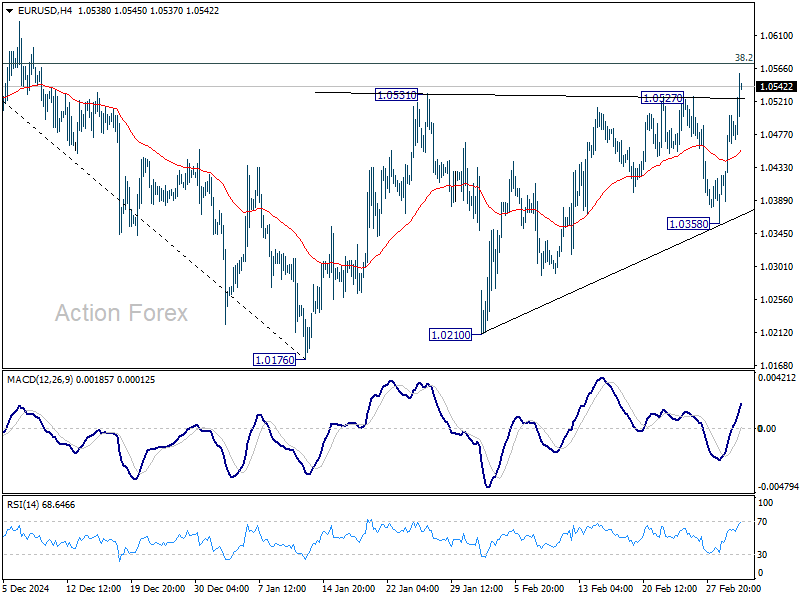
EUR/USD Mid-Day Outlook
Daily Pivots: (S1) 1.0417; (P) 1.0461; (R1) 1.0532; More...
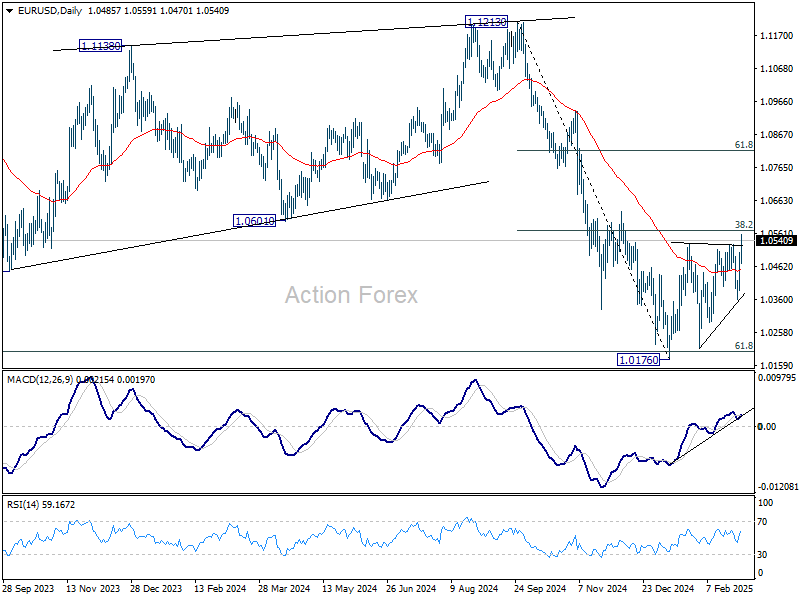
Intraday bias in EUR/USD is back on the upside with break of 1.0527 resistance. Immediate focus is now on 38.2% retracement of 1.1213 to 1.0176 at 1.0572. Sustained break there will raise the chance of near term bullish reversal, and target 61.8% retracement at 1.0817. On the downside, break of 1.0358 support will turn bias back to the downside for retesting 1.0176 low.
In the bigger picture, immediate focus is on 61.8 retracement of 0.9534 (2022 low) to 1.1274 (2024 high) at 1.0199. Sustained break there will solidify the case of medium term bearish trend reversal, and pave the way back to 0.9534. However, reversal from 1.0199 will argue that price actions from 1.1274 are merely a corrective pattern, and has already completed.
GBP/USD Mid-Day Outlook
Daily Pivots: (S1) 1.2614; (P) 1.2669; (R1) 1.2757; More...
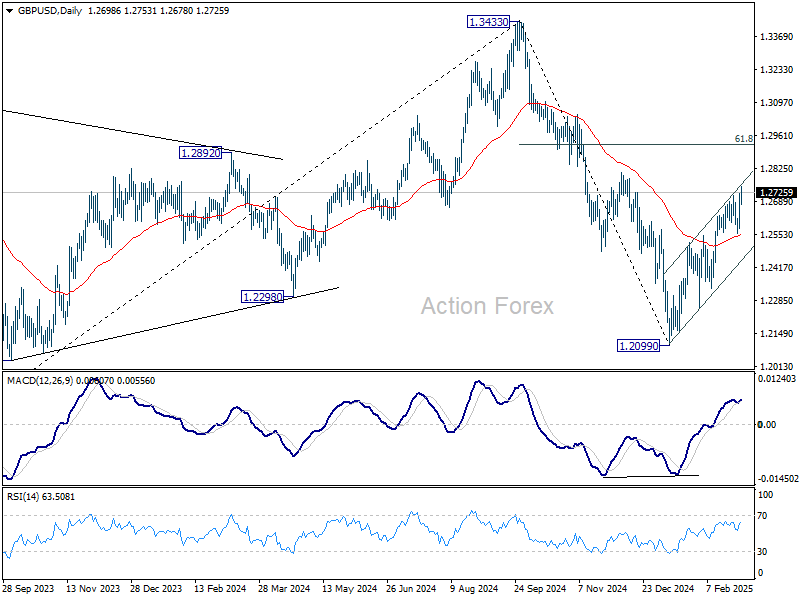
Intraday bias in GBP/USD remains on the upside as rise from 1.2099 is in progress for 1.2810 resistance. Firm break there will target 61.8% retracement of 1.3433 to 1.2099 at 1.2923. On the downside, break of 1.2558 will turn bias back to the downside for near term rising channel support (now at 1.2453).
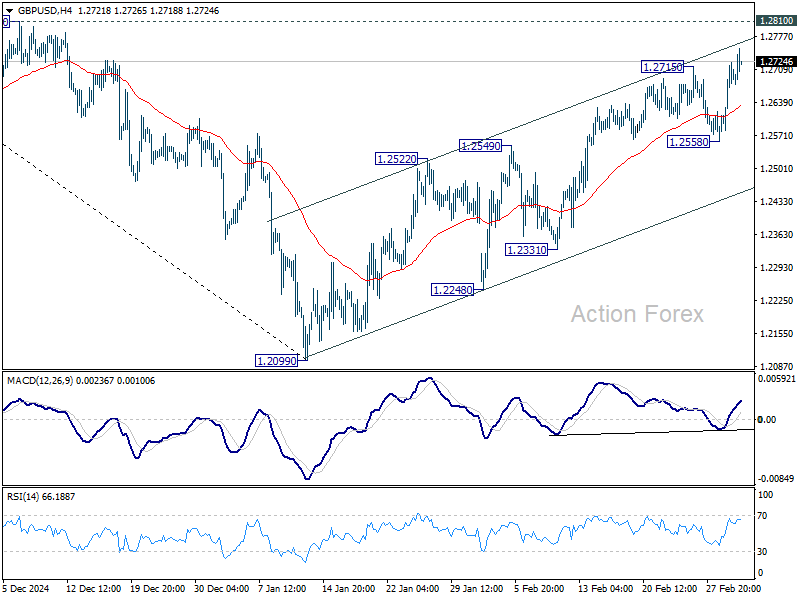
In the bigger picture, rise from 1.0351 (2022 low) should have already completed at 1.3433 (2024 high), and the trend has reversed. Further fall is now expected as long as 1.2810 resistance holds. Deeper decline should be seen to 61.8% retracement of 1.0351 to 1.3433 at 1.1528, even as a corrective move. However, firm break of 1.2810 will dampen this bearish view and bring retest of 1.3433 high instead.
USD/CHF Mid-Day Outlook
Daily Pivots: (S1) 0.8941; (P) 0.8987; (R1) 0.9013; More…
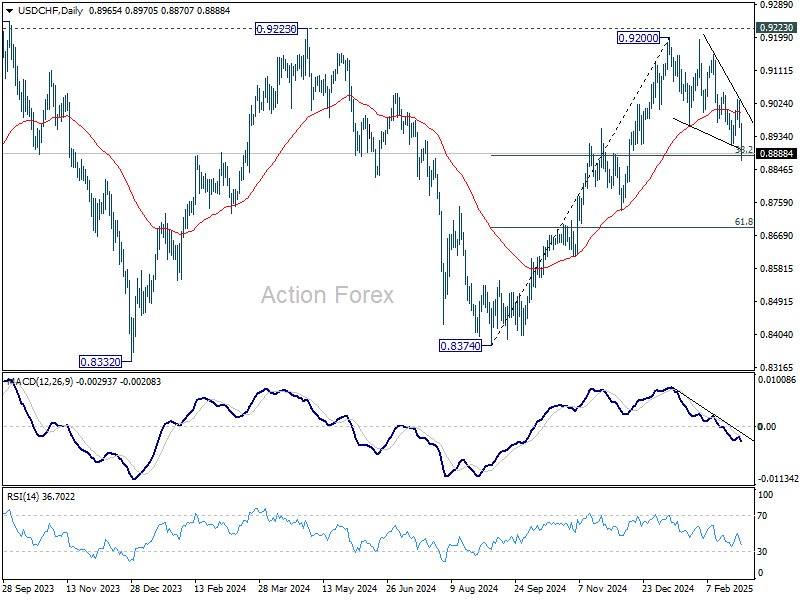
Intraday bias in USD/CHF is back on the downside as fall resumes through 0.8911 support. Immediate focus is now on 38.2% retracement of 0.8374 to 0.9200 at 0.8884 Strong rebound from current level, followed by break of 0.9035 resistance, will retain near term bullishness, and bring retest of 0.9200/23 resistance zone. However, firm break of 0.8444 will confirm rejection by 0.9223 resistance and turn near term outlook bearish.
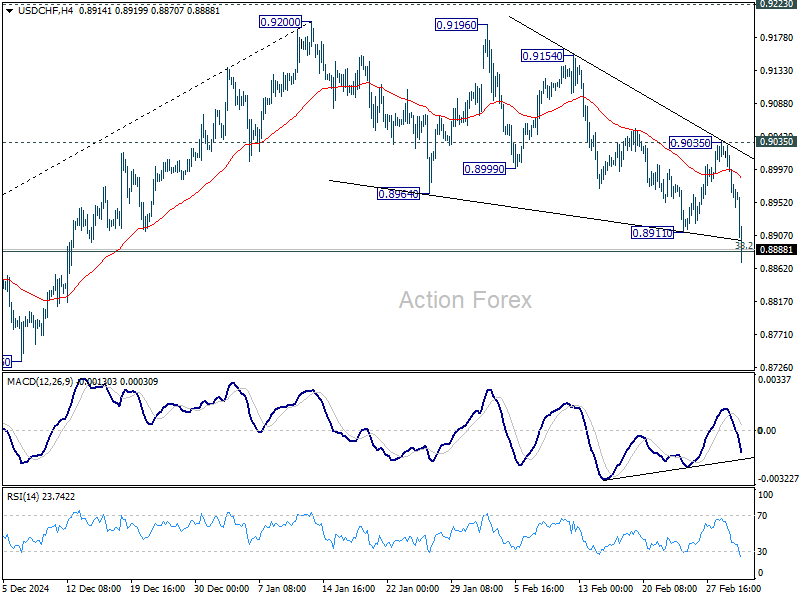
In the bigger picture, decisive break of 0.9223 resistance will argue that whole down trend from 1.0342 (2017 high) has completed with three waves down to 0.8332 (2023 low). Outlook will be turned bullish for 1.0146 resistance next. Nevertheless, rejection by 0.9223 will retain medium term bearishness for another decline through 0.8332 at a later stage.
USD/JPY Mid-Day Outlook
Daily Pivots: (S1) 148.63; (P) 149.97; (R1) 150.83; More...
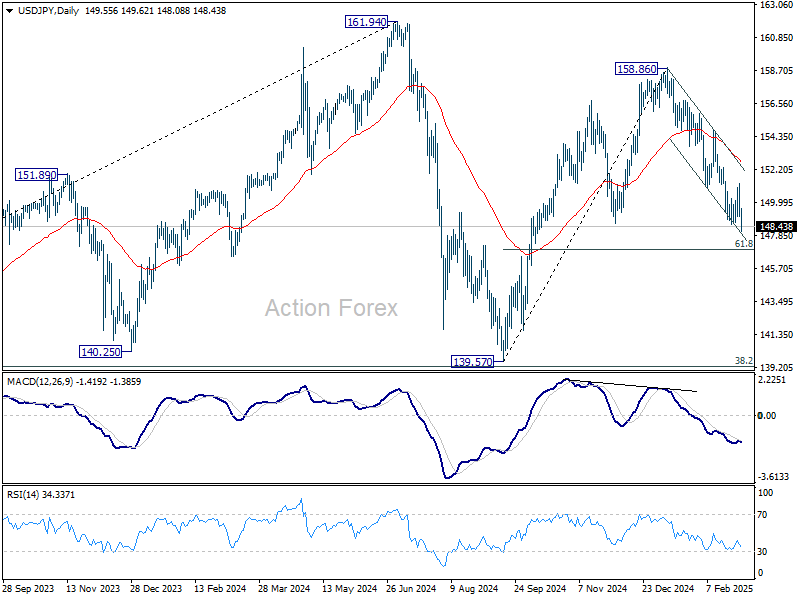
USD/JPY's fall from 158.86 resumed after brief consolidations and intraday bias is back on the downside. This decline is as the third leg of the corrective pattern from 161.94 high. Next target is 61.8% retracement of 139.57 to 158.86 at 146.32. Sustained break there will pave the way back to 139.57 low. For now, risk will remain on the downside as long as 151.29 resistance holds, in case of recovery.
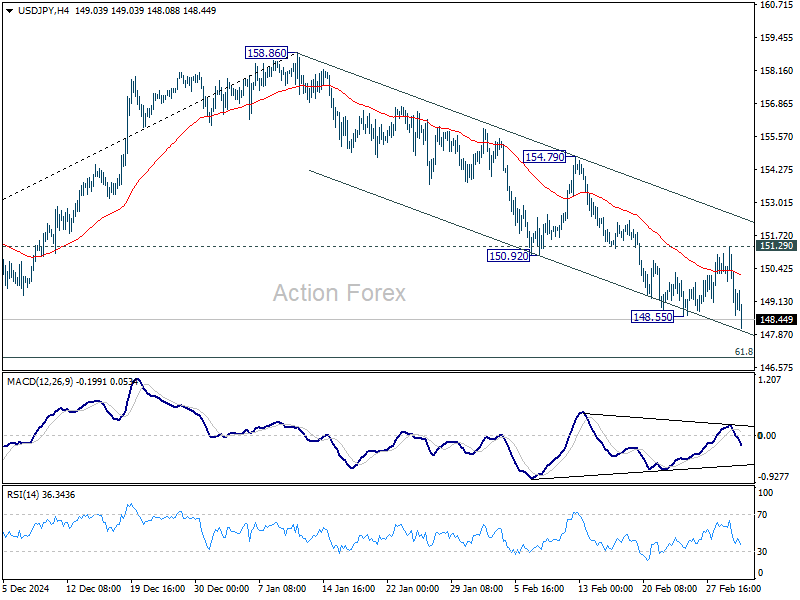
In the bigger picture, price actions from 161.94 are seen as a corrective pattern to rise from 102.58 (2021 low). In case of another fall, strong support should be seen from 38.2% retracement of 102.58 to 161.94 at 139.26 to bring rebound. However, sustained break of 139.26 would open up deeper medium term decline to 61.8% retracement at 125.25.
‘Trumpcession’ Concerns Drag Dollar Down, Fed Rate Cut Bets Surge
Dollar fell broadly today, an unusual development in contrast to recent rallies on escalating trade tensions and tariff announcements. Market sentiment soured as traders began to weigh the risks of a “Trumpcession,” a new term coined to describe the potential for US President Donald Trump’s policies to drive the economy into contraction or a full-blown recession.
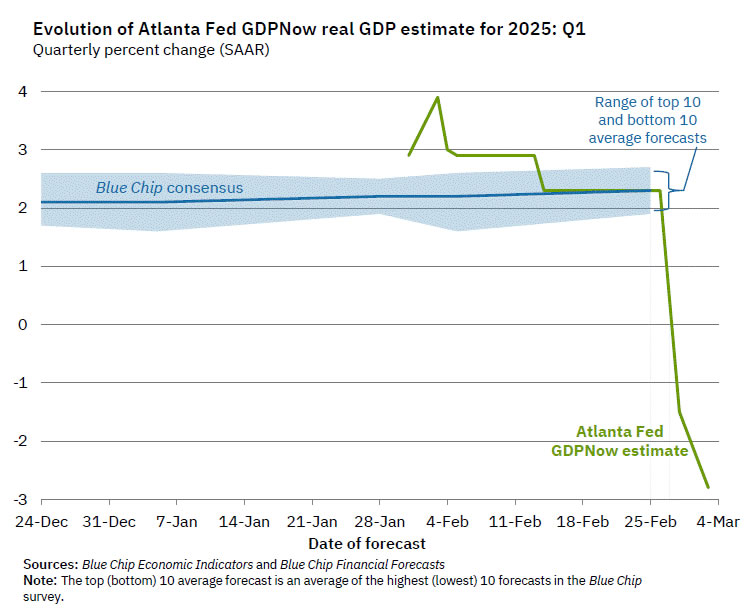
A major trigger for today’s shift in risk sentiment was the latest Atlanta Fed GDPNow estimate, which plummeted to -2.8% for Q1 2025, compared to -1.5% just days ago on February 28. This marks a dramatic deterioration in economic expectations, signaling that growth could already be already contracting at an alarming pace. Markets are increasingly recognizing that the tariff impact is not just theoretical—it is already weighing on consumption and business investment, and the effects could worsen in the coming months.
The first round of US tariffs officially took effect today, with a 25% levy imposed on Canada and Mexico, alongside a 20% additional tariff on Chinese imports. While this was expected, the concern now is the snowball effect. With more tariffs looming—including reciprocal tariffs set for April 2 and possible new levies on Japan and China for alleged currency devaluation.
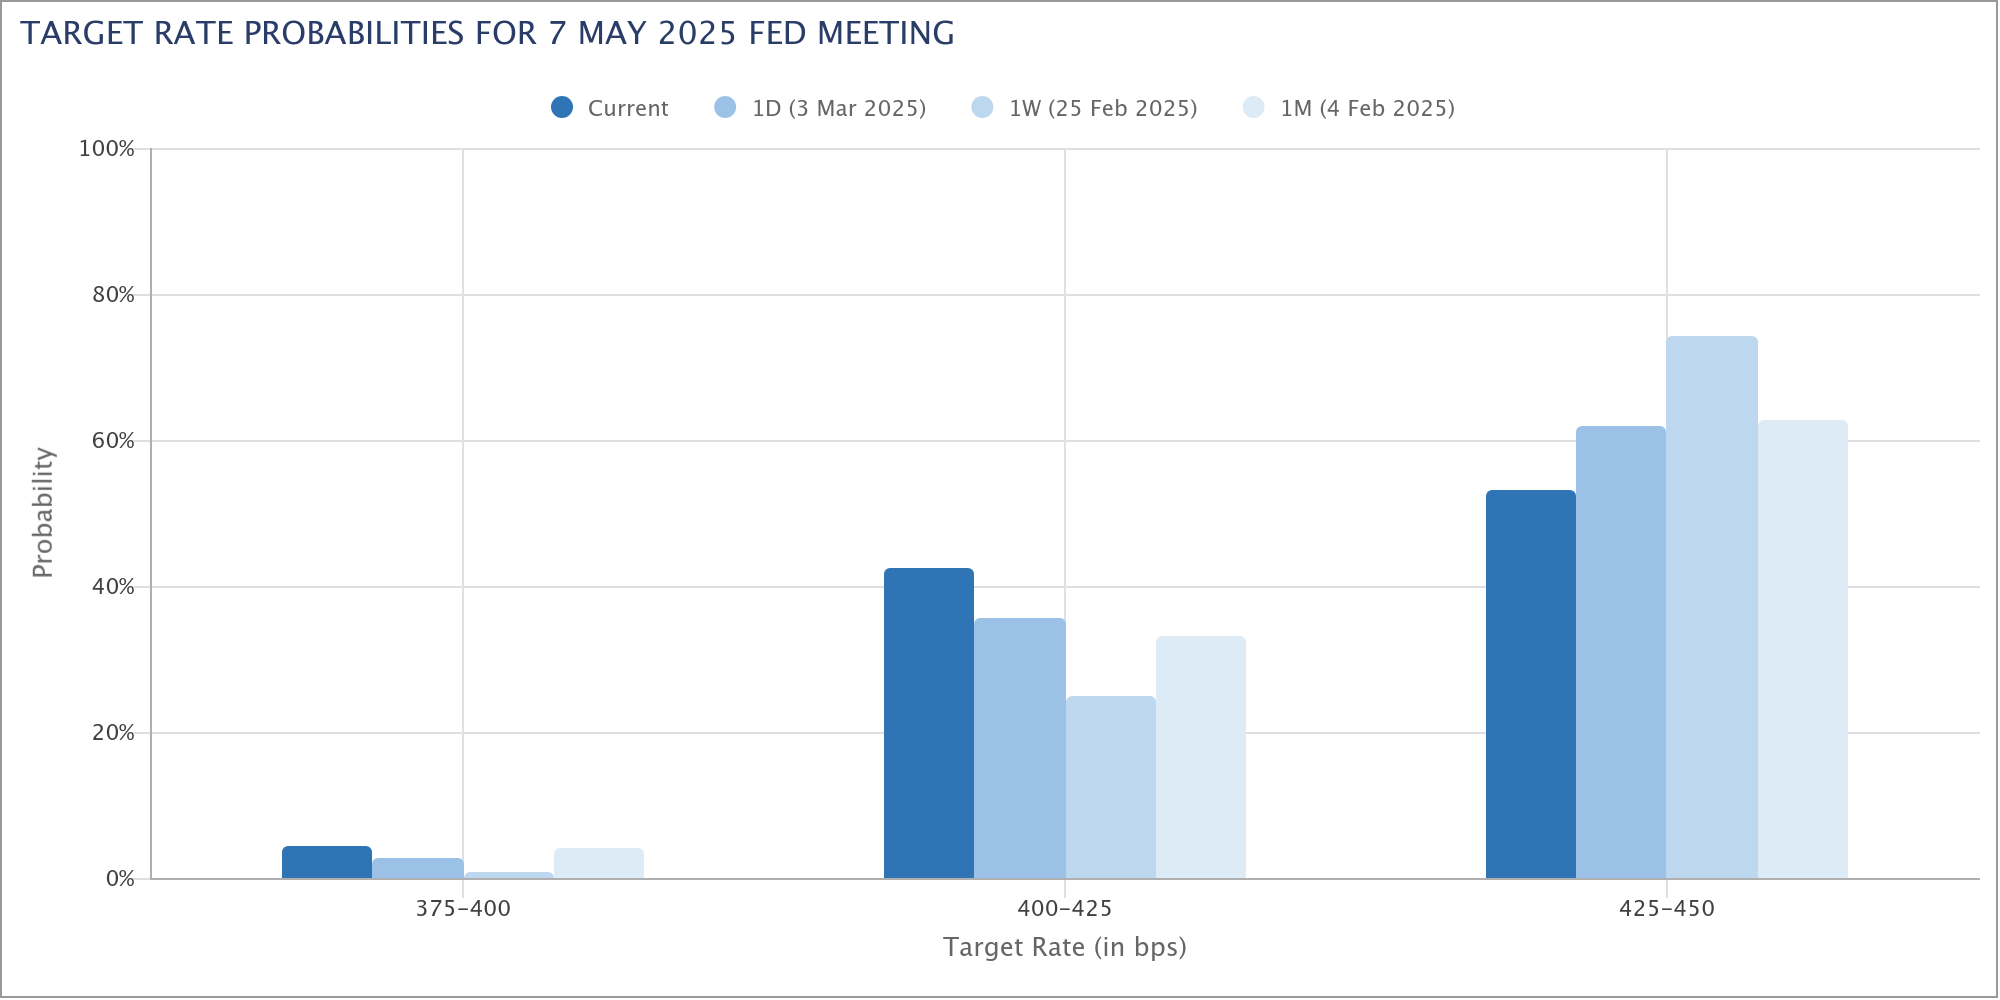
Market pricing for Fed rate cuts is accelerating too. Fed fund futures now assign a 47% probability of a rate cut in May, up from just 26% a week ago. If economic data continues to deteriorate, expectations could quickly rise above 50%, signaling that markets believe Fed will have little choice but to step in and resume monetary easing sooner than anticipated.
With overall sentiment on shakier ground, upcoming releases including tomorrow’s ISM services PMI and Friday’s non-farm payroll report have taken on added importance.
In the currency markets, Dollar is currently the worst performer of the day, followed by Aussie and Sterling. Meanwhile, Swiss Franc is leading gains, followed by Yen and Euro. Kiwi and Loonie are trading in the middle of the pack.
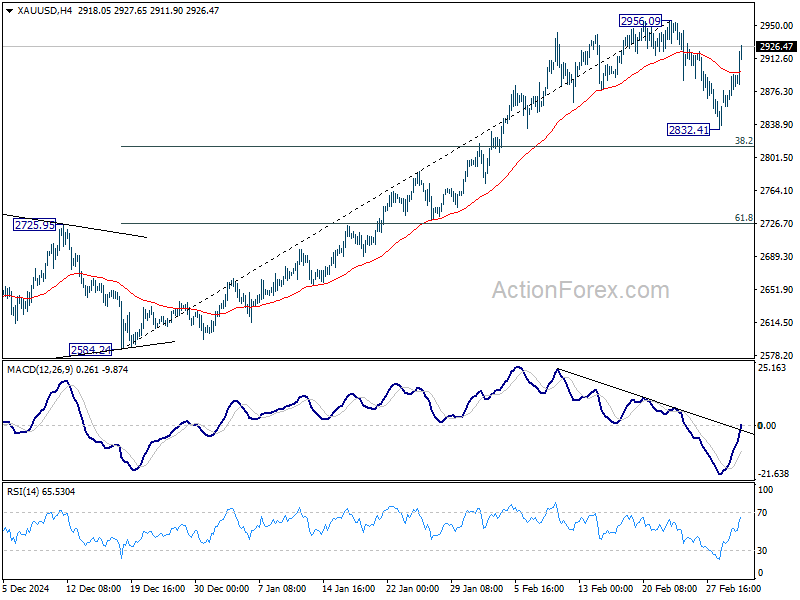
Technically, Gold reboounded strongly today following Dollar's selloff. The development suggests that pull back from 2956.09 is merely a near term correction, and has completed at 2832.41, ahead of 38.2% retracement of 2584.24 to 2956.09 at 2814.04. Retest of 2956.09 should be seen next and break there will resume larger up trend towards 3000 psychological level.
In Europe, at the time of writing, FTSE is down -0.75%. DAX is down -2.60%. CAC is down -1.68%. UK 10-year yield is down -0.068 at 4.444. Germanyu 10-year yield is down -0.027 at 2.466. Earlier in Asia, Nikkei fell -1.20%. Hong Kong HSI fell -0.20%. China Shanghai SSE rose 0.22%. Singapore Strait Times fell -0.28%. Japan 10-year JGB yield rose 0.018 to 1.428.
Eurozone unemployment rate unchanged at 6.2% in Jan
Eurozone unemployment rate was unchanged at 6.2% in January, coming in better than expectations of 6.3%. Across the broader EU, unemployment rate also held firm at 5.8%.
According to Eurostat, the number of unemployed individuals stood at 12.824 million in the EU, of which 10.655 million were in the Eurozone.
On a monthly basis, Eurozone unemployment fell by -42k, while the overall EU saw a more modest decline of -8k.
RBA minutes: No commitment to further rate cuts
The minutes from RBA’s February meeting reinforced the central bank’s cautious approach to monetary easing, making it clear that the recent 25bps rate cut to 4.10% does "not commit them to further reductions" in subsequent meetings.
Policymakers acknowledged that inflation has been falling at a “somewhat faster pace than expected,” which helped ease concerns over upside risks. However, they stressed that the path to returning inflation to target while maintaining labor market gains is “not yet assured.” The Board ultimately deemed that the stronger case was to ease policy, given the downside risks to the economy.
Despite the decision to cut, RBA members debated the risks of "easing policy too soon", recognizing that a premature policy shift could lead to resurgence in inflation.
They noted that if inflation proved “more persistent than expected,” holding the cash rate at 4.1% for an “extended period” or even tightening policy would be warranted.
Australia retail sales rises 0.3% mom, driving by food-related spending
Australia's retail sales turnover rose 0.3% mom to AUD 37.08B in January, matched expectations.
Robert Ewing, ABS head of business statistics, said: "While the pick-up in retail spending since mid-2024 has been boosted by more discretionary spending, this month’s rise is mostly driven by food-related spending."
USD/JPY Mid-Day Outlook
Daily Pivots: (S1) 148.63; (P) 149.97; (R1) 150.83; More...
USD/JPY's fall from 158.86 resumed after brief consolidations and intraday bias is back on the downside. This decline is as the third leg of the corrective pattern from 161.94 high. Next target is 61.8% retracement of 139.57 to 158.86 at 146.32. Sustained break there will pave the way back to 139.57 low. For now, risk will remain on the downside as long as 151.29 resistance holds, in case of recovery.
In the bigger picture, price actions from 161.94 are seen as a corrective pattern to rise from 102.58 (2021 low). In case of another fall, strong support should be seen from 38.2% retracement of 102.58 to 161.94 at 139.26 to bring rebound. However, sustained break of 139.26 would open up deeper medium term decline to 61.8% retracement at 125.25.