Sample Category Title
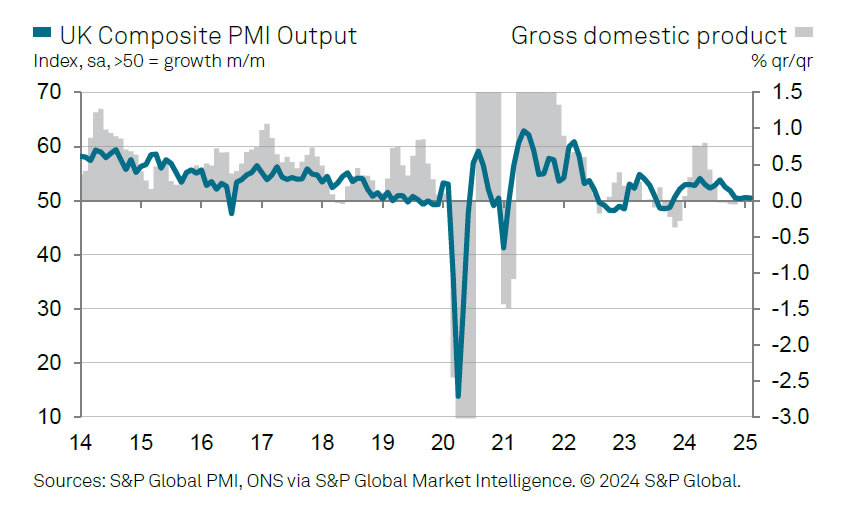
UK PMI services finalized at 51, stagflation risks grow
The UK services sector showed little improvement in February, with PMI Services finalized at 51.0, slightly up from January’s 50.8 but still well below its long-run average of 54.3. Meanwhile, PMI Composite edged lower from 50.6 to 50.5, signaling stagnant overall economic activity as demand conditions continue to weaken both domestically and in export markets.
Tim Moore, Economics Director at S&P Global Market Intelligence, warned of "elevated risk of stagflation on the horizon". New orders falling at their sharpest rate in over two years. Rising payroll costs and economic uncertainty have eroded business confidence, bringing sentiment to its lowest level since December 2022.
Concerns over slowing growth and persistent inflation pressures have also led to continued job losses, with employment in the services sector contracting for a fifth straight month—the longest period of decline outside of the pandemic since early 2011.
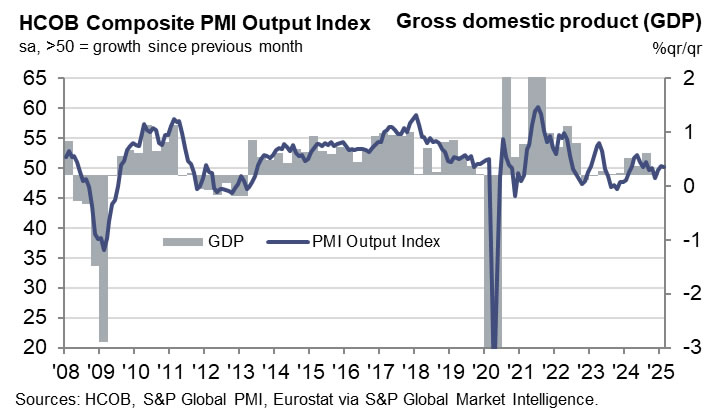
Eurozone PMI composite finalized at 50.2, barely grow for two months
Eurozone economy showed little momentum in February, with PMI Services finalizing at 50.6, down from 51.3 in January, while PMI Composite was unchanged at 50.2.
The picture was mixed across the region with Spain, Ireland, and Italy showing signs of expansion, while Germany’s services sector slowed and France’s continued its sharp contraction, posting its lowest reading in 13 months at 45.1.
Cyrus de la Rubia, Chief Economist at Hamburg Commercial Bank, noted that services growth is barely offsetting the prolonged slump in manufacturing. He pointed to rising input costs, particularly wage pressures, as a growing concern for ECB.
Political uncertainty in key economies is also weighing on sentiment. France’s services sector is deteriorating at a much faster pace, likely influenced by unresolved political instability. In contrast, Germany’s services sector, though slowing, remains in expansion, with hopes that post-election stability could support economic recovery.
However, with external risks from trade tensions and weak consumer spending, a decisive rebound in Eurozone remains uncertain.
Crypto’s Unconvincing Rebound
Market Picture
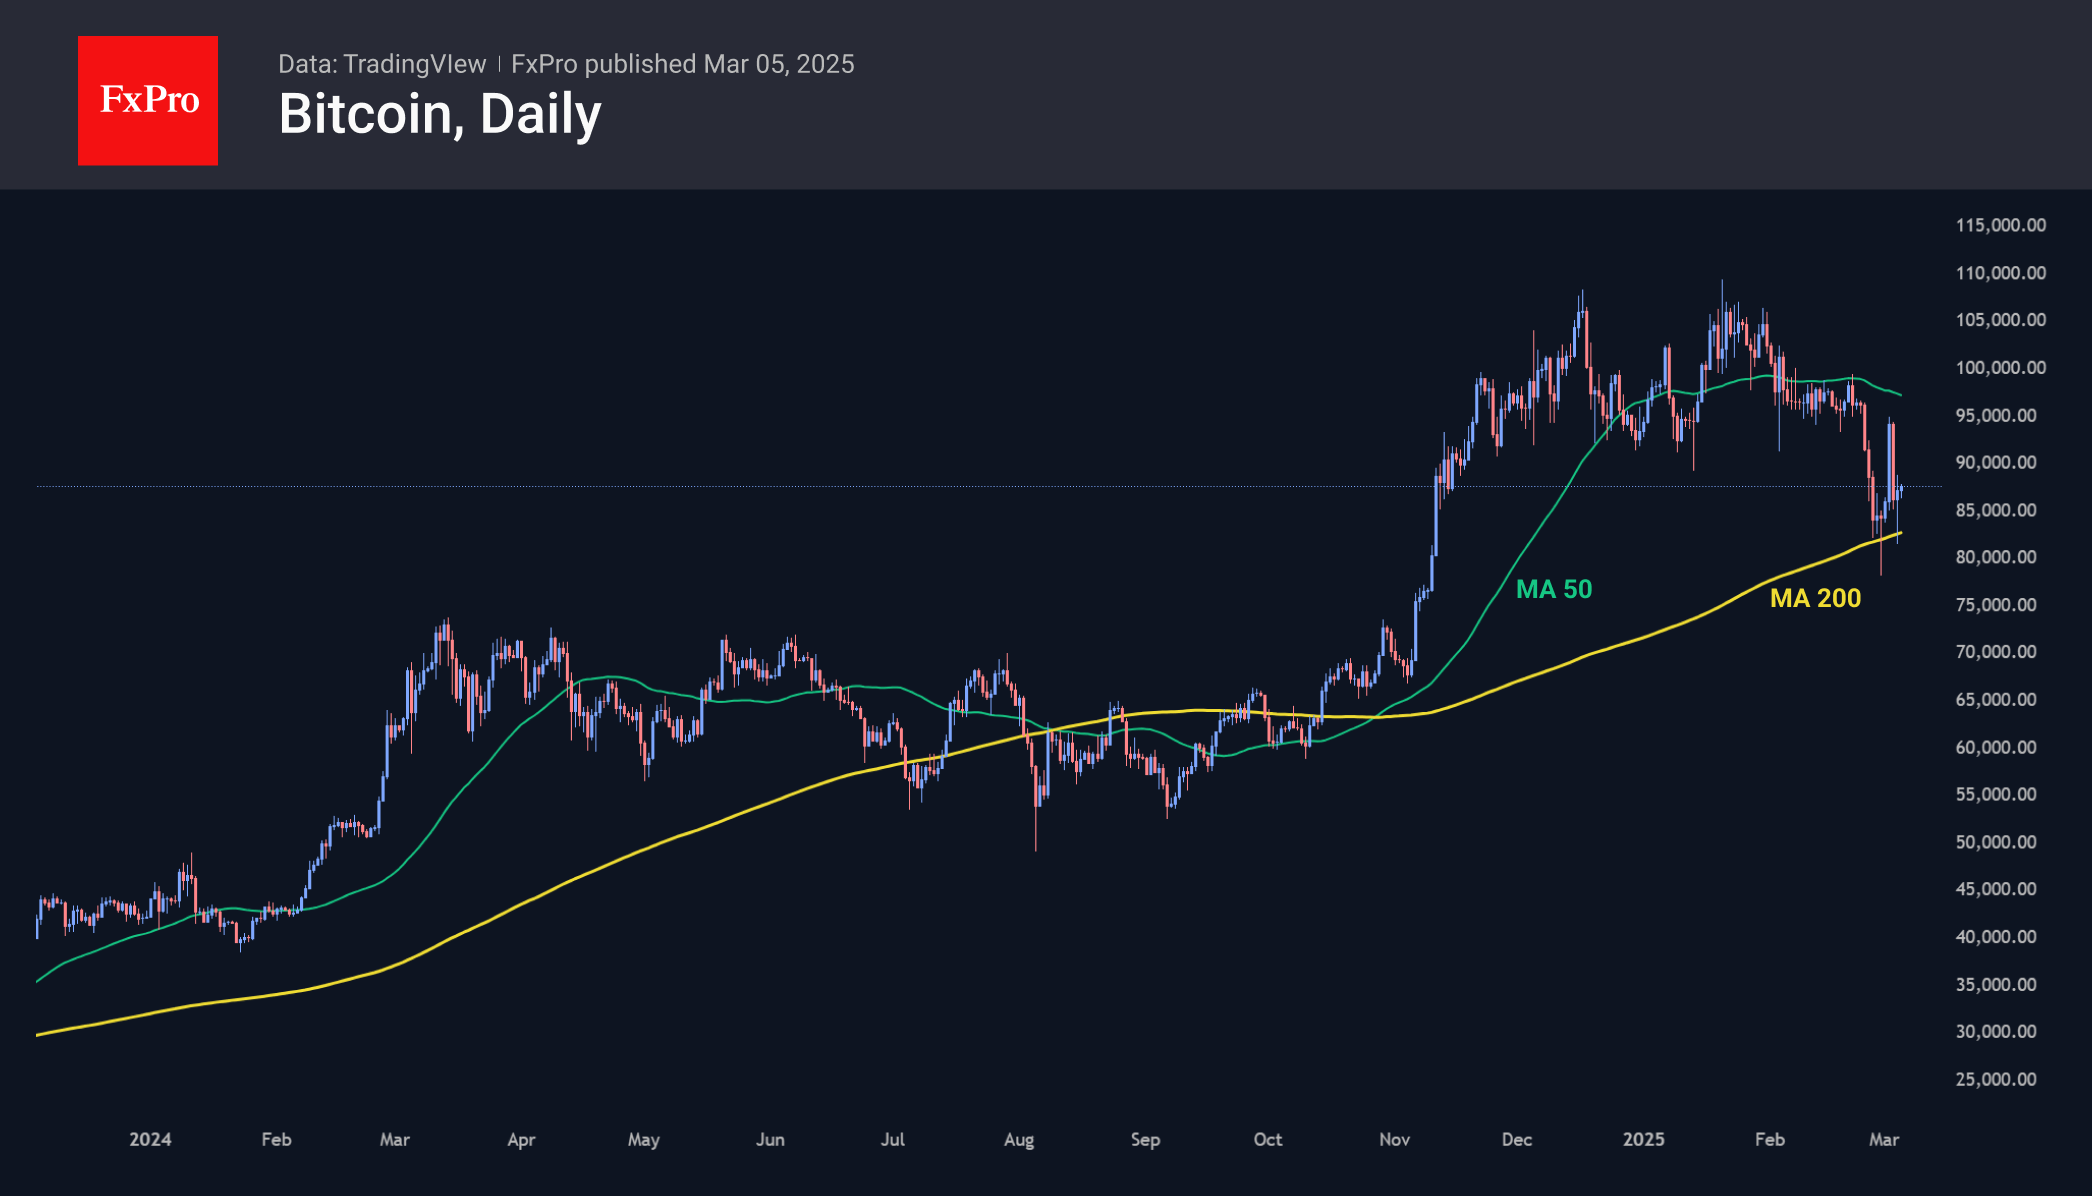
The crypto market has gained 4% in cap in 24 hours, but this looks more like a wild swing than the start of a recovery. The $2.87 trillion market remains below the long-term trend line of the 200-day moving average, near $3 trillion, and the initiative has shifted back to Bitcoin.
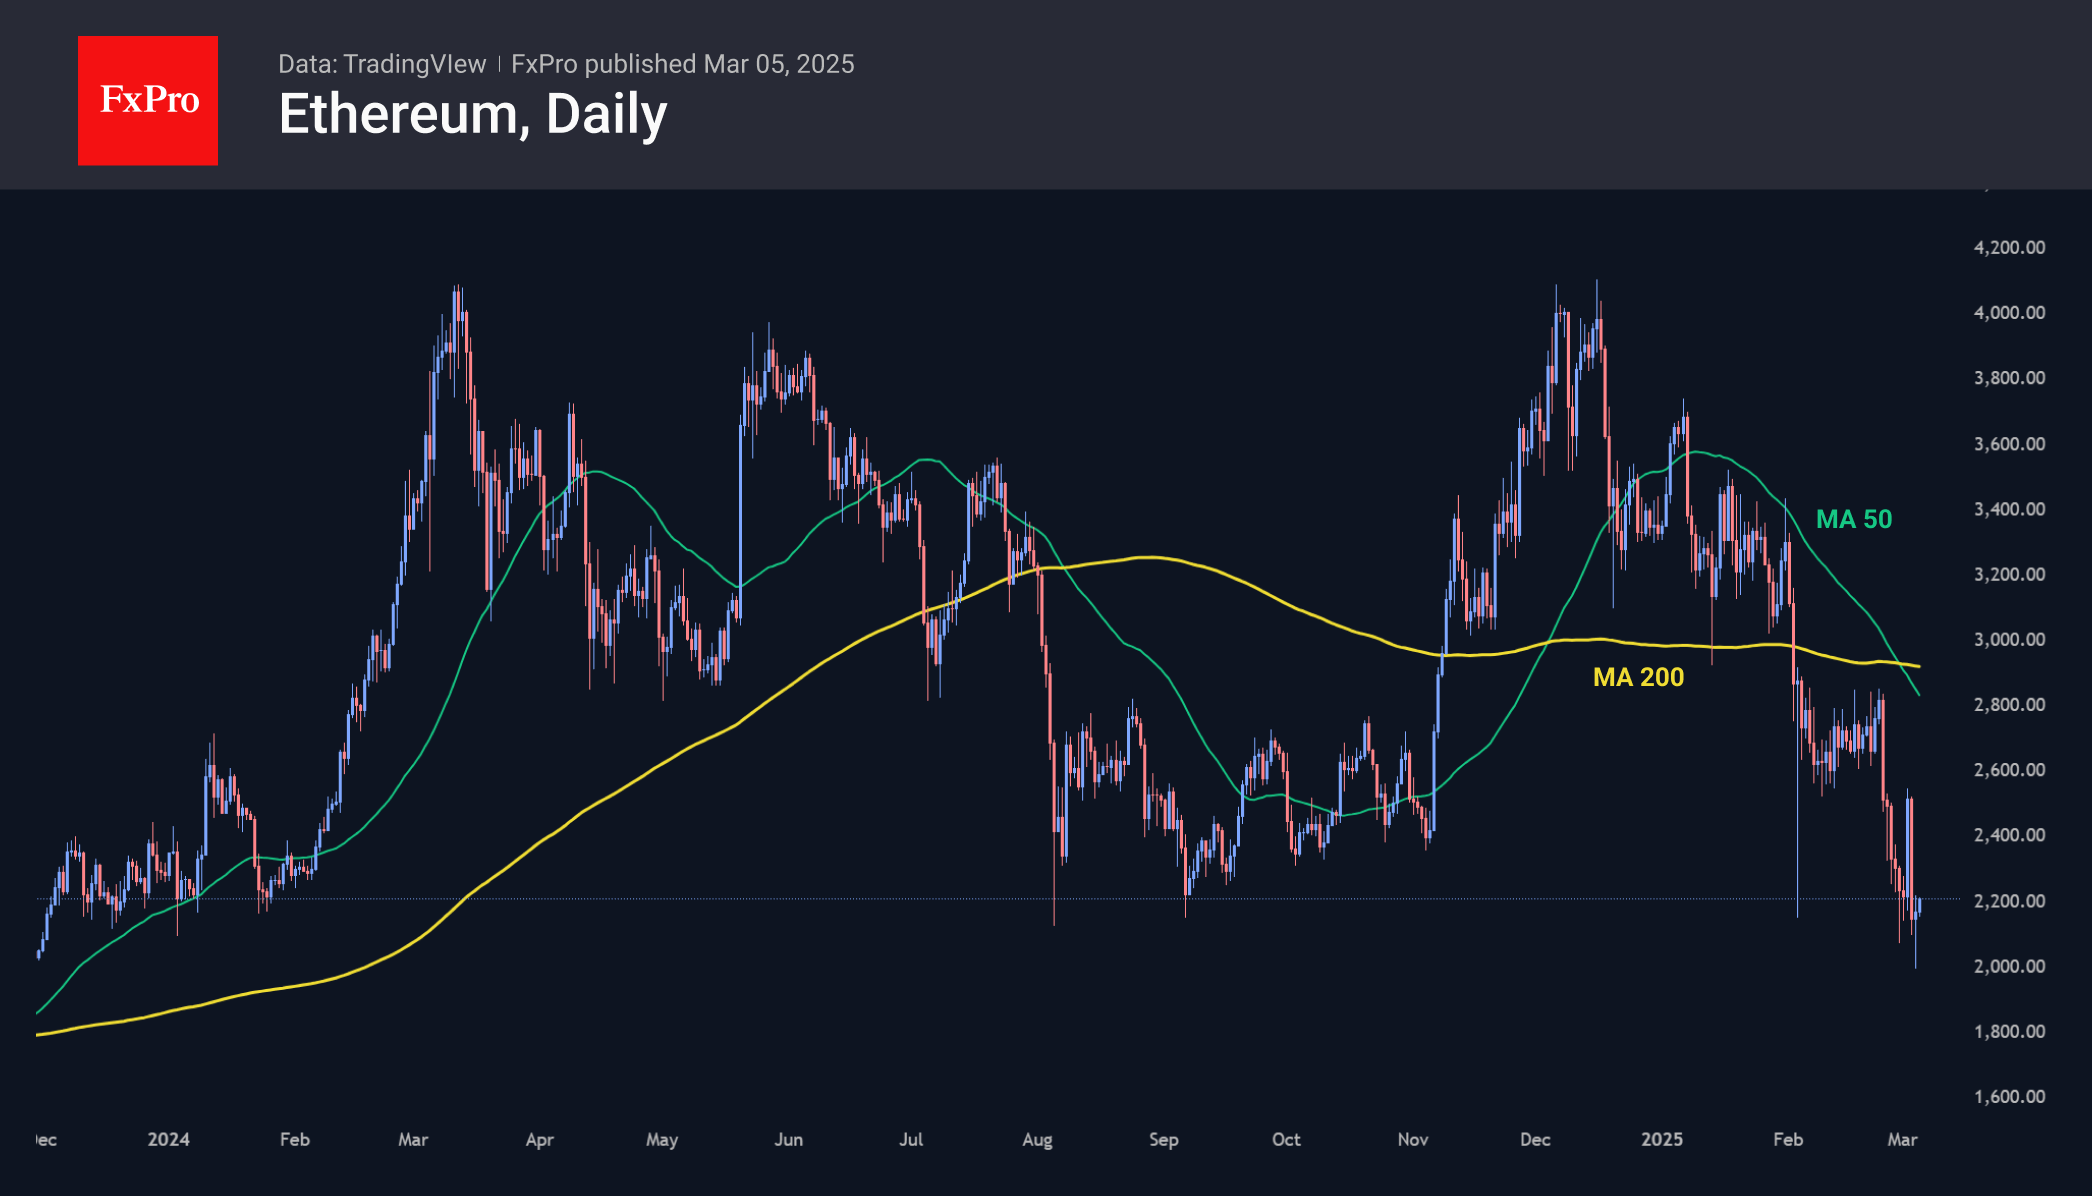
Bitcoin’s share of the crypto market exceeds 60%, which is typical in periods of fear. This time, we also note the decline in Ethereum’s share to 9%, a low in almost five years. This negative trend has been maintained for the last two years with brief spikes.
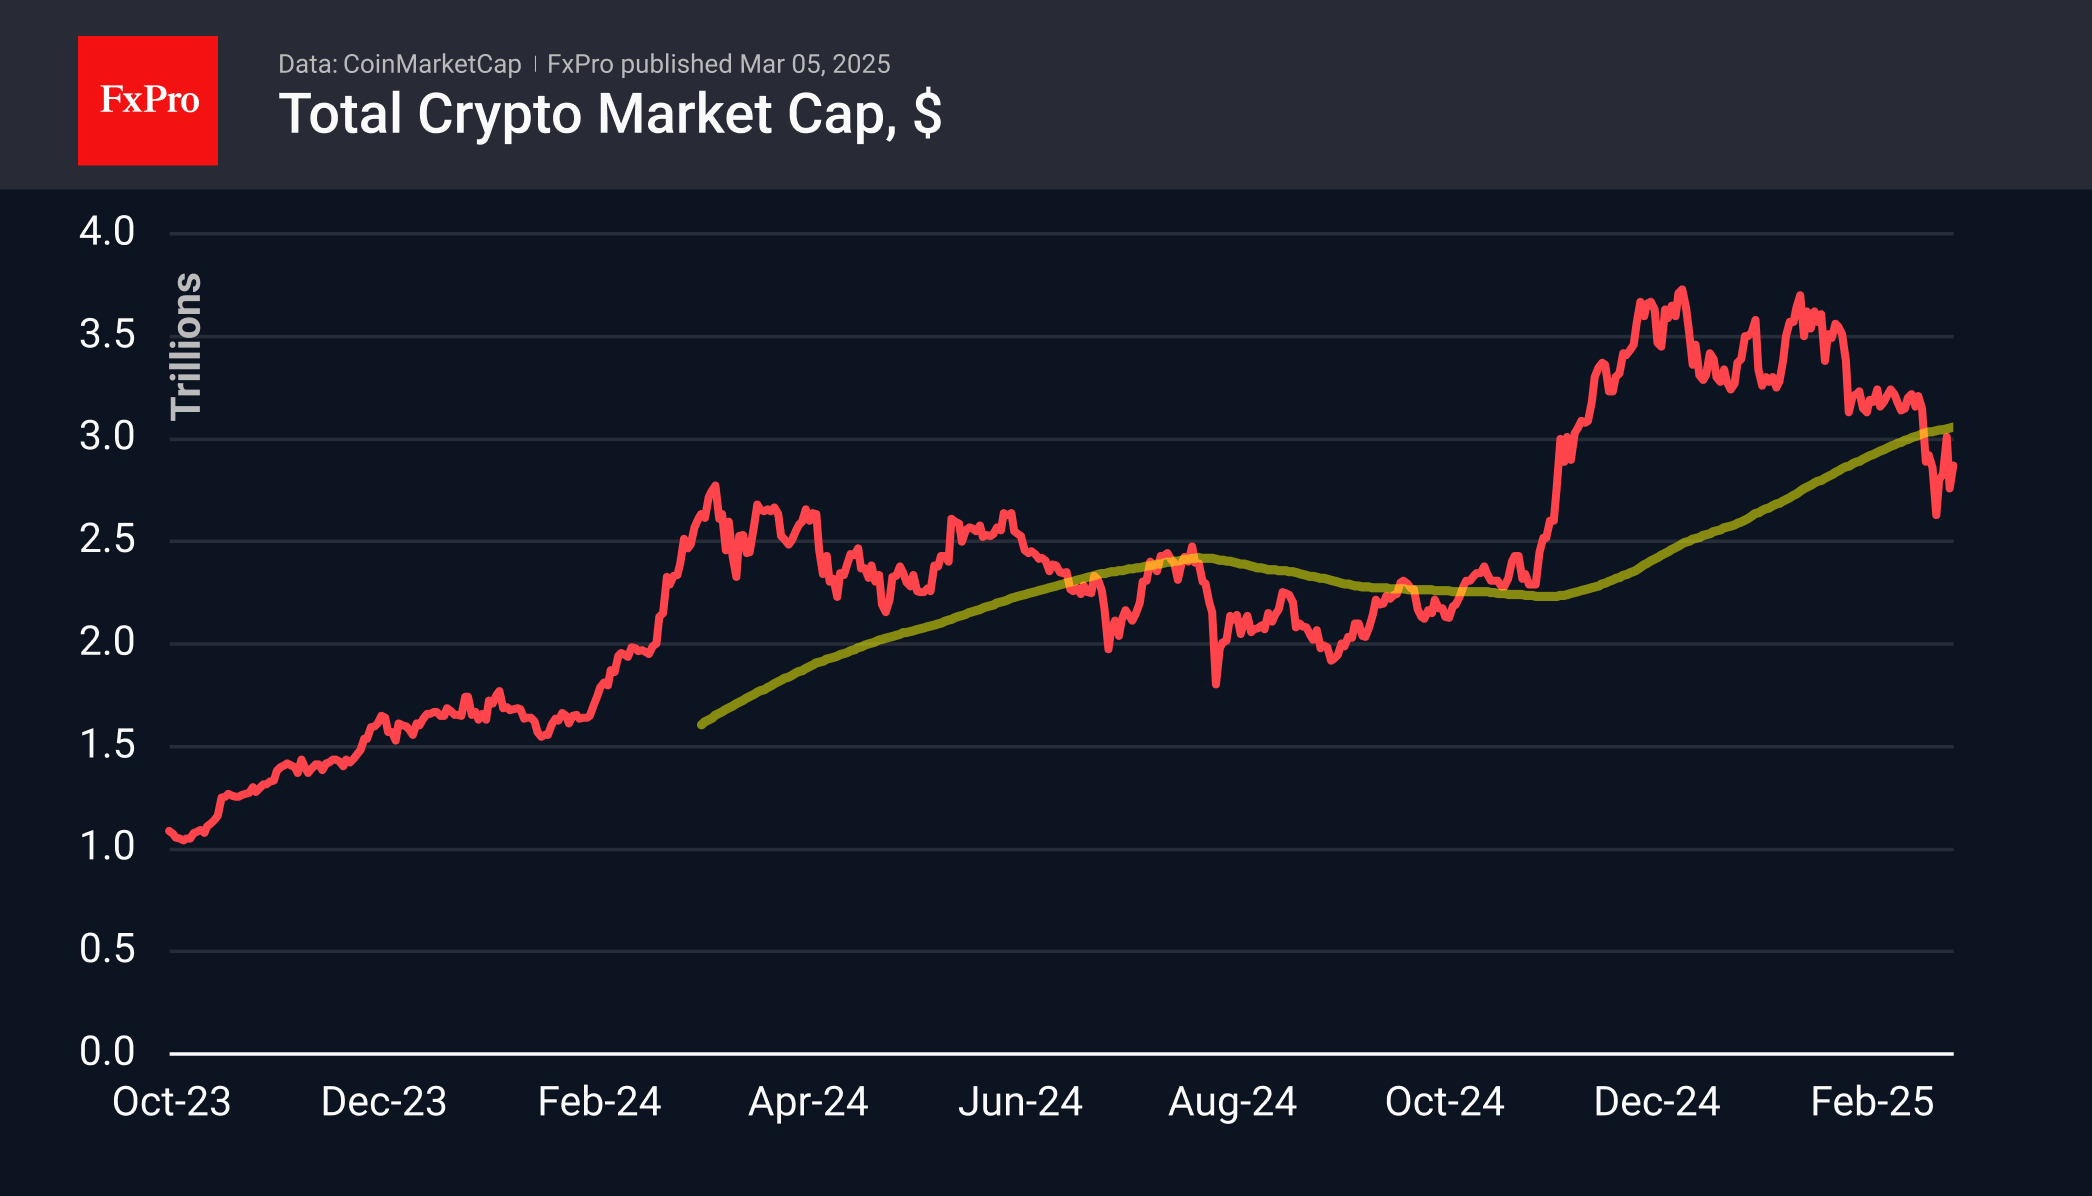
Bitcoin continues to flirt with the 200-day MA, popping out on Tuesday shortly after touching that level below $83,000. Wednesday morning’s market dynamics reflect cautious attempts to form a bottom. A return to the area above the 50-day at $97,000 is a marker of bullish success.
Ethereum is trading below $2200. Earlier in the week, it dipped below $2000 at the peak of the decline but stabilised near the support line in early 2024. This dangerous proximity to the lower end of the trading range keeps our focus on ETH as the market’s canary, which is having a tough time right now.
News Background
Net outflows from spot Ethereum-ETFs in the US fell to $12.1 million on 3 March, a negative trend for the eighth consecutive trading session. Total inflows since the product launch on 23 July fell to $2.81bn.
President of Euro Pacific Capital and bitcoin critic Peter Schiff called on Congress to launch an investigation into US President Donald Trump’s actions in the field of cryptocurrencies. He said the politician’s posts on the Truth Social platform, which led to a sharp rise in cryptocurrencies and then their fall, could have been part of a pump-and-dump scheme.
Affiliates of the collapsed FTX and Alameda addresses unlocked 3.03 million SOLs worth $431 million, Lookonchain said. This is the largest withdrawal since November 2023. Most of the tokens were sold through Binance and Coinbase at an average price of $125.8 per coin.
EUR/USD Rallies While USD/CHF Dips Further
EUR/USD started a fresh increase above the 1.0550 resistance. USD/CHF declined and now struggling below the 0.8950 resistance.
Important Takeaways for EUR/USD and USD/CHF Analysis Today
- The Euro started a decent recovery wave from the 1.0360 zone against the US Dollar.
- There is a connecting bullish trend line forming with support near 1.0570 on the hourly chart of EUR/USD at FXOpen.
- USD/CHF declined below the 0.8975 and 0.8950 support levels.
- There is a short-term contracting triangle forming with resistance near 0.8910 on the hourly chart at FXOpen.
EUR/USD Technical Analysis
On the hourly chart of EUR/USD at FXOpen, the pair started a fresh increase from the 1.0360 zone. The Euro cleared the 1.0450 resistance to move into a bullish zone against the US Dollar, as mentioned in the last analysis.
The bulls pushed the pair above the 50-hour simple moving average and 1.0550. Finally, the pair tested the 1.0635 resistance. A high was formed near 1.0637 and the pair is now consolidating gains above the 23.6% Fib retracement level of the upward wave from the 1.0359 swing low to the 1.0637 high.
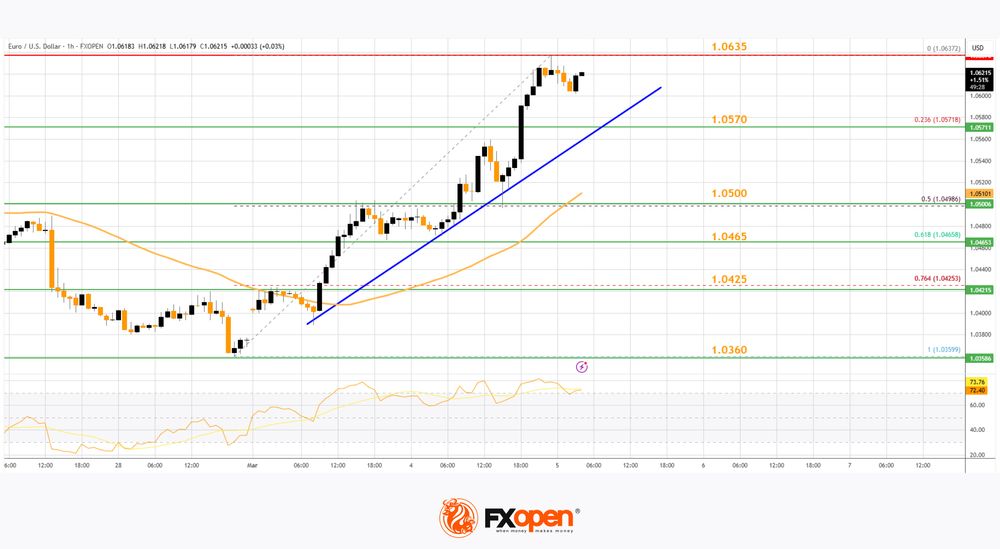
Immediate support on the downside is near a connecting bullish trend line at 1.0570. The next major support is the 1.0500 level and the 50% Fib retracement level of the upward wave from the 1.0359 swing low to the 1.0637 high.
A downside break below the 1.0500 support could send the pair toward the 1.0465 level. Any more losses might send the pair into a bearish zone toward 1.0425.
Immediate resistance on the EUR/USD chart is near the 1.0635 zone. The first major resistance is near the 1.0665 level. An upside break above the 1.0665 level might send the pair toward the 1.0720 resistance.
The next major resistance is near the 1.0750 level. Any more gains might open the doors for a move toward the 1.0800 level.
USD/CHF Technical Analysis
On the hourly chart of USD/CHF at FXOpen, the pair started a fresh decline from well above the 0.9000 zone. The US Dollar dropped below the 0.8975 support to move into a negative zone against the Swiss Franc.
The bears pushed the pair below the 50-hour simple moving average and 0.8920. Finally, the bulls appeared near the 0.8870 level. A low was formed near 0.8871 and the pair is now consolidating losses.
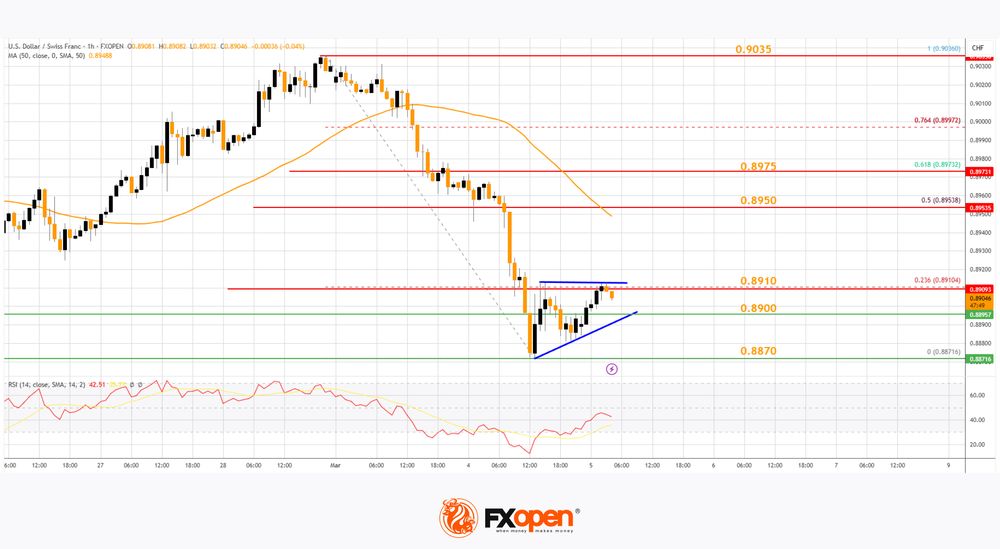
There was a minor increase and the pair tested the 23.6% Fib retracement level of the downward move from the 0.9036 swing high to the 0.8871 low. On the upside, the pair could face resistance near the 0.8910 level.
There is also a short-term contracting triangle forming with resistance near 0.8910. The next major resistance is near the 50% Fib retracement level of the downward move from the 0.9036 swing high to the 0.8871 low at 0.8950, above which the pair could test the 0.8975 level.
If there is a clear break above the 0.8975 resistance zone, the pair could start another increase. In the stated case, it could even surpass 0.9000.
On the downside, immediate support on the USD/CHF chart is 0.8900. The first major support is near the 0.8870 level. The next major support is near 0.8850. Any more losses may possibly open the doors for a move toward the 0.8820 level in the coming days.
Trade over 50 forex markets 24 hours a day with FXOpen. Take advantage of low commissions, deep liquidity, and spreads from 0.0 pips. Open your FXOpen account now or learn more about trading forex with FXOpen.
This article represents the opinion of the Companies operating under the FXOpen brand only. It is not to be construed as an offer, solicitation, or recommendation with respect to products and services provided by the Companies operating under the FXOpen brand, nor is it to be considered financial advice.
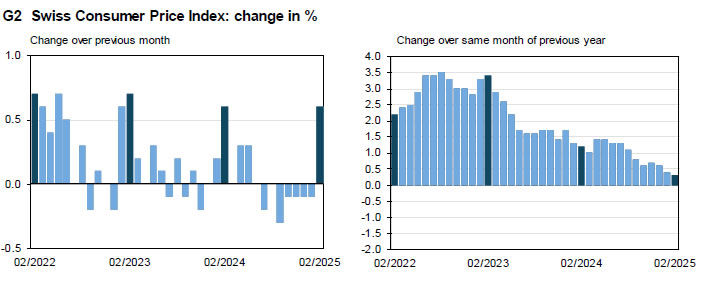
Swiss annual CPI ticks down to 0.3% yoy, remains weak
Swiss inflation accelerated on a monthly basis in February, with CPI rising 0.6% mom, slightly above the expected 0.5%. Core CPI, which excludes fresh and seasonal products, energy, and fuel, increased by 0.7% mom. The rise was driven by both domestic and imported product prices, which climbed 0.5% mom and 0.9% mom, respectively.
However, the broader inflation trend remains subdued. On a year-over-year basis, headline CPI slowed to 0.3% yoy from 0.4% yoy, though it was still slightly above expectations of 0.2% yoy. Core CPI remained steady at 0.9% yoy. While domestic product price inflation eased from 1.0% yoy to 0.9% yoy, imported prices continued to contract, staying at -1.5% yoy.
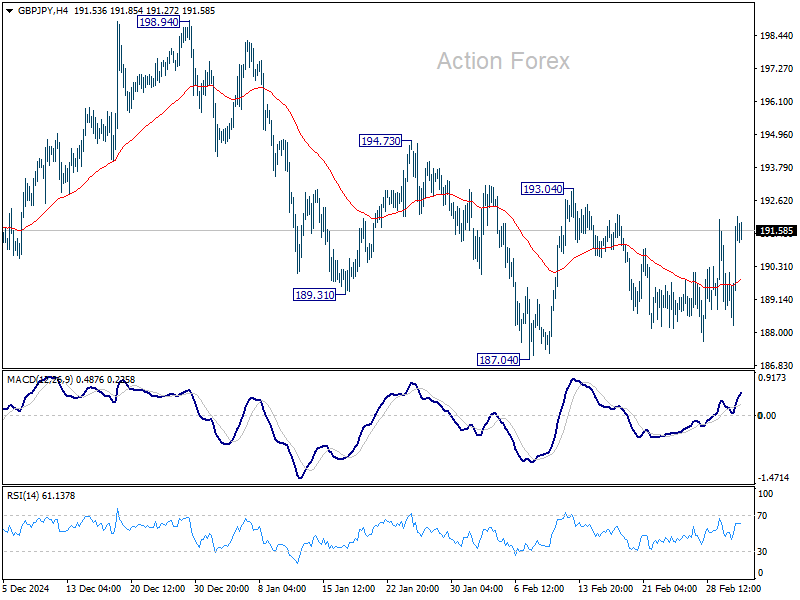
GBP/JPY Daily Outlook
Daily Pivots: (S1) 189.36; (P) 190.57; (R1) 192.89; More...
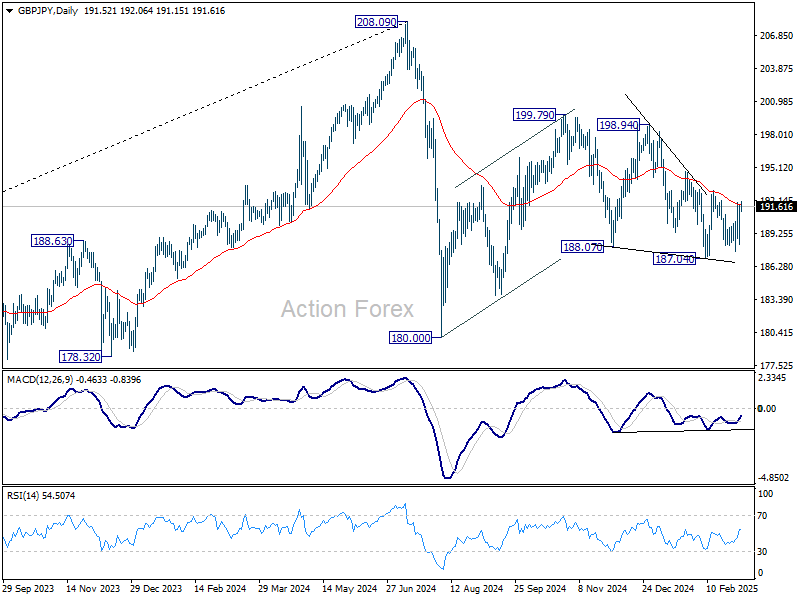
No change in GBP/JPY's outlook as range trading continues. O the upside, fir break of 193.04 will resume the rebound from 187.04 to 194.73 resistance, and then 198.94. On the downside, firm break of 187.04 will extend the fall from 199.79 towards 180.00 support. Overall, corrective pattern from 180.00 might still be extending.
In the bigger picture, price actions from 208.09 are seen as a correction to rally from 123.94 (2020 low). Strong support should be seen from 38.2% retracement of 123.94 to 208.09 at 175.94 to contain downside. However, sustained break of 152.11 will bring deeper fall even still as a correction.
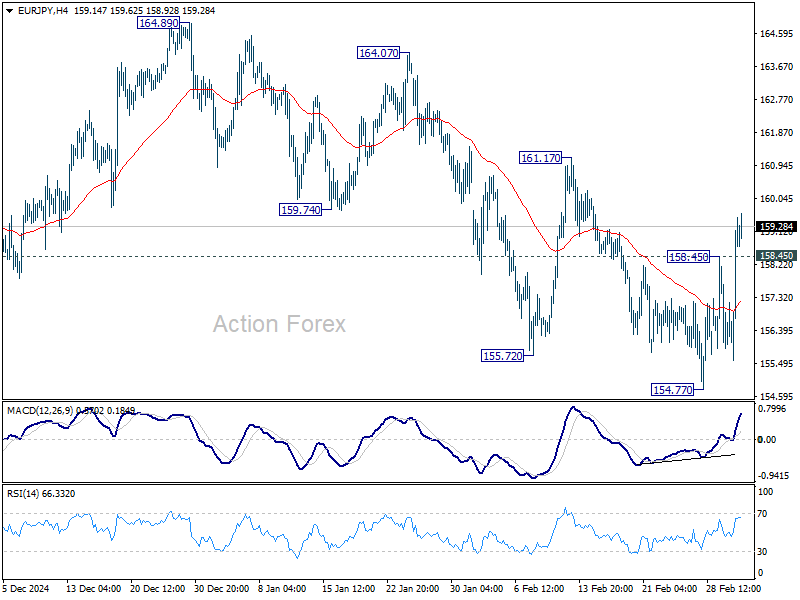
EUR/JPY Daily Outlook
Daily Pivots: (S1) 156.79; (P) 158.00; (R1) 160.41; More...
EUR/JPY's rebound from 154.77 resumed and break of 158.45 indicates short term bottoming. Intraday bias is back on the upside. Sustained break of 55 D EMA (now at 159.55) will argue that corrective pattern from 154.40 has started another rising leg, and target 161.17 resistance and above.
In the bigger picture, price actions from 175.41 are seen as correction to rally from 114.42 (2020 low). Strong support should be seen from 38.2% retracement of 114.42 to 175.41 at 152.11 to contain downside. However, sustained break of 152.11 will bring deeper fall even still as a correction. Next target will be 100% projection of 175.41 to 154.40 from 166.67 at 145.66.

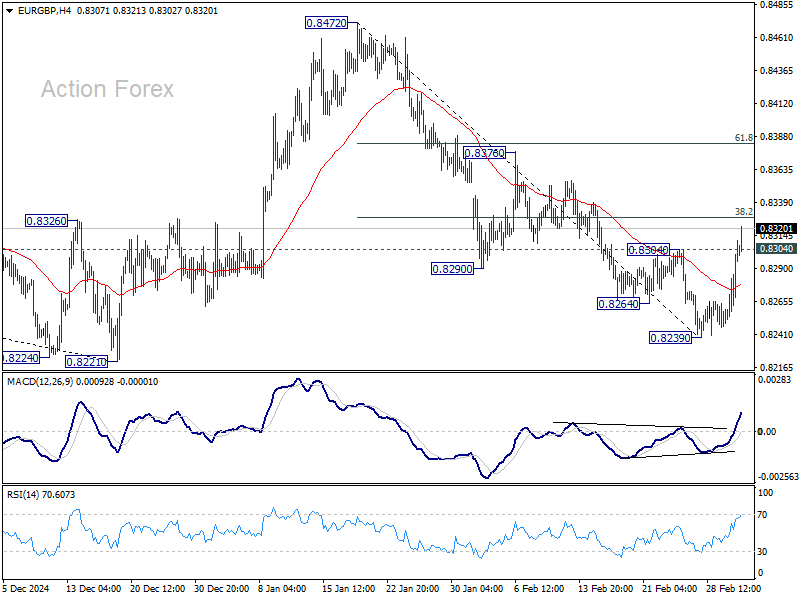
EUR/GBP Daily Outlook
Daily Pivots: (S1) 0.8268; (P) 0.8287; (R1) 0.8323; More...
A short term bottom is in place in EUR/GBP with break of 0.8239 resistance. Intraday bias is back on the upside for 38.2% retracement of 0.8472 to 0.8239 at 0.8328. Sustained break there will argue that whole fall from 0.8472 has completed and target 61.8% retracement at 0.8383. However, rejection by 0.8328 will bring another decline through 0.8239 support.
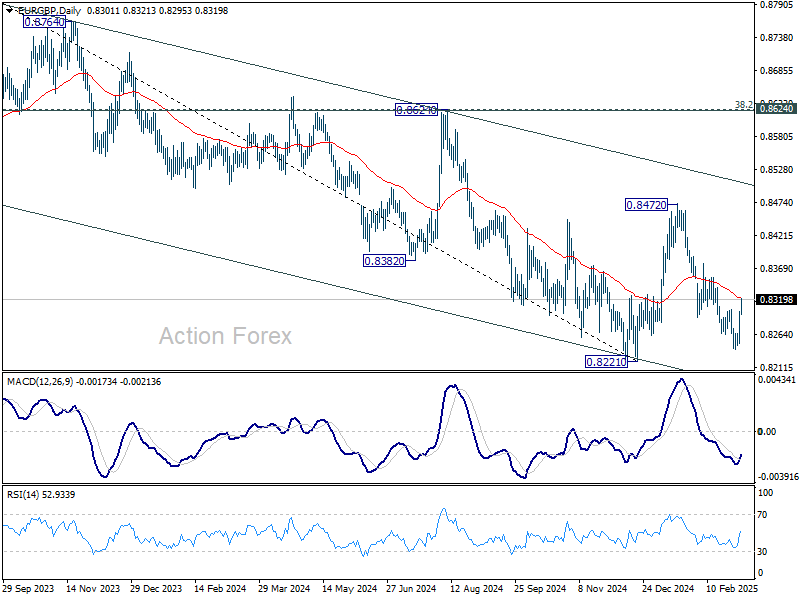
In the bigger picture, the medium term down trend remains intact with EUR/GBP staying well inside the falling channel. Prior rejection by 55 W EMA (now at 0.8414) also affirm bearishness. Decisive break of 0.8201/8221 support zone will resume whole down trend from 0.9449 (2020 high) and carry larger bearish implications.
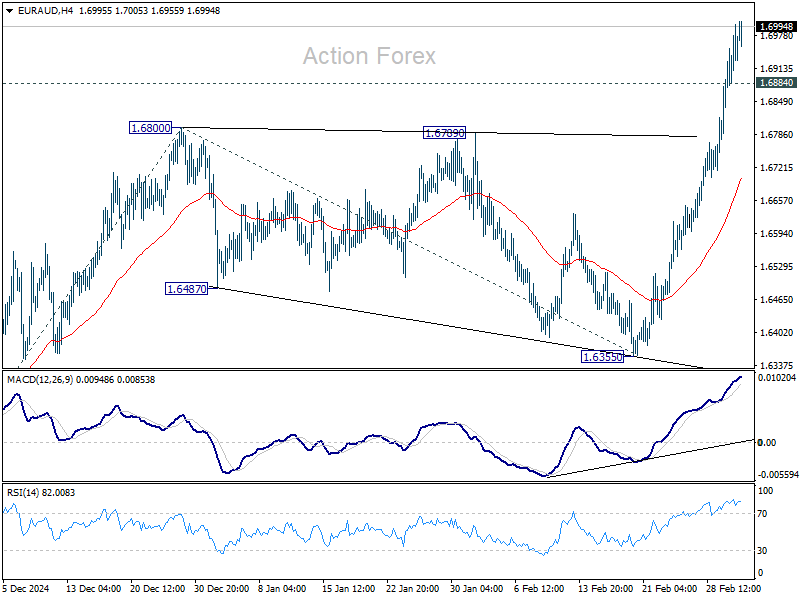
EUR/AUD Daily Outlook
Daily Pivots: (S1) 1.6855; (P) 1.6929; (R1) 1.7016; More...
Intraday bias in EUR/AUD remains on the upside for the moment. Current rise from 1.5963 should target 100% projection of 1.5963 to 1.6800 from 1.6355 at 1.7192, which is close to 1.7180 high. On the downside, below 1.6884 minor support will turn intraday bias neutral and bring consolidations first, before staging another rally.
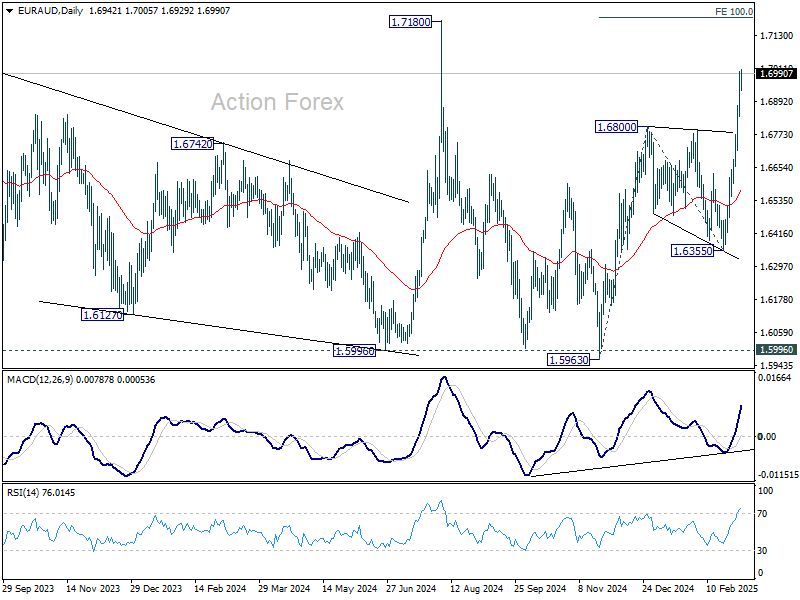
In the bigger picture, with 1.5996 key support (2024 low) intact, larger up trend from 1.4281 (2022 low) is still in favor to resume through 1.7180 at a later stage. Nevertheless, sustained break of 1.5996 will indicate that such up trend has completed and deeper decline would be seen.
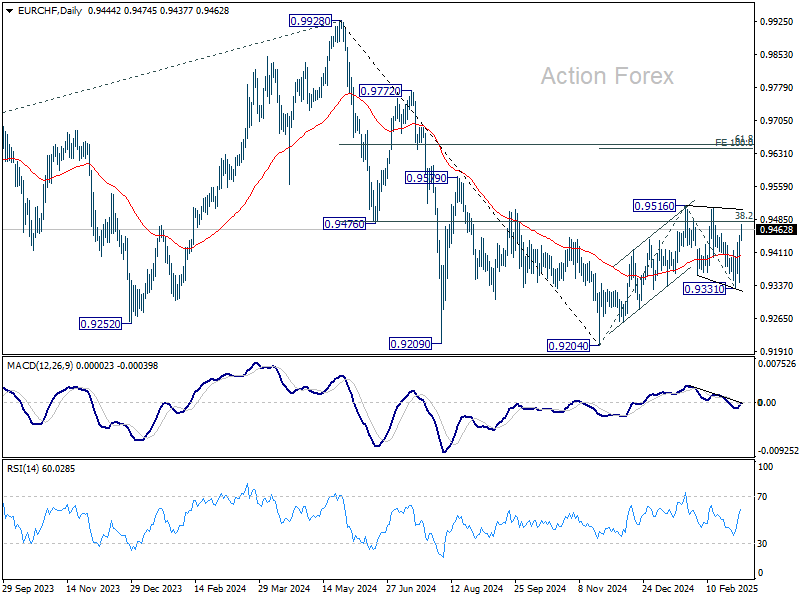
EUR/CHF Daily Outlook
Daily Pivots: (S1) 0.9381; (P) 0.9417; (R1) 0.9489; More....
Range trading continues in EUR/CHF and intraday bias stays neutral. On the upside, firm break of 0.95167 will resume the rebound from 0.9204 and target 100% projection of 0.8204 to 0.9516 from 0.9331 at 0.9643. Nevertheless, break of 0.9331 will resume the fall from 0.9516 to retest 0.9204 low.
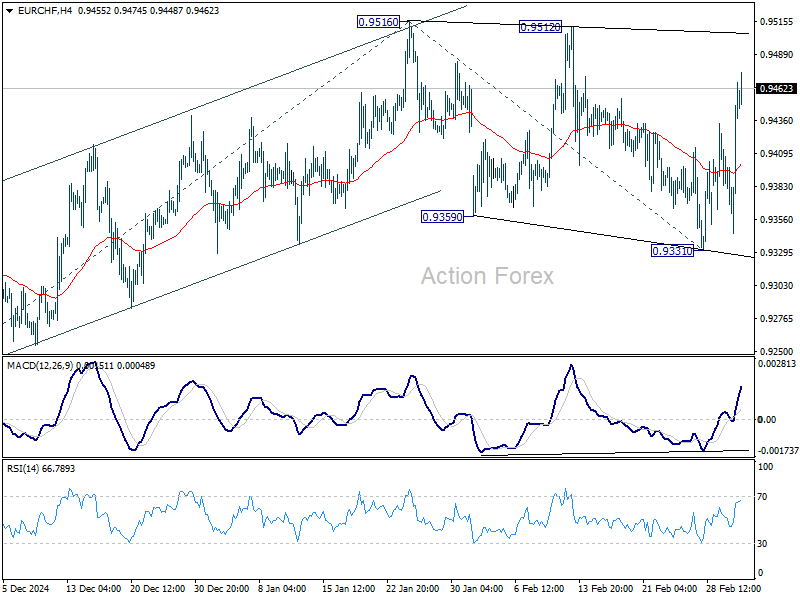
In the bigger picture, sustained trading above 38.2% retracement of 0.9928 to 0.9204 at 0.9481 should confirm that whole fall from 0.9928 (2024 high) has completed at 0.9204. Further rally should then be seen back to 61.8% retracement at 0.9651 and above. However, another rejection by 0.9481 will keep outlook bearish for extending larger down trend through 0.9204 at a later stage.