Sample Category Title
Gold Poised for a Rally as Support Builds from Multiple Factors
Gold is trading around 2,910 USD per troy ounce on Wednesday, pausing after the previous day's growth. The temporary slowdown comes as rising US Treasury bond yields exert pressure on prices.
Key drivers influencing gold prices
Despite this pause, gold remains near its record highs, supported by strong safe-haven demand amid escalating trade tensions. On Tuesday, the US implemented 25% tariffs on Canada and Mexico and a 10% tariff on China, worsening the global trade climate and triggering retaliatory measures.
US Commerce Secretary Howard Lutnick suggested that tariff reductions for Canada and Mexico may be possible in the future, which has slightly calmed market fears but has not eliminated concerns entirely.
Further bolstering gold’s appeal as a safe-haven asset is the broader geopolitical landscape. The US suspended military aid to Ukraine, while reports emerged suggesting a potential easing of sanctions against Russia. These developments increase uncertainty in global markets, enhancing gold’s attractiveness.
In the near term, market participants are awaiting key US economic reports, including the ISM services PMI and employment data. These indicators will provide further clues about the Federal Reserve’s monetary policy direction. Recent data suggests growing economic strains, strengthening the argument for additional rate cuts, which would further support gold prices.
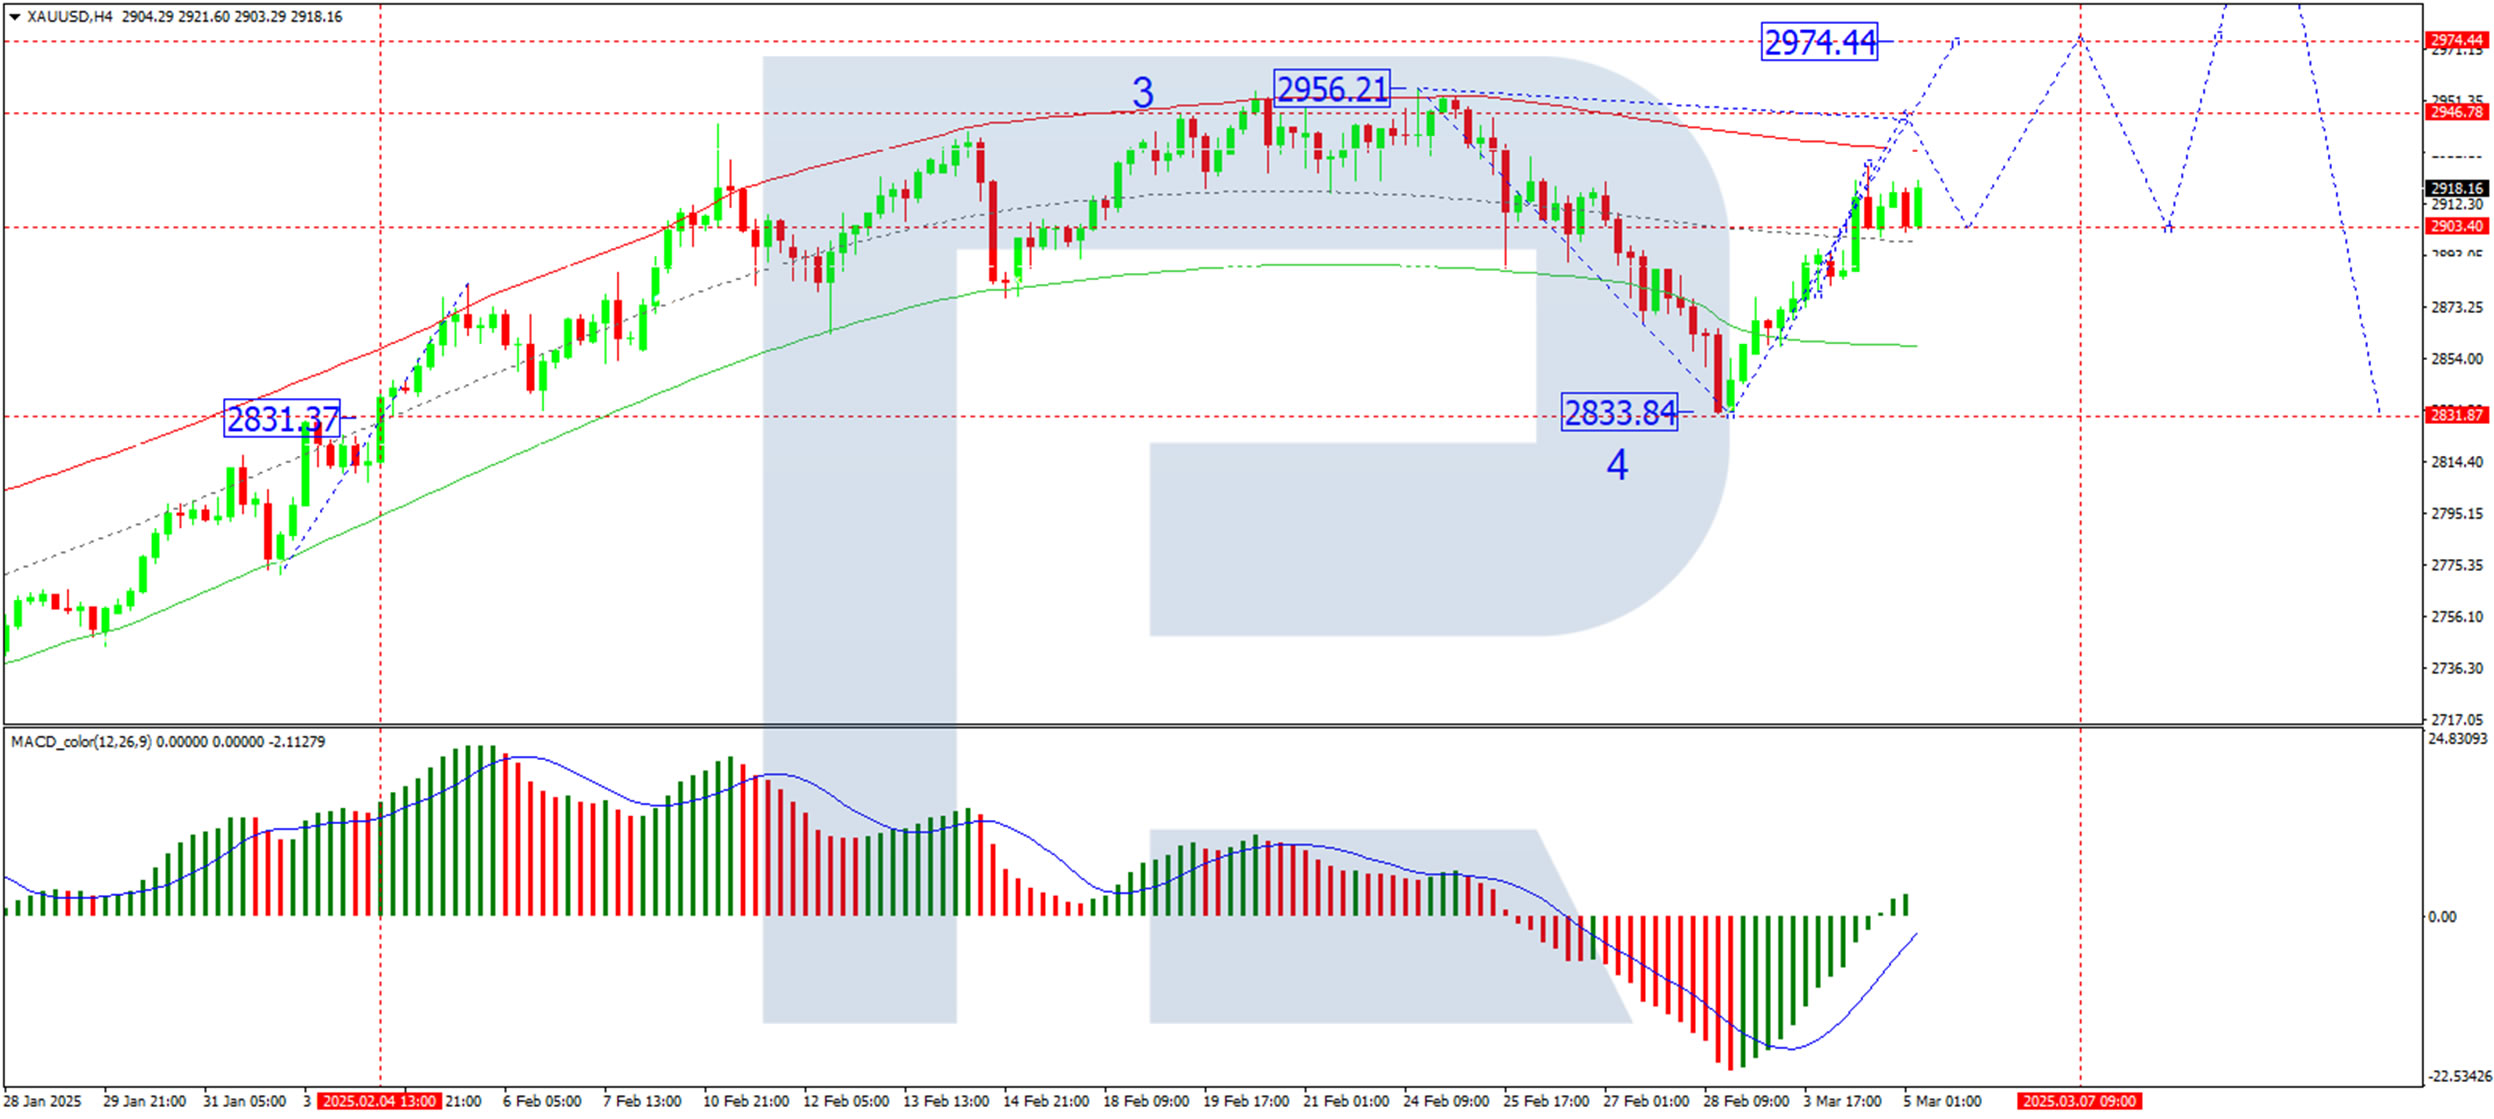
Technical analysis of XAU/USD
On the H4 chart, XAU/USD has formed a growth wave to 2,900. Currently, the market is consolidating around this level. A breakout to the upside is expected, with a target of 2,974 as the next local resistance level. After reaching this target, a correction towards 2,900 could follow. The MACD indicator confirms this scenario, with its signal line positioned below zero but trending upwards, indicating strong bullish momentum.
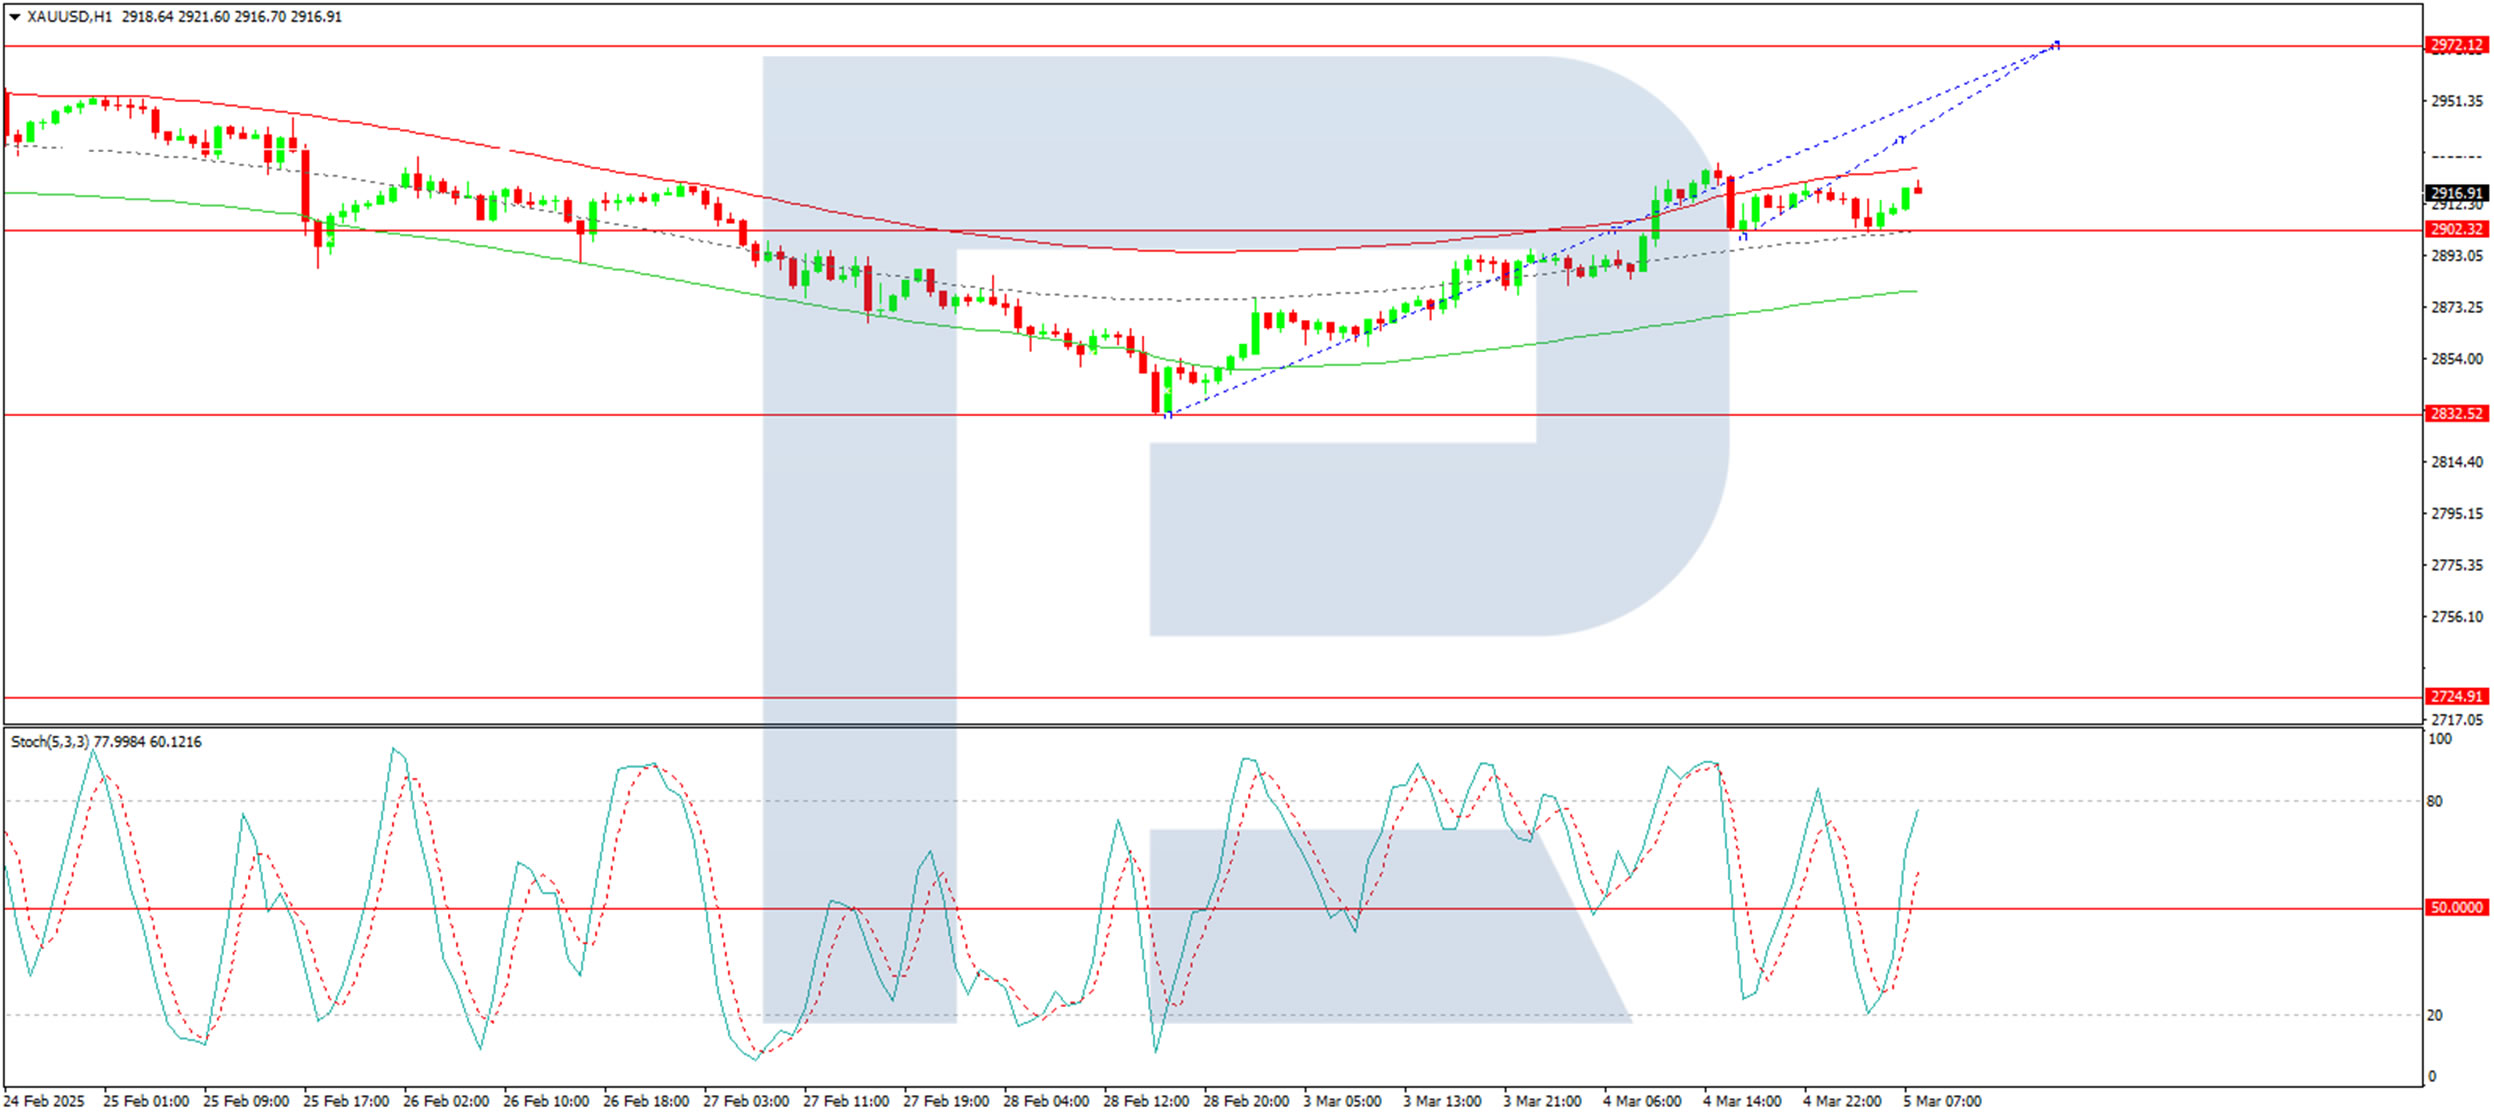
On the H1 chart, gold has already executed a growth wave to 2,900, forming a consolidation range at this level. If the price breaks downward, a correction to 2,880 is possible before another upward impulse begins. A bullish breakout from the consolidation range would open the potential for a direct rally towards 2,974. The Stochastic oscillator supports this view, with its signal line above 50 and pointing towards 80, indicating a continuation of upward momentum.
Conclusion
Gold remains well-supported by trade tensions, geopolitical uncertainties, and expectations of Federal Reserve rate cuts. While a temporary pullback could occur, the broader trend suggests further upside towards 2,974. Market participants should watch upcoming US economic data releases for additional confirmation of gold’s next move.
Australian GDP Beats Forecast, Aussie Edges Higher
The Australian dollar has extended its gains on Wednesday. AUD/USD is trading at 0.6271 in the European session, up 0.20% on the day. The Australian dollar jumped 0.75% on Tuesday, driven by the hawkish Reserve Bank of Australia minutes and a solid retail sales report.
Australian GDP rises 1.3%
Australia’s economy expanded by 1.3% y/y in the fourth quarter of 2024, up from 0.8% in Q3 and above the market estimate of 1.2% and the RBA’s forecast of 1.1%. This marked the fastest pace of growth since Q4 2023.
Quarterly, GDP grew by 0.6%, following 0.3% in Q3 and higher than the market estimate of 0.5%. This was the fastest pace of growth since Q4 2022. The strong gain was driven by strong increases in household spending and exports.
The positive GDP report follows last week’s rate cut, after the central bank held rates for over a year. The cash rate is currently at 4.10%, its lowest level since Oct. 2023. The RBA has remained hawkish, even with the rate cut. The minutes of the meeting stated that members remained concerned that further cuts could jeopardize maintaining inflation in the target range of 2%-3%.
The markets are more dovish and expect the cash rate to fall to 3.6% by the end of the year, which would mean two more cuts of 25 basis points. The central bank’s rate path will largely depend on the inflation levels as well as the strength of the labor market, which has been surprisingly robust despite high interest rates and a weak economy.
In China, this week’s PMIs are pointing to slightly stronger growth. The Caixin Manufacturing PMI for February improved to 50.8, up from 50.1 in January and above the market estimate of 50.3. The Caixin Services PMI rose to 51.4, up from 51.0 in January and above the market estimate of 50.8.
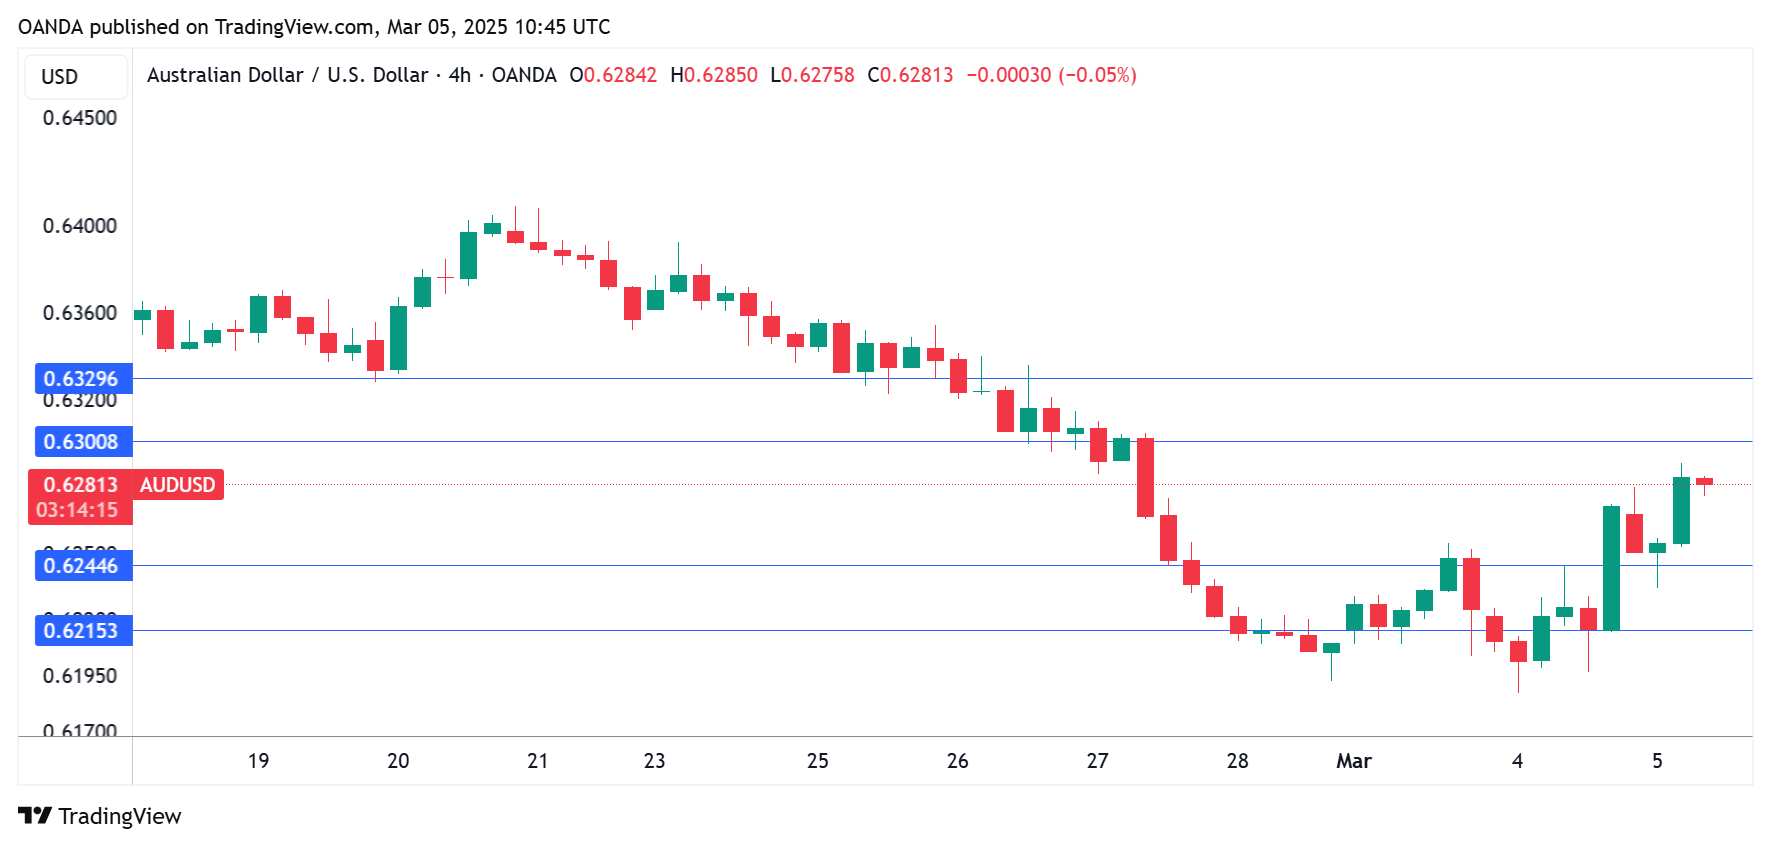
AUD/USD Technical
- AUD/USD is testing resistance at 0.6228. Above, there is resistance at 0.6251
- 0.6200 and 0.6177 are providing support
XAU/USD: Weaker Dollar and Trade War Uncertainty to Continue to Support
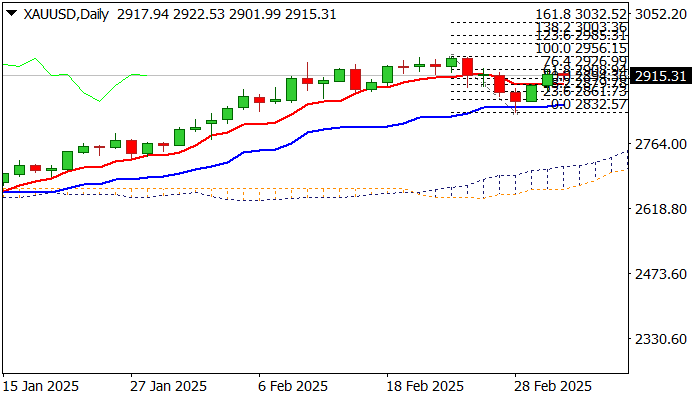
Gold remained steady on Wednesday and in consolidation mode after strong rally in past two days, which reversed around 76.4% of pullback from new record high ($2956) to $2832 (correction low).
Weaker dollar across the board continues to fuel gold advance with revived safe-haven demand on strong uncertainty over the impact of trade war expected to additionally support metal’s price.
Return and close above $2900 level generated fresh positive signal, although situation is still vulnerable as daily studies are mixed (fresh negative momentum is conflicting MA’s in bullish configuration.
Near-term action is expected to remain biased higher while holding above $2900/$2894 supports (psychological / daily Tenkan-sen) with firm break of cracked Fibo barrier at $2926 (76.4%) to bring bulls fully in play for renewed attack at all-time high and possible extension higher on break.
Res: 2926; 2942; 2956; 2985.
Sup: 2908; 2900; 2894; 2879.
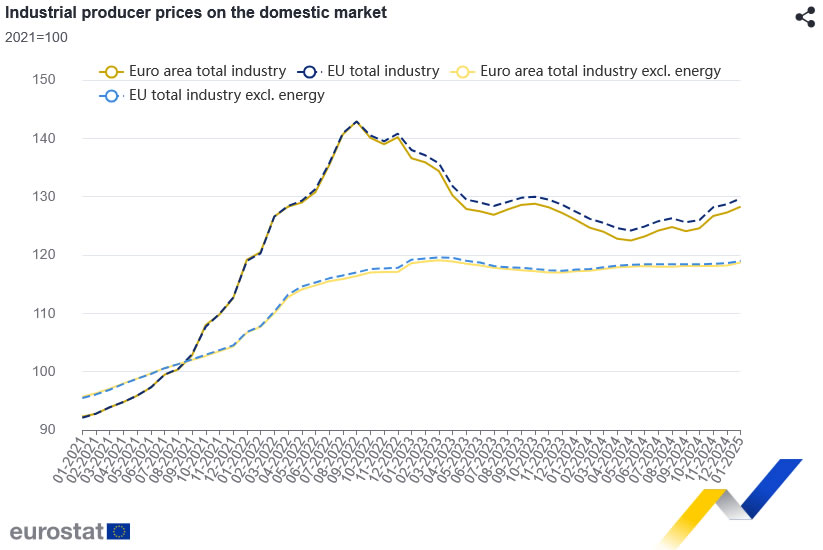
Eurozone PPI up 0.8% mom 1.8% yoy in Jan, above expectations.
Eurozone producer prices rose sharply by 0.8% mom and 1.8% yoy in January, exceeding expectations of 0.3% mom and 1.4% yoy, respectively.
The monthly increase in Eurozone PPI was primarily driven by a 1.7% mom jump in energy prices, while capital goods and durable consumer goods also saw notable gains of 0.7% mom and 0.6%, respectively. Intermediate goods prices edged up by 0.3% mom, while non-durable consumer goods saw a modest 0.2% mom rise.
The broader EU also recorded a 0.8% mom, 1.8% yoy in producer prices. Among individual member states, Ireland saw the largest monthly price jump at 6.2%, followed by Bulgaria (+5.4%) and Sweden (+2.3%).
However, not all countries experienced inflationary pressures, as Portugal (-2.2%), Austria (-0.6%), Slovenia (-0.5%), and Cyprus (-0.3%) registered price declines.
EUR/JPY Moves Swiftly Up Near Familiar Support
- EUR/JPY climbs higher after finding solid ground.
- Technical signals are promising.
- Bullish trend reversal remains uncertain.
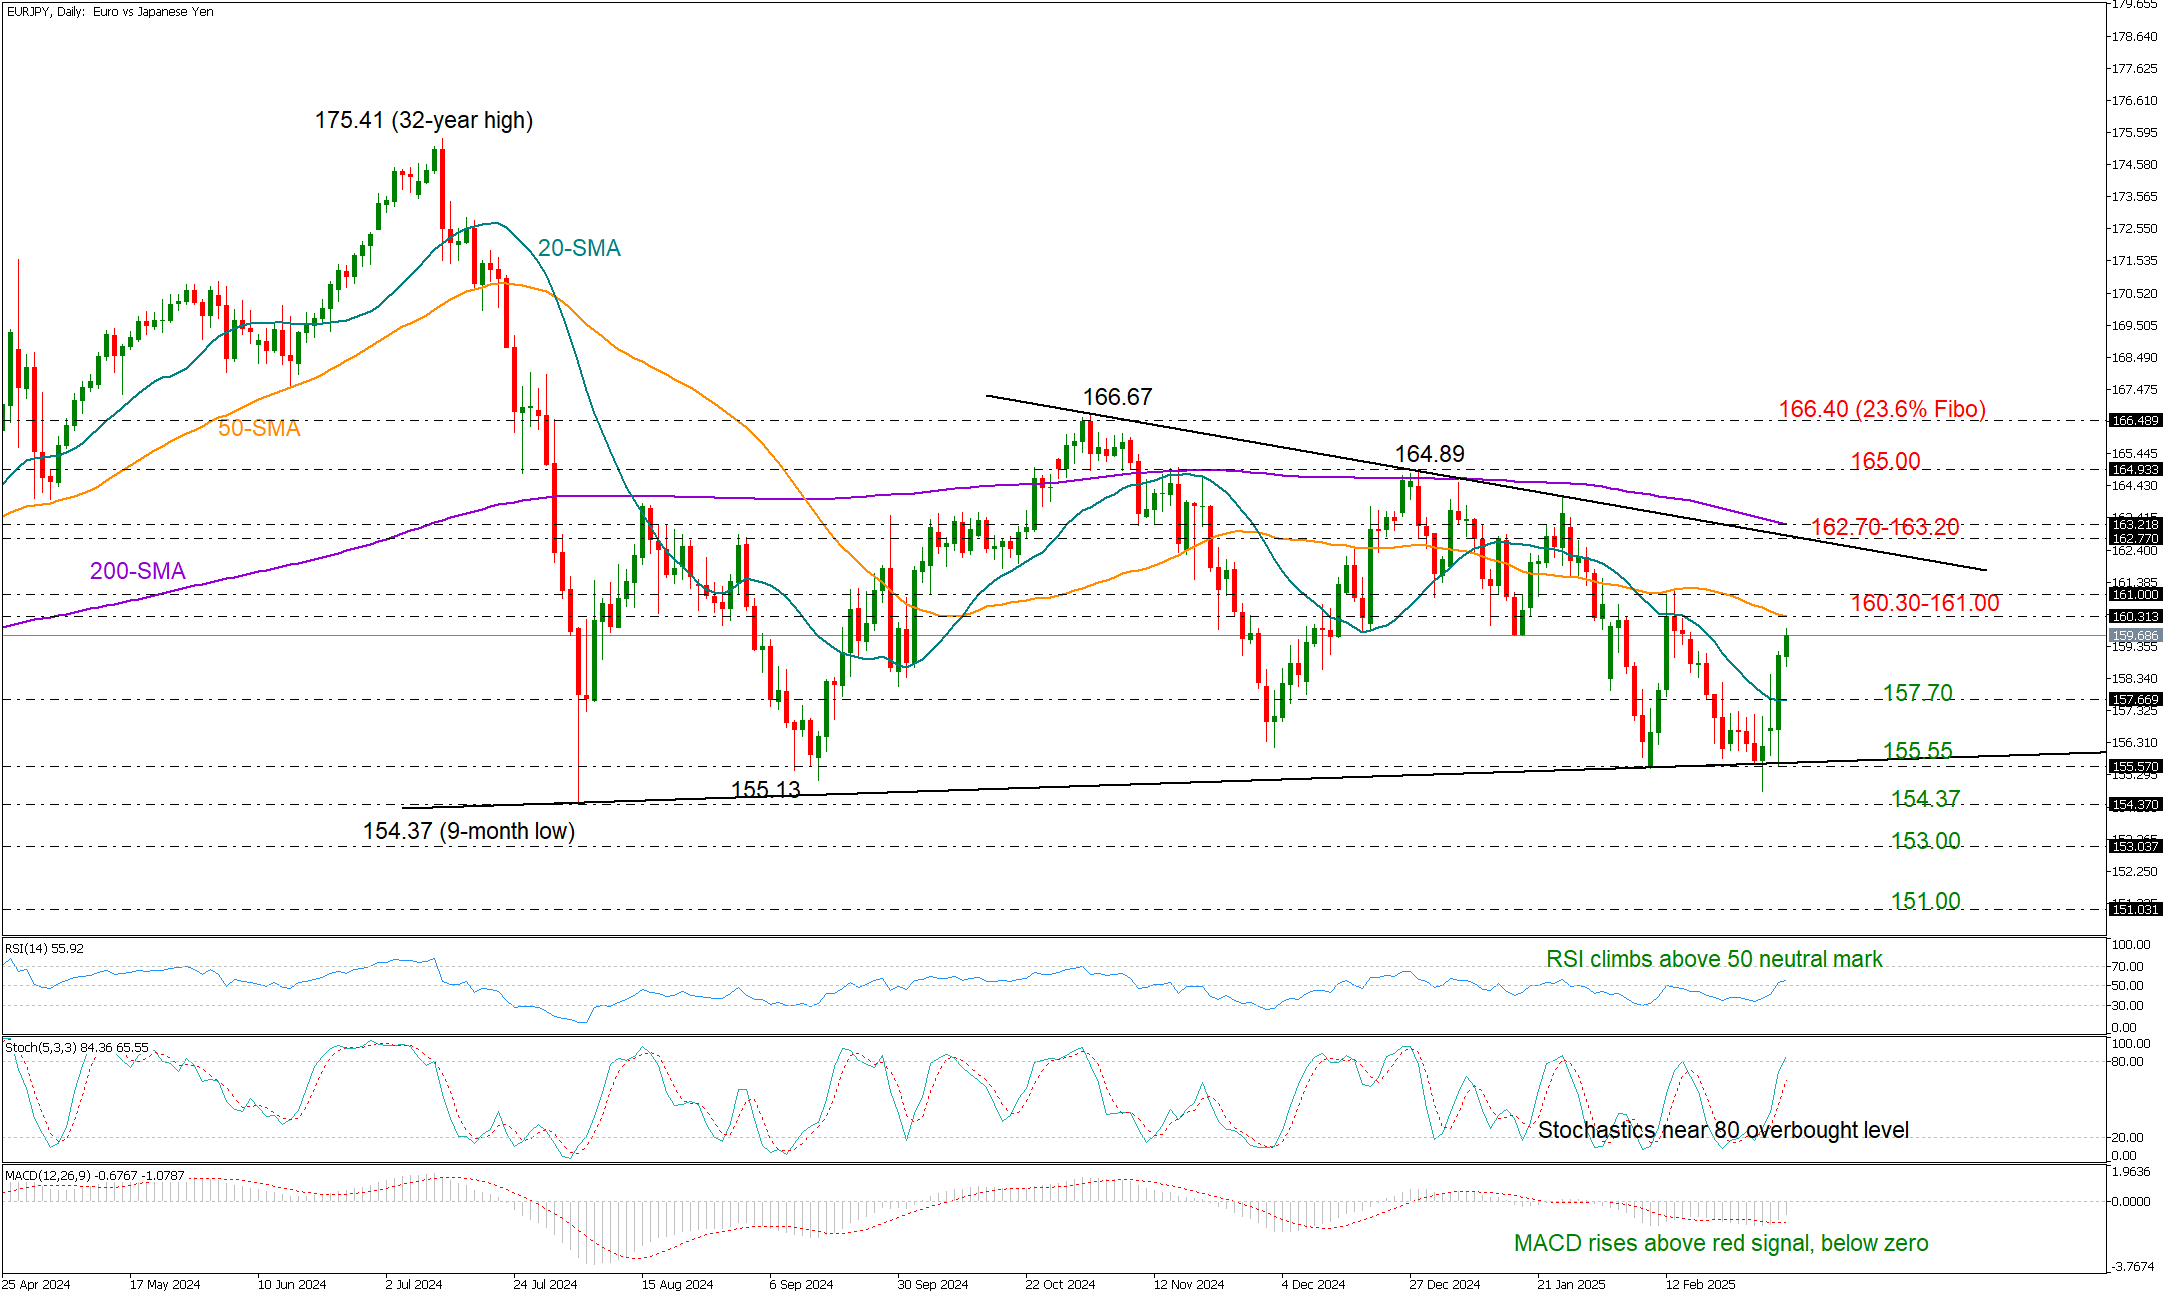
EURJPY picked up steam on the back of news that Germany plans to inject hundreds of billions into defense and infrastructure investments, rapidly approaching the 160.00 mark after bouncing off the well-tested 155.50 support level.
Currently, the pair is setting its sights on the 50-day simple moving average (SMA) at 160.30 and the psychologically significant 161.00 level. A decisive close above this region could pave the way for a challenge of the resistance trendline at 162.70 and the 200-day SMA at 163.20. However, for a true bullish trend reversal to materialize, the rally would need to convincingly extend beyond 165.00.
Momentum indicators suggest further upside in the near term. The RSI is strengthening above the neutral 50 mark, and the MACD is widening its gap above the red signal line – both encouraging signs for buyers. That said, the stochastic oscillator’s entry into overbought territory hints at a possible consolidation phase before the next move.
On the downside, if the bears regain control, initial support may emerge near the 20-day SMA around 157.70, followed by the well-established 155.55 base. A break below the latter could put sellers back in the driver’s seat, with 154.37 – the area that has acted as a buffer multiple times in the past two years – standing as the next line of defense. A failure to hold there might clear the way towards the 151.00 level.
Overall, EURJPY appears poised to maintain its positive momentum in the short term, but whether this recovery can evolve into a sustained bullish breakout remains to be seen, as key obstacles continue to loom ahead.
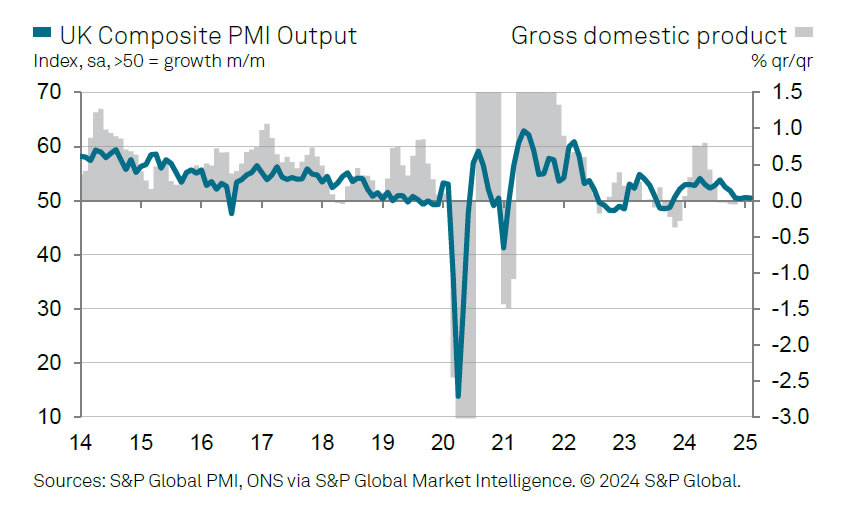
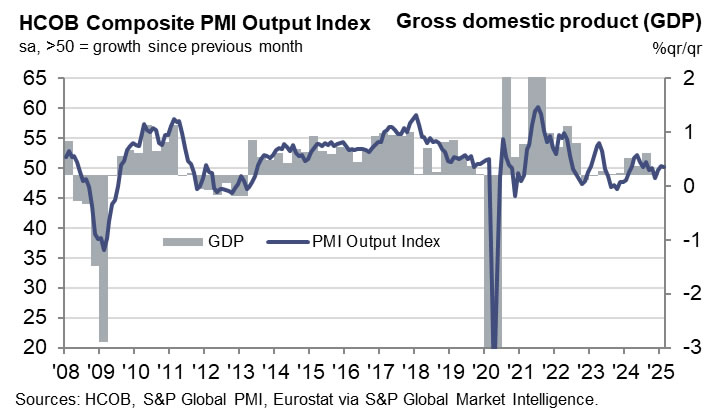
UK PMI services finalized at 51, stagflation risks grow
The UK services sector showed little improvement in February, with PMI Services finalized at 51.0, slightly up from January’s 50.8 but still well below its long-run average of 54.3. Meanwhile, PMI Composite edged lower from 50.6 to 50.5, signaling stagnant overall economic activity as demand conditions continue to weaken both domestically and in export markets.
Tim Moore, Economics Director at S&P Global Market Intelligence, warned of "elevated risk of stagflation on the horizon". New orders falling at their sharpest rate in over two years. Rising payroll costs and economic uncertainty have eroded business confidence, bringing sentiment to its lowest level since December 2022.
Concerns over slowing growth and persistent inflation pressures have also led to continued job losses, with employment in the services sector contracting for a fifth straight month—the longest period of decline outside of the pandemic since early 2011.
Eurozone PMI composite finalized at 50.2, barely grow for two months
Eurozone economy showed little momentum in February, with PMI Services finalizing at 50.6, down from 51.3 in January, while PMI Composite was unchanged at 50.2.
The picture was mixed across the region with Spain, Ireland, and Italy showing signs of expansion, while Germany’s services sector slowed and France’s continued its sharp contraction, posting its lowest reading in 13 months at 45.1.
Cyrus de la Rubia, Chief Economist at Hamburg Commercial Bank, noted that services growth is barely offsetting the prolonged slump in manufacturing. He pointed to rising input costs, particularly wage pressures, as a growing concern for ECB.
Political uncertainty in key economies is also weighing on sentiment. France’s services sector is deteriorating at a much faster pace, likely influenced by unresolved political instability. In contrast, Germany’s services sector, though slowing, remains in expansion, with hopes that post-election stability could support economic recovery.
However, with external risks from trade tensions and weak consumer spending, a decisive rebound in Eurozone remains uncertain.
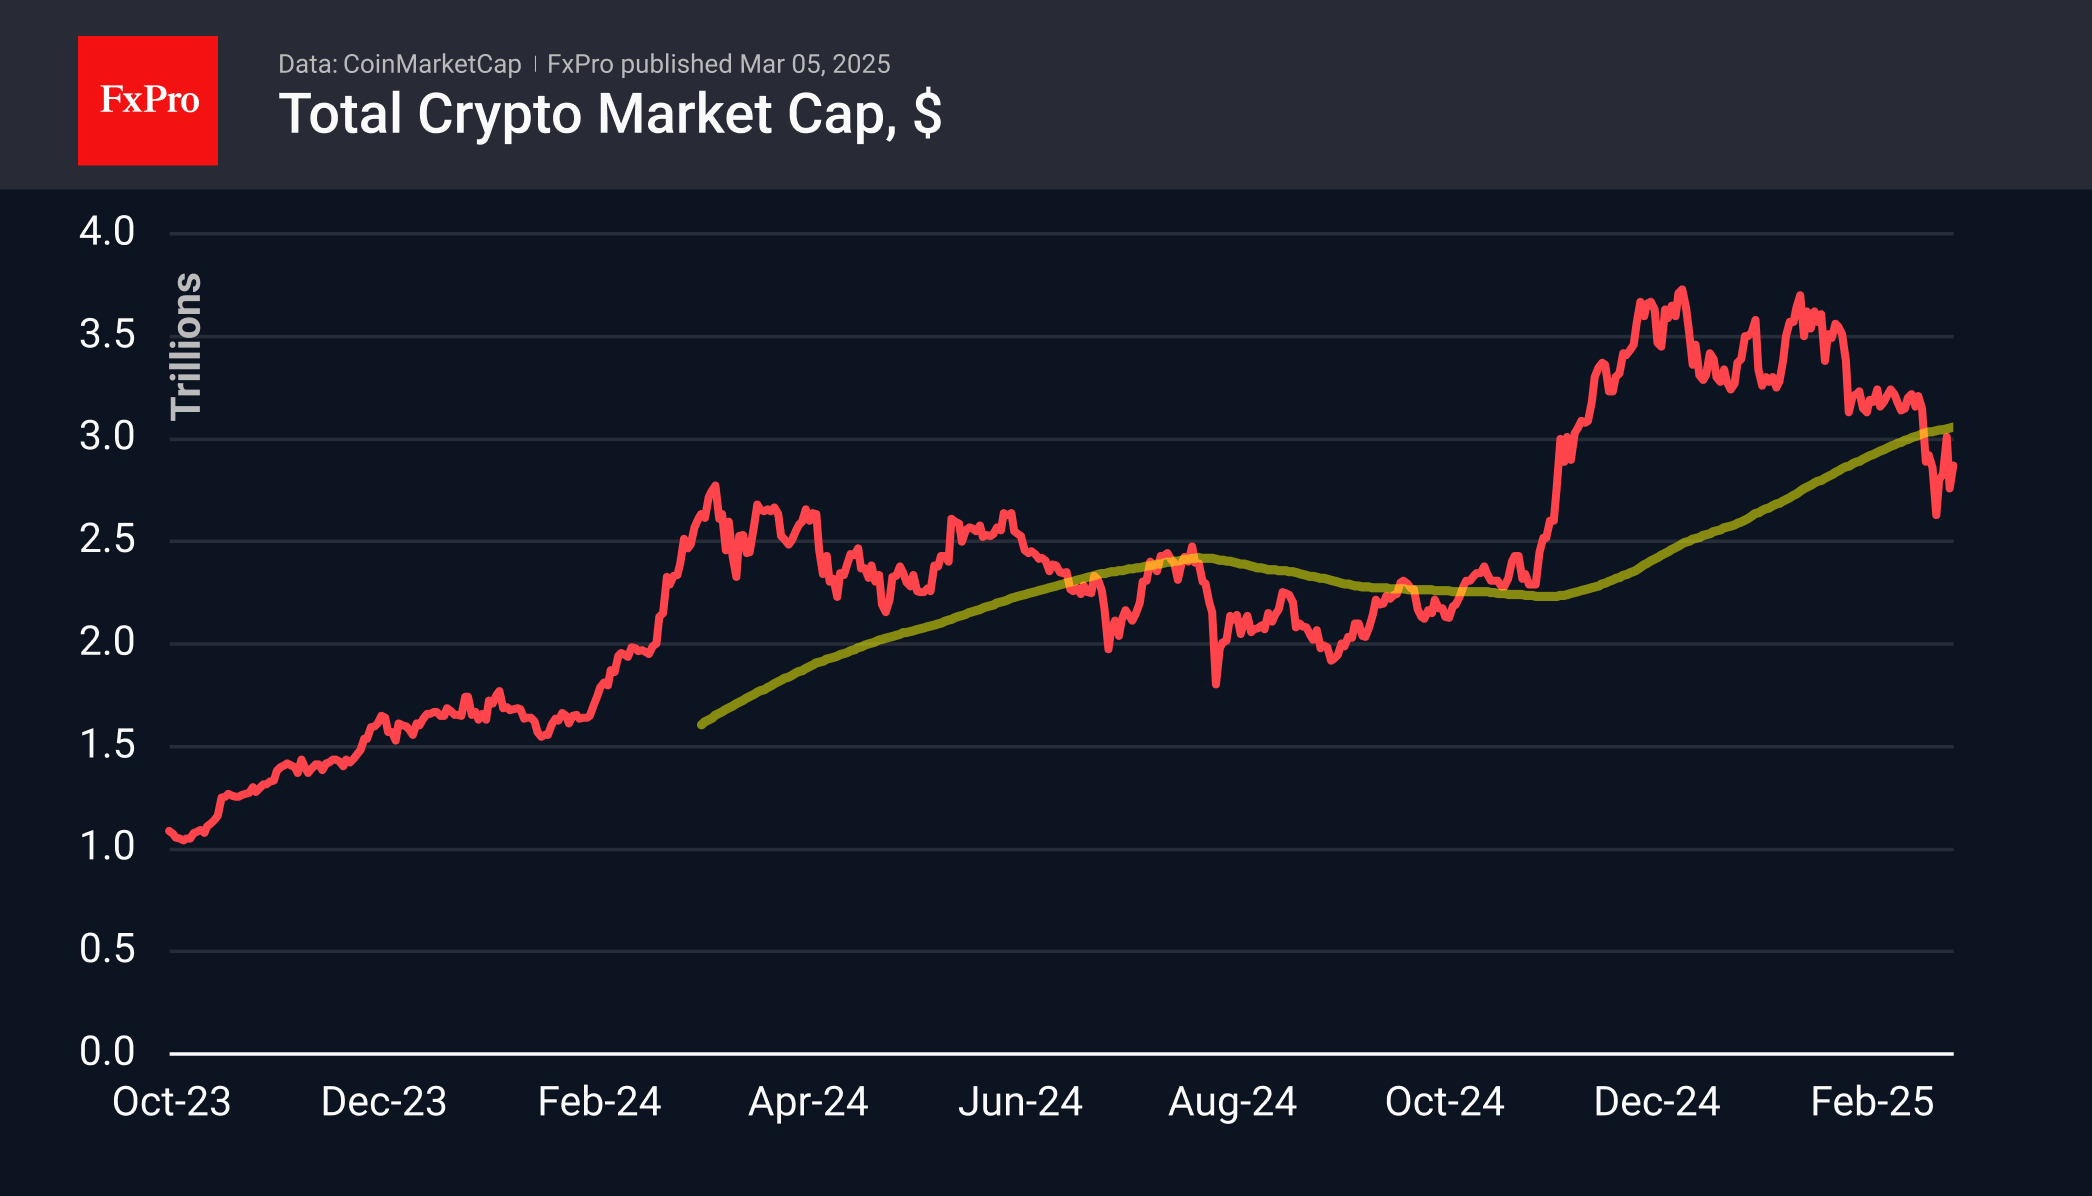
Crypto’s Unconvincing Rebound
Market Picture
The crypto market has gained 4% in cap in 24 hours, but this looks more like a wild swing than the start of a recovery. The $2.87 trillion market remains below the long-term trend line of the 200-day moving average, near $3 trillion, and the initiative has shifted back to Bitcoin.
Bitcoin’s share of the crypto market exceeds 60%, which is typical in periods of fear. This time, we also note the decline in Ethereum’s share to 9%, a low in almost five years. This negative trend has been maintained for the last two years with brief spikes.
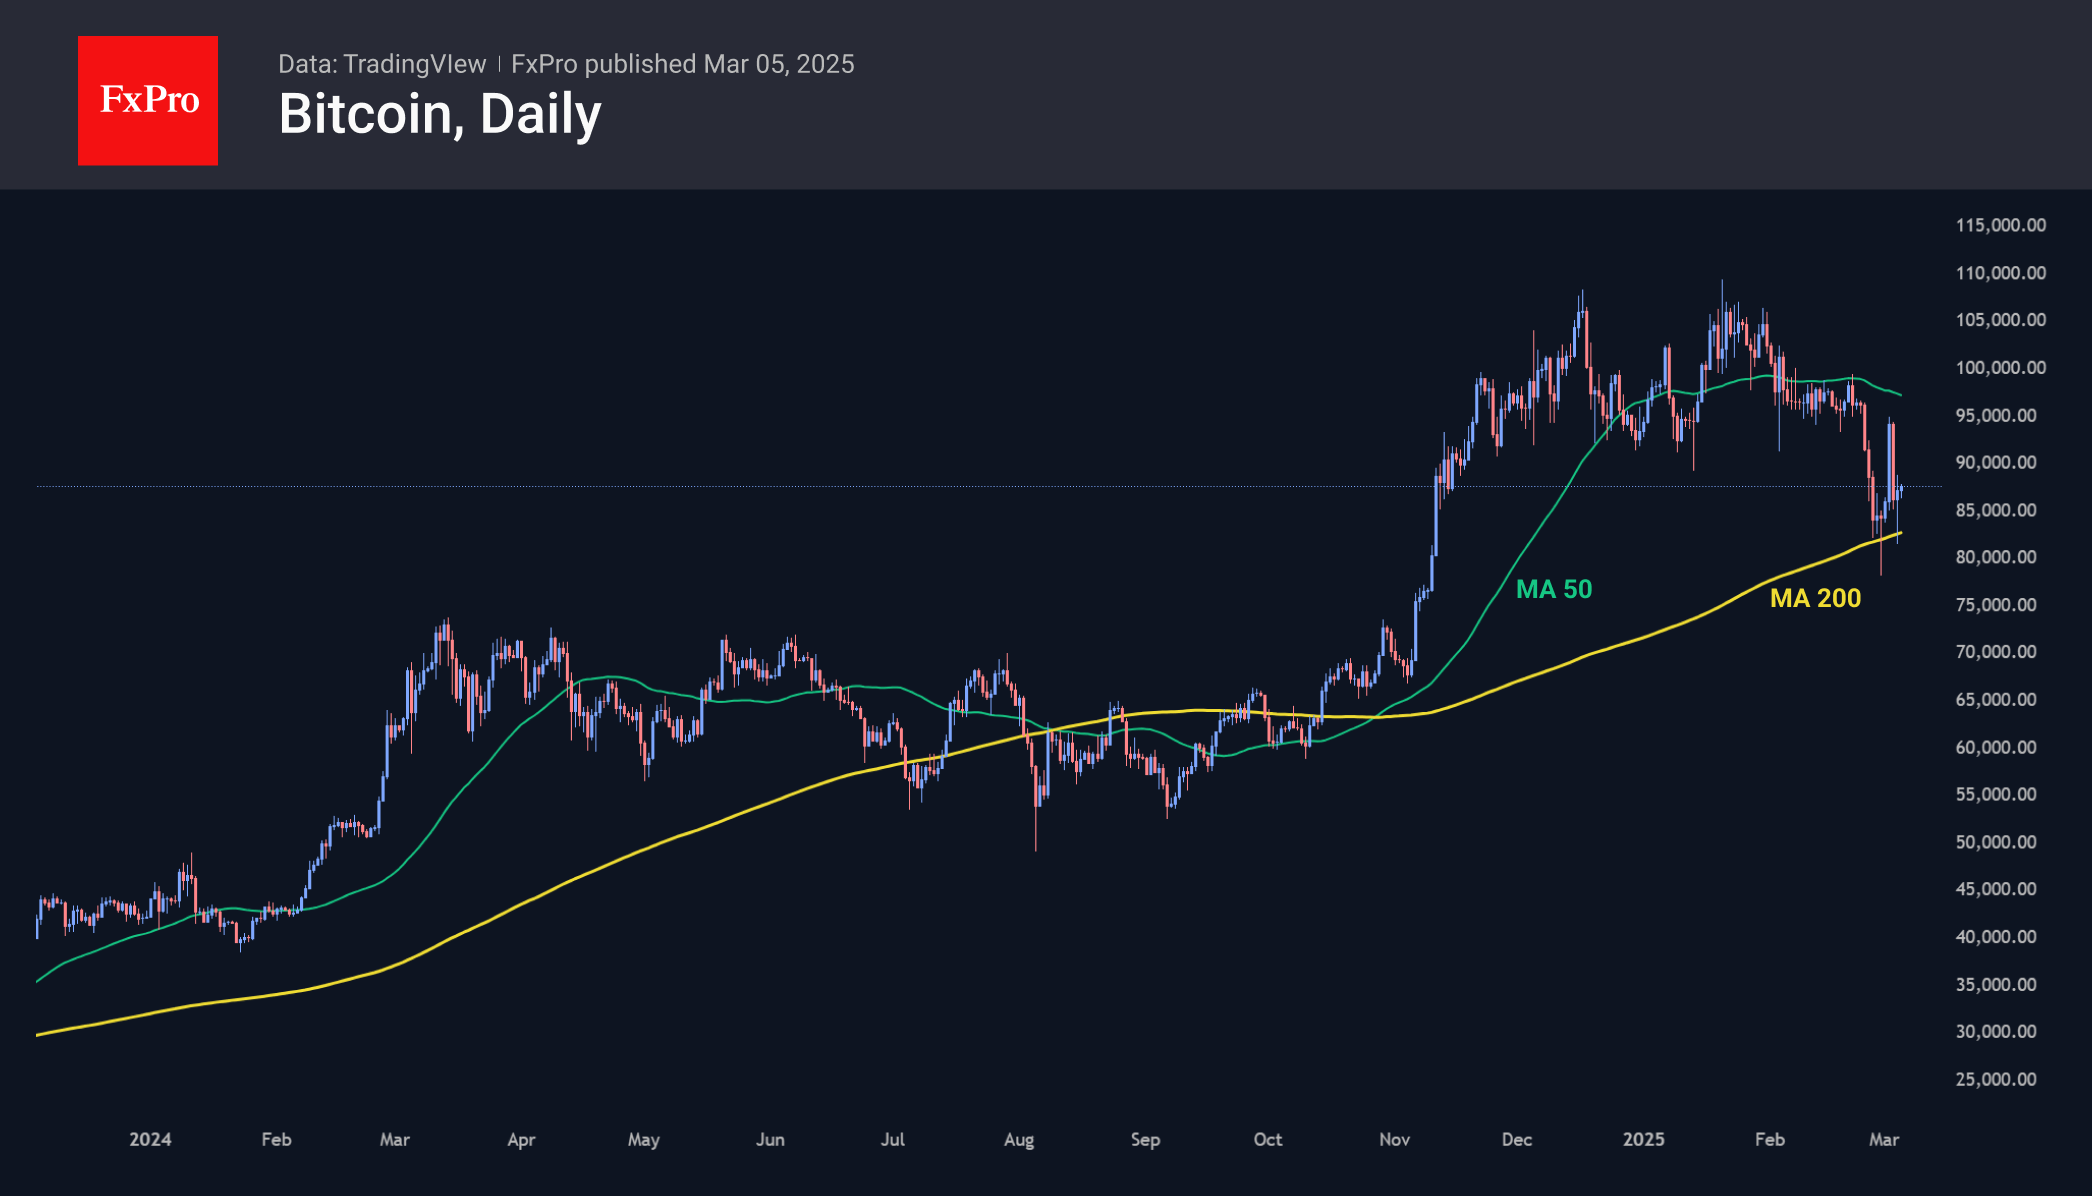
Bitcoin continues to flirt with the 200-day MA, popping out on Tuesday shortly after touching that level below $83,000. Wednesday morning’s market dynamics reflect cautious attempts to form a bottom. A return to the area above the 50-day at $97,000 is a marker of bullish success.
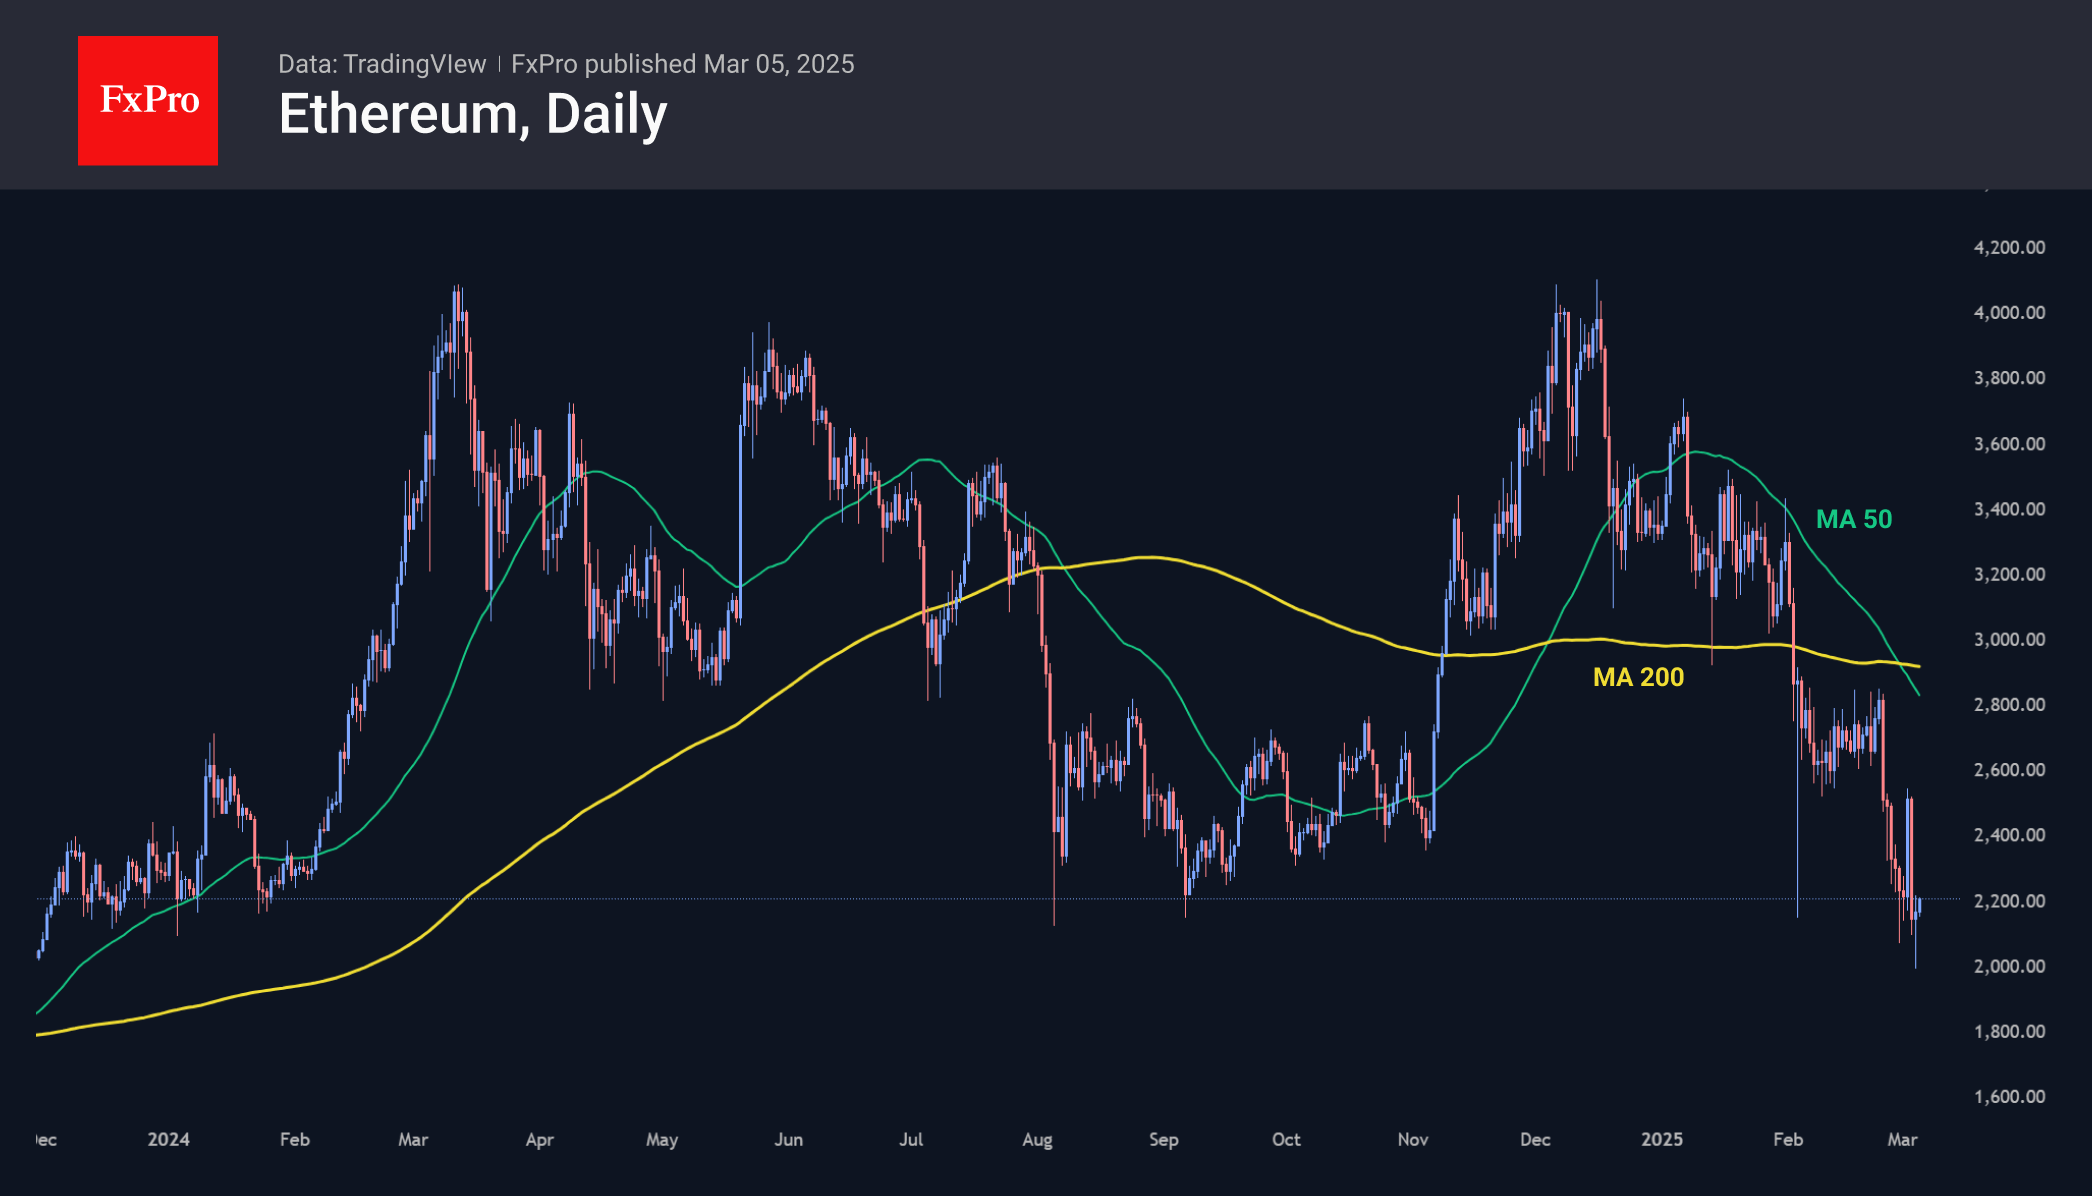
Ethereum is trading below $2200. Earlier in the week, it dipped below $2000 at the peak of the decline but stabilised near the support line in early 2024. This dangerous proximity to the lower end of the trading range keeps our focus on ETH as the market’s canary, which is having a tough time right now.
News Background
Net outflows from spot Ethereum-ETFs in the US fell to $12.1 million on 3 March, a negative trend for the eighth consecutive trading session. Total inflows since the product launch on 23 July fell to $2.81bn.
President of Euro Pacific Capital and bitcoin critic Peter Schiff called on Congress to launch an investigation into US President Donald Trump’s actions in the field of cryptocurrencies. He said the politician’s posts on the Truth Social platform, which led to a sharp rise in cryptocurrencies and then their fall, could have been part of a pump-and-dump scheme.
Affiliates of the collapsed FTX and Alameda addresses unlocked 3.03 million SOLs worth $431 million, Lookonchain said. This is the largest withdrawal since November 2023. Most of the tokens were sold through Binance and Coinbase at an average price of $125.8 per coin.
EUR/USD Rallies While USD/CHF Dips Further
EUR/USD started a fresh increase above the 1.0550 resistance. USD/CHF declined and now struggling below the 0.8950 resistance.
Important Takeaways for EUR/USD and USD/CHF Analysis Today
- The Euro started a decent recovery wave from the 1.0360 zone against the US Dollar.
- There is a connecting bullish trend line forming with support near 1.0570 on the hourly chart of EUR/USD at FXOpen.
- USD/CHF declined below the 0.8975 and 0.8950 support levels.
- There is a short-term contracting triangle forming with resistance near 0.8910 on the hourly chart at FXOpen.
EUR/USD Technical Analysis
On the hourly chart of EUR/USD at FXOpen, the pair started a fresh increase from the 1.0360 zone. The Euro cleared the 1.0450 resistance to move into a bullish zone against the US Dollar, as mentioned in the last analysis.
The bulls pushed the pair above the 50-hour simple moving average and 1.0550. Finally, the pair tested the 1.0635 resistance. A high was formed near 1.0637 and the pair is now consolidating gains above the 23.6% Fib retracement level of the upward wave from the 1.0359 swing low to the 1.0637 high.
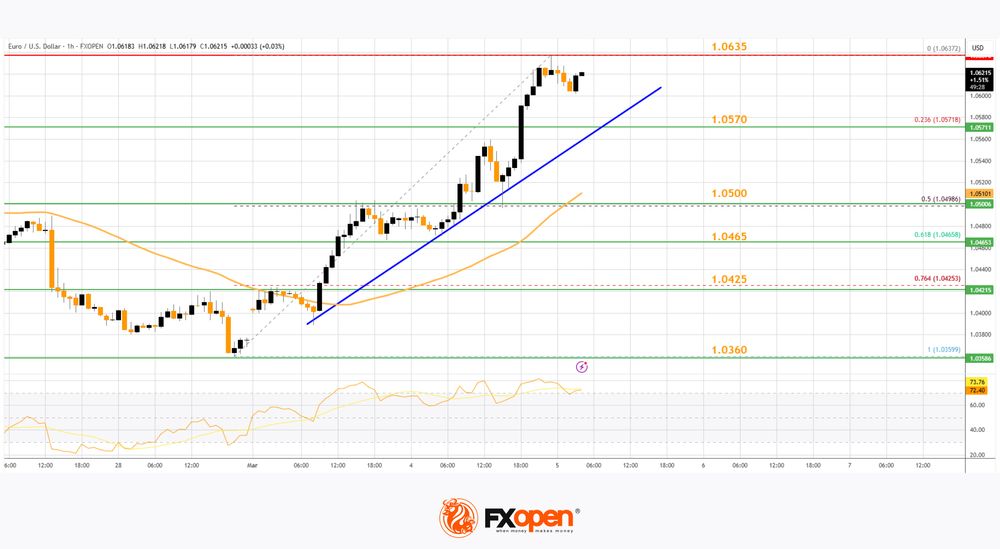
Immediate support on the downside is near a connecting bullish trend line at 1.0570. The next major support is the 1.0500 level and the 50% Fib retracement level of the upward wave from the 1.0359 swing low to the 1.0637 high.
A downside break below the 1.0500 support could send the pair toward the 1.0465 level. Any more losses might send the pair into a bearish zone toward 1.0425.
Immediate resistance on the EUR/USD chart is near the 1.0635 zone. The first major resistance is near the 1.0665 level. An upside break above the 1.0665 level might send the pair toward the 1.0720 resistance.
The next major resistance is near the 1.0750 level. Any more gains might open the doors for a move toward the 1.0800 level.
USD/CHF Technical Analysis
On the hourly chart of USD/CHF at FXOpen, the pair started a fresh decline from well above the 0.9000 zone. The US Dollar dropped below the 0.8975 support to move into a negative zone against the Swiss Franc.
The bears pushed the pair below the 50-hour simple moving average and 0.8920. Finally, the bulls appeared near the 0.8870 level. A low was formed near 0.8871 and the pair is now consolidating losses.
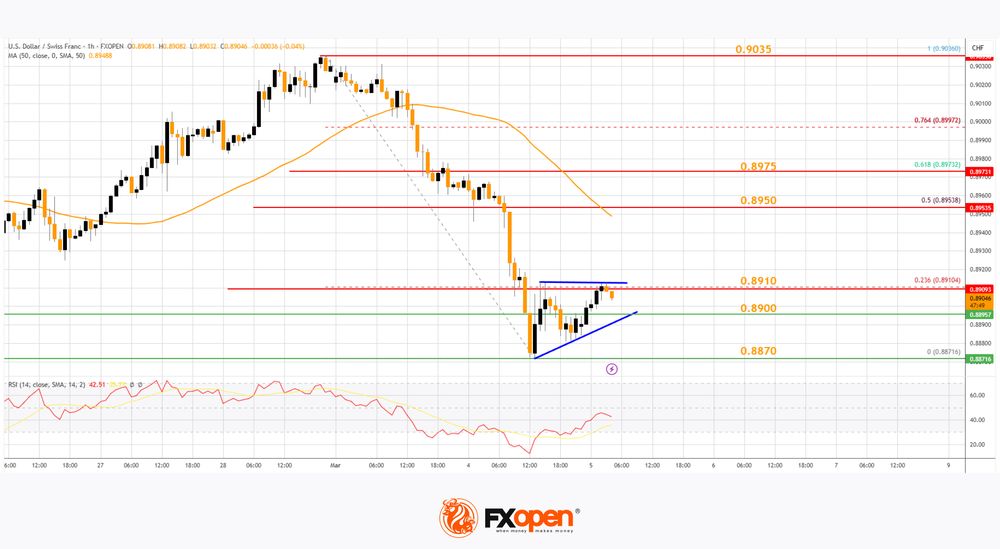
There was a minor increase and the pair tested the 23.6% Fib retracement level of the downward move from the 0.9036 swing high to the 0.8871 low. On the upside, the pair could face resistance near the 0.8910 level.
There is also a short-term contracting triangle forming with resistance near 0.8910. The next major resistance is near the 50% Fib retracement level of the downward move from the 0.9036 swing high to the 0.8871 low at 0.8950, above which the pair could test the 0.8975 level.
If there is a clear break above the 0.8975 resistance zone, the pair could start another increase. In the stated case, it could even surpass 0.9000.
On the downside, immediate support on the USD/CHF chart is 0.8900. The first major support is near the 0.8870 level. The next major support is near 0.8850. Any more losses may possibly open the doors for a move toward the 0.8820 level in the coming days.
Trade over 50 forex markets 24 hours a day with FXOpen. Take advantage of low commissions, deep liquidity, and spreads from 0.0 pips. Open your FXOpen account now or learn more about trading forex with FXOpen.
This article represents the opinion of the Companies operating under the FXOpen brand only. It is not to be construed as an offer, solicitation, or recommendation with respect to products and services provided by the Companies operating under the FXOpen brand, nor is it to be considered financial advice.
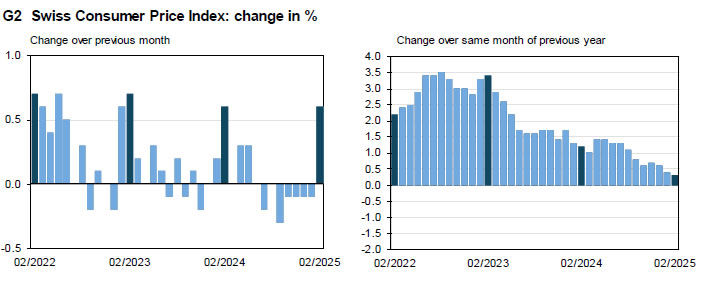
Swiss annual CPI ticks down to 0.3% yoy, remains weak
Swiss inflation accelerated on a monthly basis in February, with CPI rising 0.6% mom, slightly above the expected 0.5%. Core CPI, which excludes fresh and seasonal products, energy, and fuel, increased by 0.7% mom. The rise was driven by both domestic and imported product prices, which climbed 0.5% mom and 0.9% mom, respectively.
However, the broader inflation trend remains subdued. On a year-over-year basis, headline CPI slowed to 0.3% yoy from 0.4% yoy, though it was still slightly above expectations of 0.2% yoy. Core CPI remained steady at 0.9% yoy. While domestic product price inflation eased from 1.0% yoy to 0.9% yoy, imported prices continued to contract, staying at -1.5% yoy.