
Sample Category Title
USD/CAD Weekly Outlook
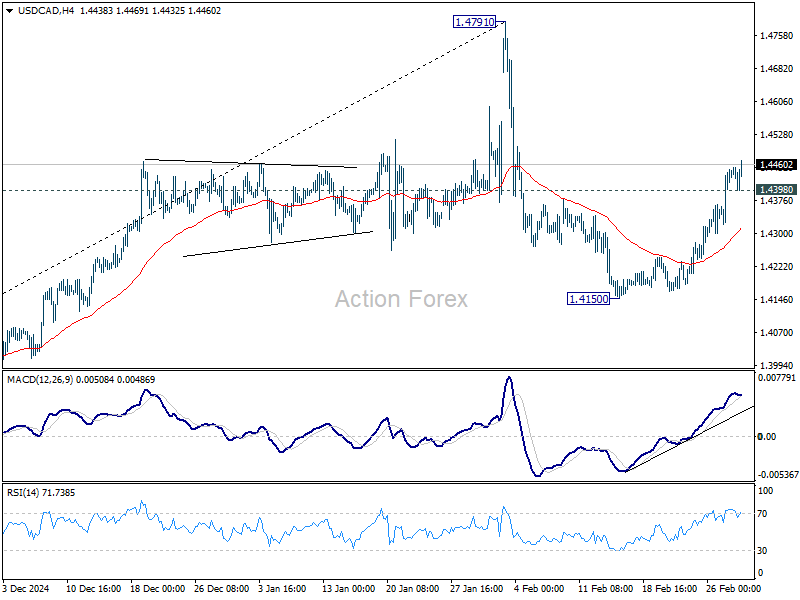
USD/CAD's strong rally last week suggests that corrective pull back from 1.4791 has already completed at 1.4150. Initial bias stays on the upside this week for retesting 1.4791. Strong resistance might be seen there to limit upside on first attempt. But decisive break there will confirm resumption of larger up trend. On the downside, below 1.4398 minor support will turn intraday bias neutral again first.
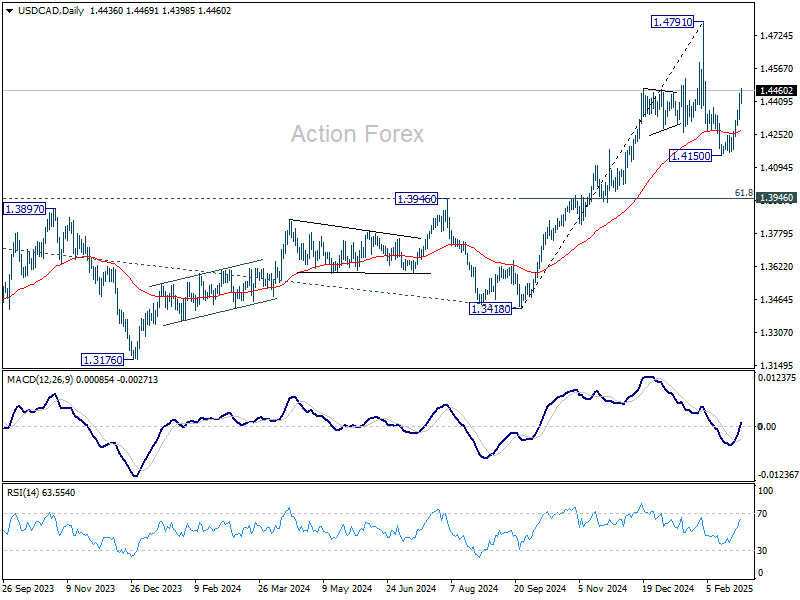
In the bigger picture, long term up trend is tentatively seen as resuming with prior breach of 1.4667/89 key resistance zone (2020/2015 highs). Next target is 100% projection of 1.2401 to 1.3976 from 1.3418 at 1.4993. This will remain the favored case as long as 1.3976 resistance turned support holds (2022 high), even in case of deep pullback.
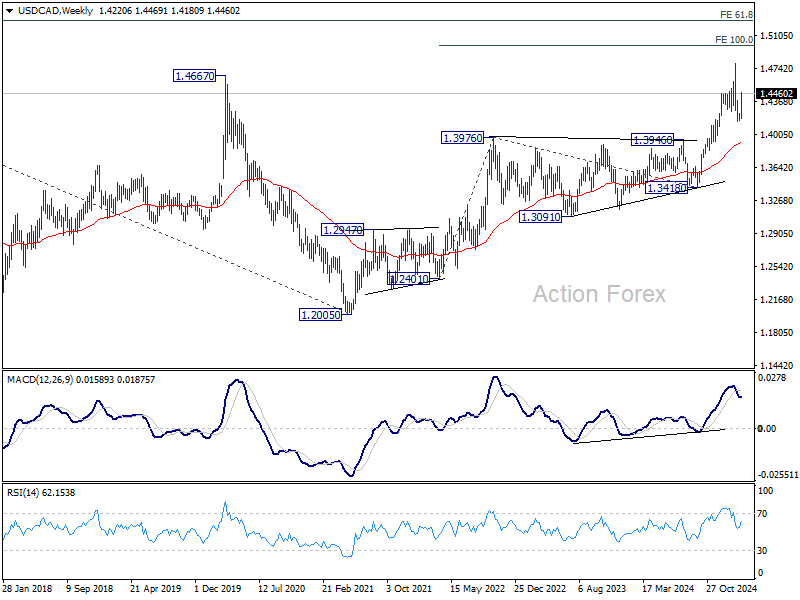
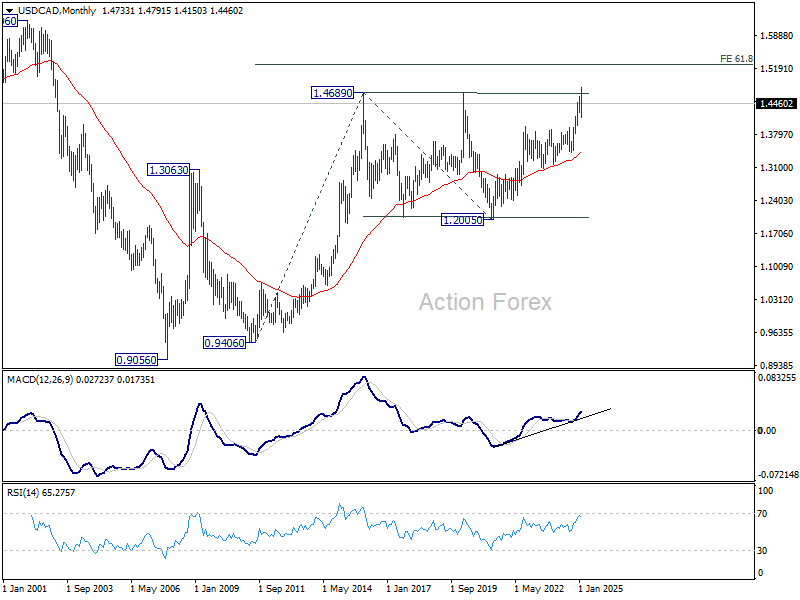
In the longer term picture, up trend from 0.9506 (2007 low) is in progress and possibly resuming. Next target is 61.8% projections of 0.9406 to 1.4689 from 1.2005 at 1.5270. While rejection by 1.4689 will delay the bullish case, further rally will remain in favor as long as 55 M EMA (1.3430) holds.
GBP/JPY Weekly Outlook
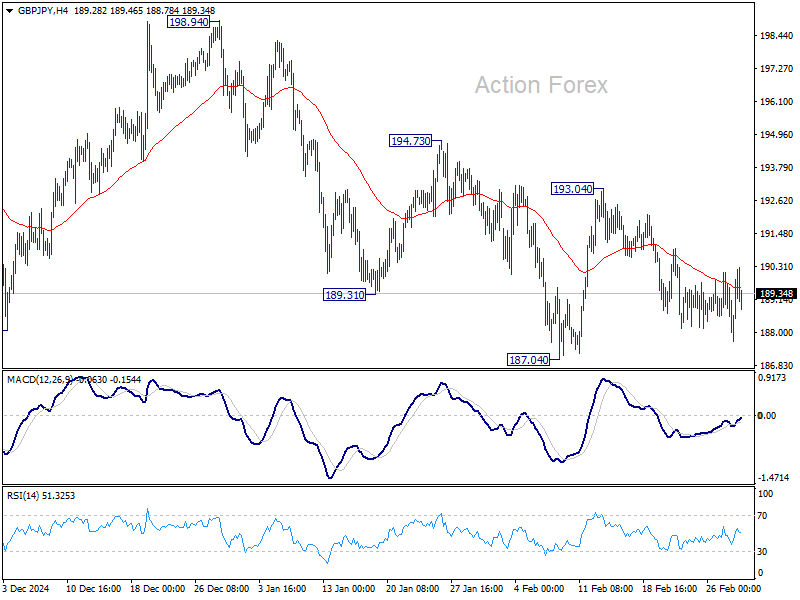
GBP/JPY was bounded in range trading above 187.04 last week. Initial bias stays neutral this week first. Further decline is in favor as long as 193.04 resistance holds. On the downside, firm break of 187.04 will extend the fall from 199.79 towards 180.00 support. That will also raise the chance that correction from 208.09 is resuming downward.
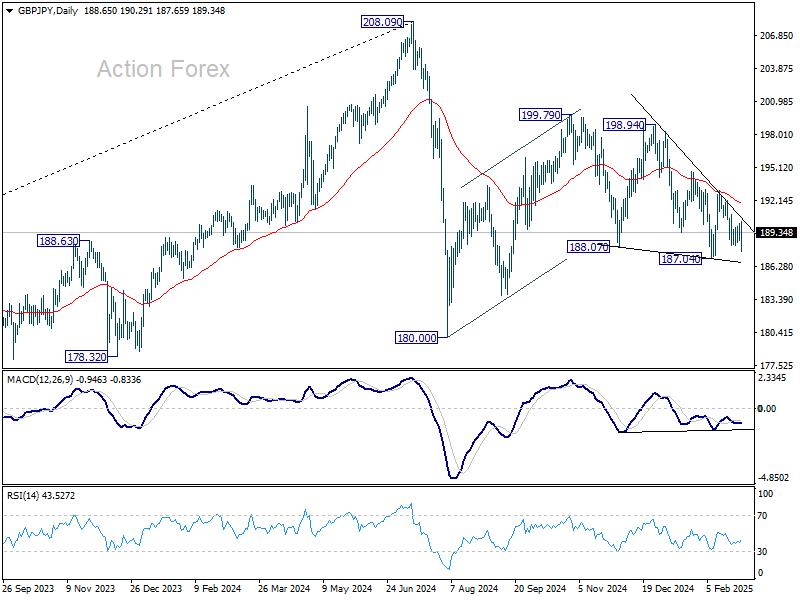
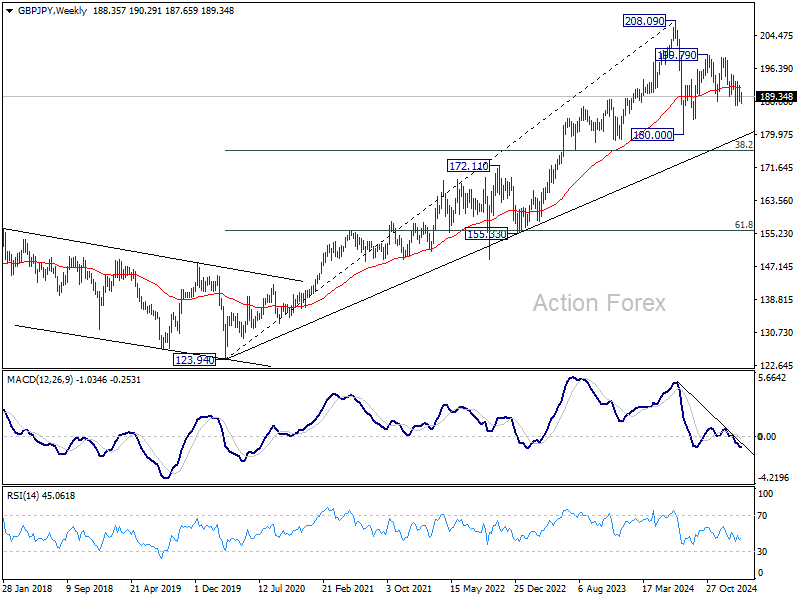
In the bigger picture, price actions from 208.09 are seen as a correction to rally from 123.94 (2020 low). Strong support should be seen from 38.2% retracement of 123.94 to 208.09 at 175.94 to contain downside. However, sustained break of 152.11 will bring deeper fall even still as a correction.
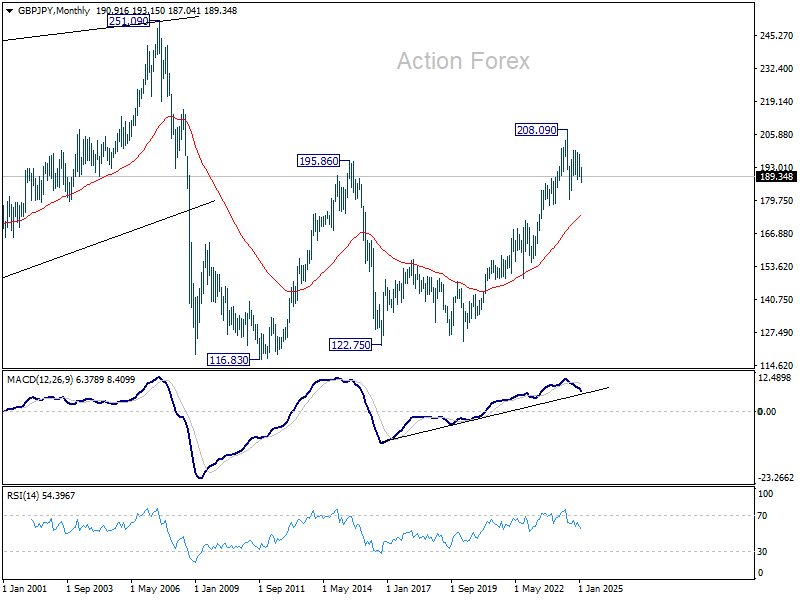
In the longer term picture, while a medium term top was formed at 208.09 (2024 high), it's still early to conclude that the up trend from 122.75 (2016 low) has completed. But GBP/JPY is at least in a medium term corrective phase, with risk of correction to 55 M EMA (now at 173.92).
EUR/JPY Weekly Outlook
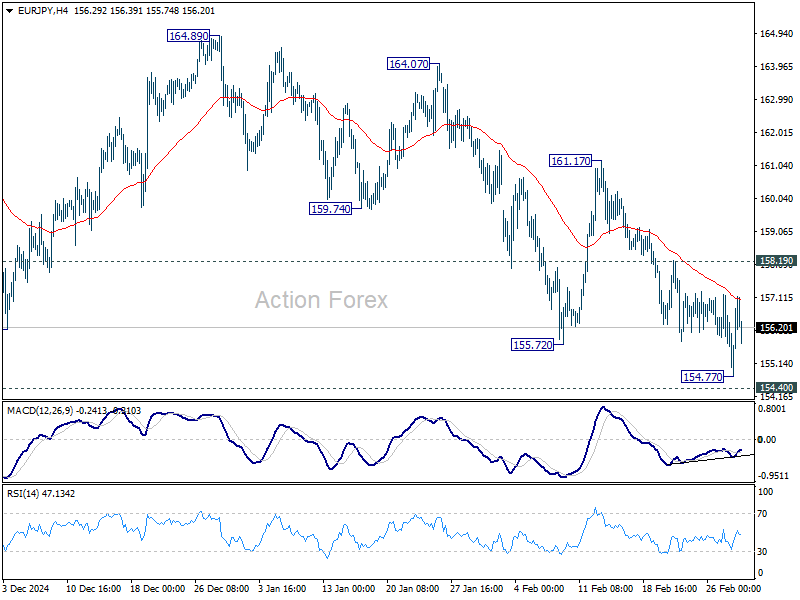
EUR/JPY dipped to 154.77 last week but quickly recovered. Initial bias is turned neutral this week first. Further decline is expected as long as 158.19 resistance holds. Below 154.77 will target 154.40 key support. Firm break there will confirm resumption of whole decline from 175.41 and target 152.11 fibonacci level next.
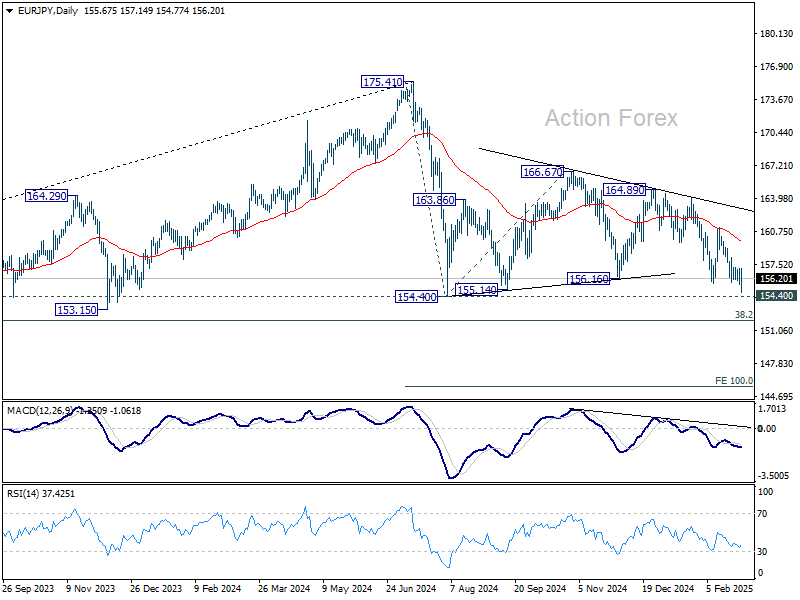
In the bigger picture, price actions from 175.41 are seen as correction to rally from 114.42 (2020 low). Strong support should be seen from 38.2% retracement of 114.42 to 175.41 at 152.11 to contain downside. However, sustained break of 152.11 will bring deeper fall even still as a correction. Next target will be 100% projection of 175.41 to 154.40 from 166.67 at 145.66.
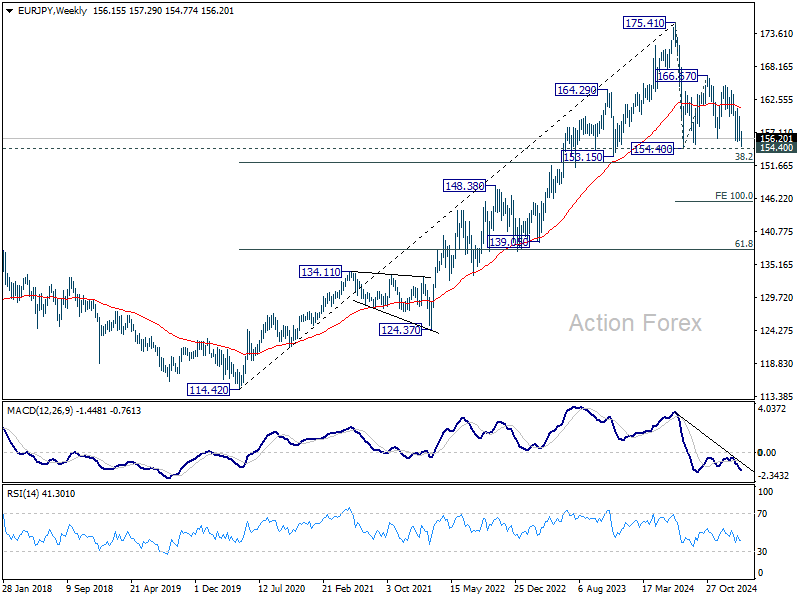
In the long term picture, while 175.41 is at least a medium term top, it's still early to conclude that up trend from 94.11 (2012 low) has completed. A medium term corrective phase is in progress with risk of deeper fall back to 55 M EMA (now at 148.45).

EUR/GBP Weekly Outlook
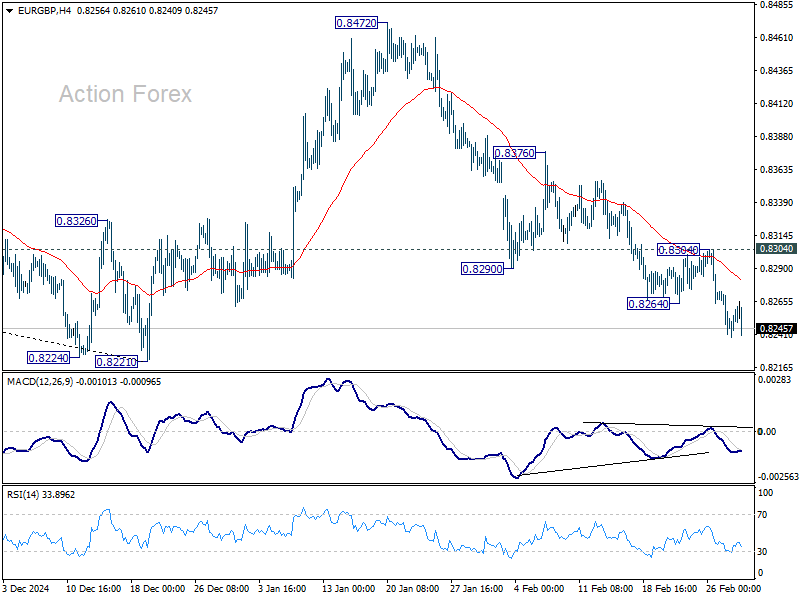
EUR/GBP's fall from 0.8472 continued last week after brief consolidations. Initial bias stays on the downside this week for retesting 0.8201/21 key support zone. Decisive break there will carry larger bearish implications. For now, risk will stay on the downside as long as 0.8304 resistance holds, in case of recovery.
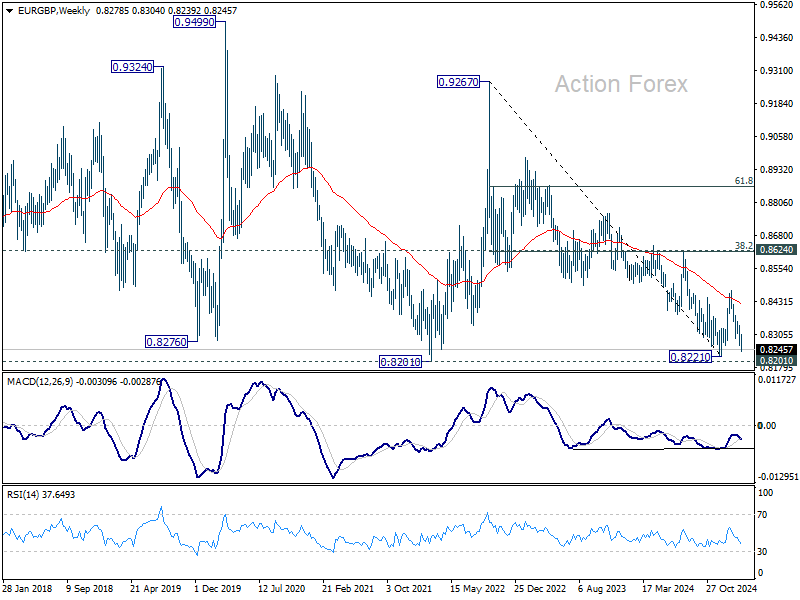
In the bigger picture, the medium term down trend remains intact with EUR/GBP staying well inside the falling channel. Prior rejection by 55 W EMA (now at 0.8419) also affirm bearishness. Decisive break of 0.8201/8221 support zone will resume whole down trend from 0.9449 (2020 high) and carry larger bearish implications.
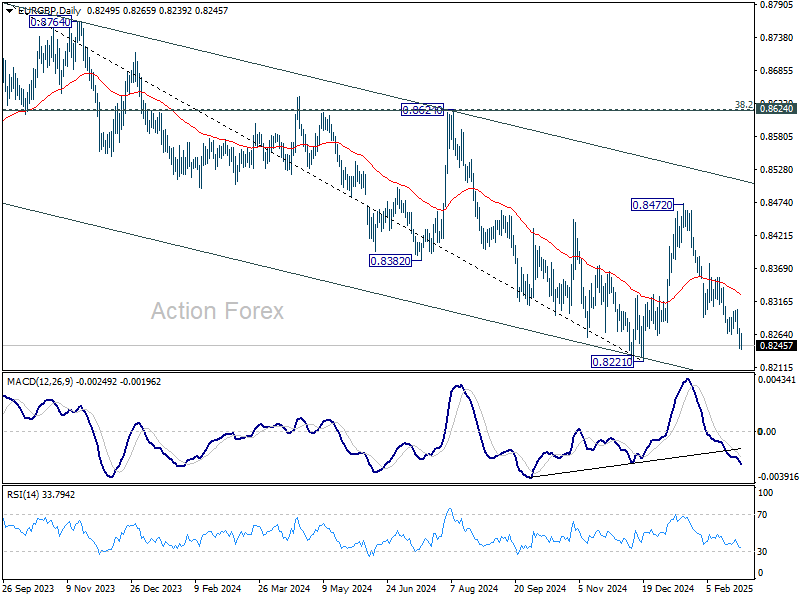
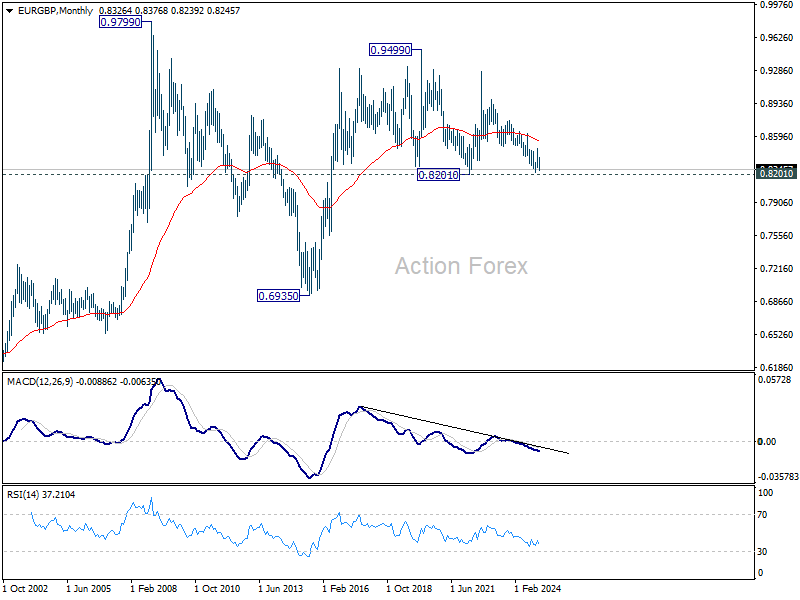
In the long term picture, price action from 0.9499 (2020 high) is seen as part of the long term range pattern from 0.9799 (2008 high). Range trading should continue between 0.8201 and 0.9499, until there is clear signal of imminent breakout.
EUR/AUD Weekly Outlook
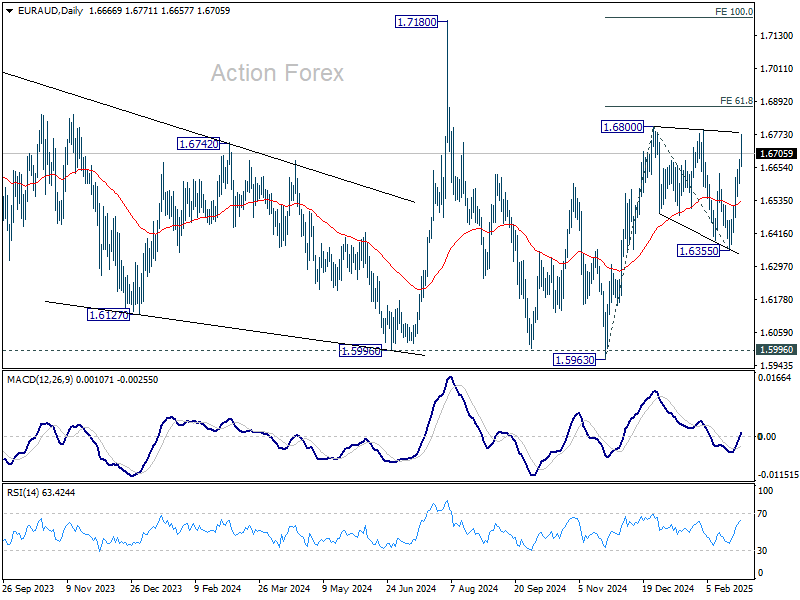
EUR/AUD's strong rally last week indicates that consolidation from 1.6800 has already completed with three waves down to 1.6355. Initial bias stays on the upside this week for 1.6800. Firm break there will resume the rise from 1.5963 to 61.8% projection of 1.5963 to 136800 from 1.6355 at 1.6872, and then 100% projection at 1.7192, which is close to 1.7180 high. On the downside, below 1.6624 minor support will delay the bullish case and turn intraday bias neutral again first.
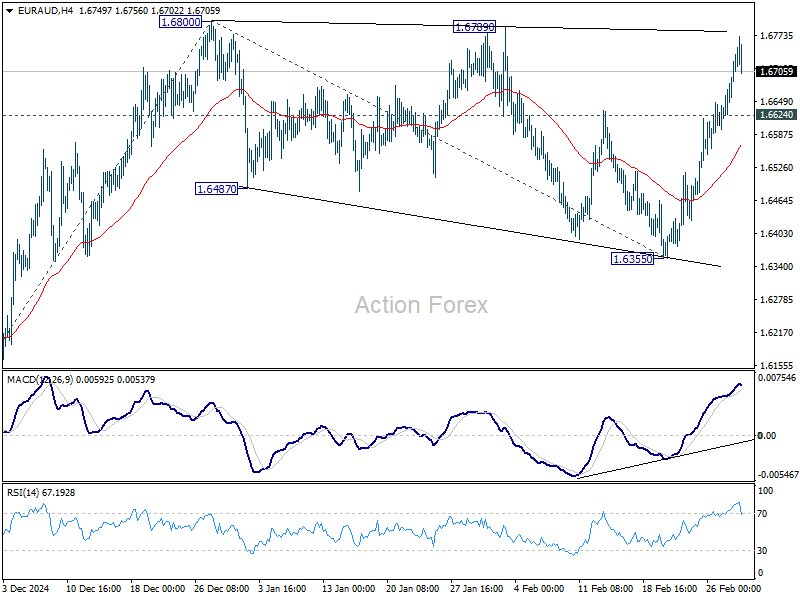
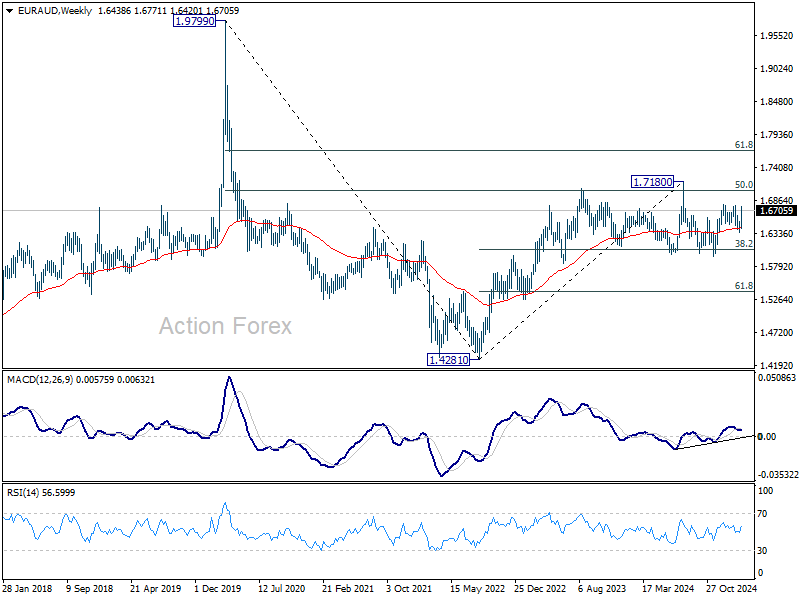
In the bigger picture, with 1.5996 key support (2024 low) intact, larger up trend from 1.4281 (2022 low) is still in favor to resume through 1.7180 at a later stage. Nevertheless, sustained break of 1.5996 will indicate that such up trend has completed and deeper decline would be seen.
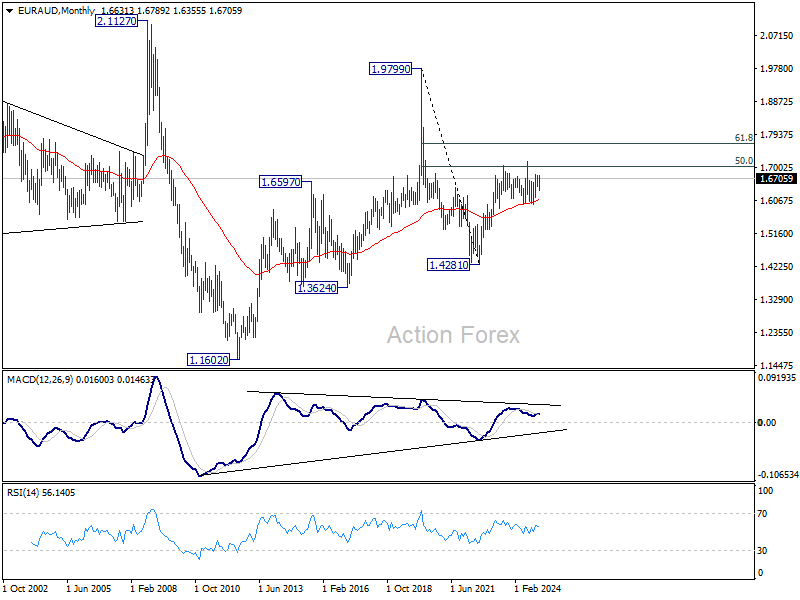
In the longer term picture, rise from 1.4281 is seen as the second leg of the pattern from 1.9799 (2020 high), which is part of the pattern from 2.1127 (2008 high). As long as 55 M EMA (now at 1.6090) holds, this second leg could still extend higher. However, sustained trading below 55 M EMA will open up the bearish case for extending the decline through 1.4281 low.
EUR/CHF Weekly Outlook
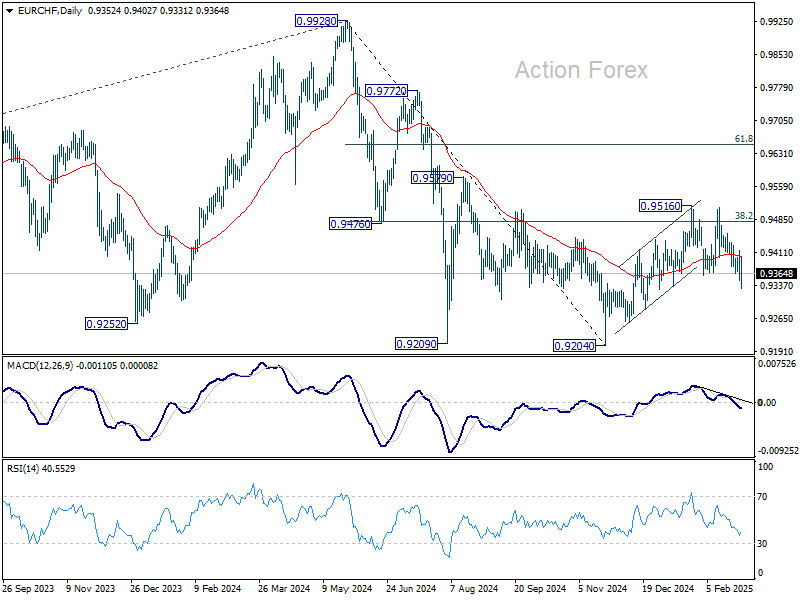
EUR/CHF's extended decline and break of 0.9359 support revived the case that corrective rise from 0.9204 has already completed at 0.9516. Further fall is expected this week as long as 0.9414 resistance holds, to retest 0.9204 low. On the upside, though, break of 0.9414 resistance will mix up the outlook again and turn intraday bias neutral.
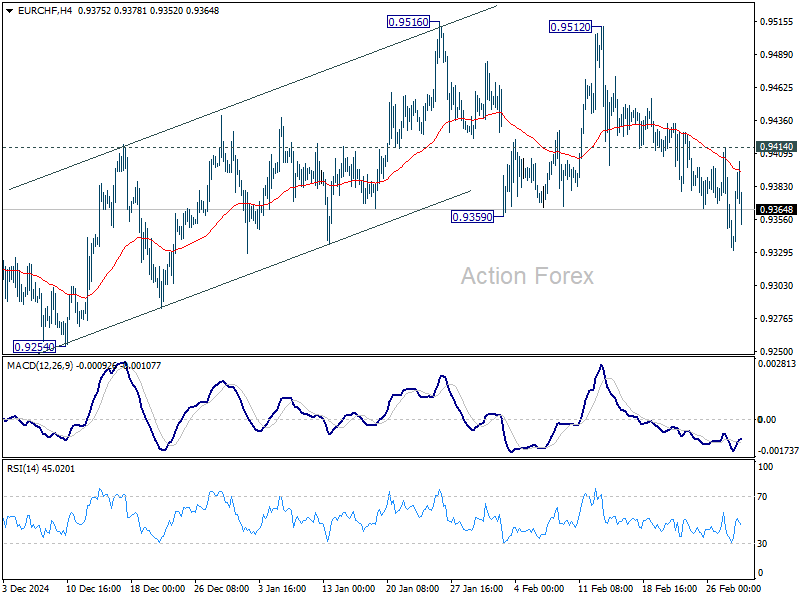
In the bigger picture, sustained trading above 38.2% retracement of 0.9928 to 0.9204 at 0.9481 should confirm that whole fall from 0.9928 has completed at 0.9204. Further rally should then be seen back to 61.8% retracement at 0.9651 and above. However, another rejection by 0.9481 will keep outlook bearish for extending larger down trend through 0.9204 at a later stage.
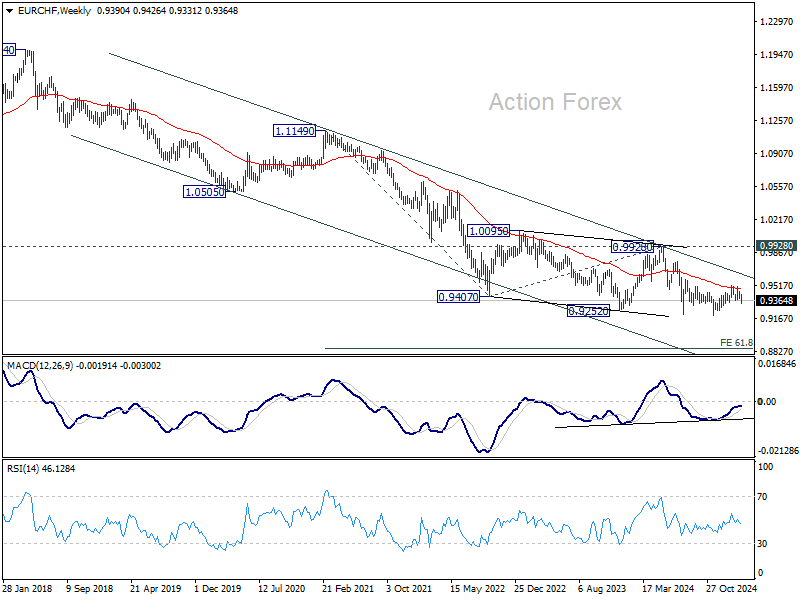
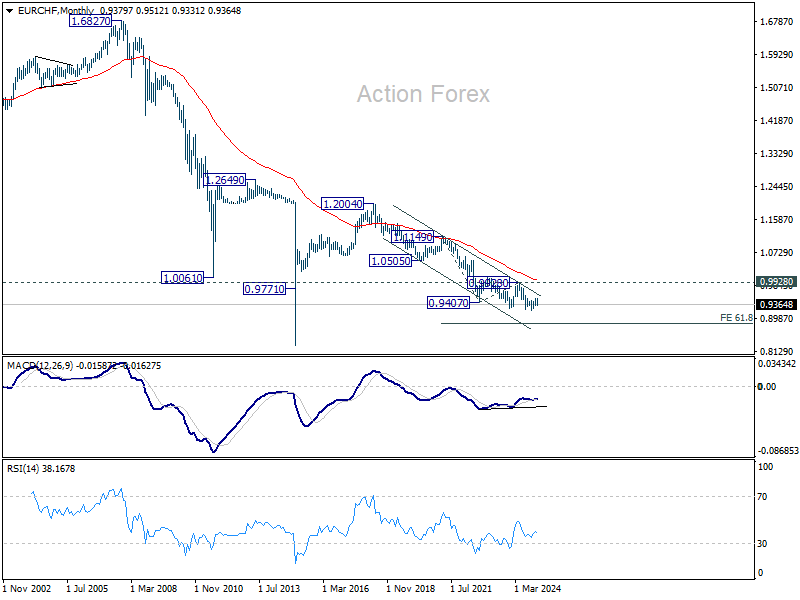
In the long term picture, as long as 0.9928 resistance holds, the multi-decade down trend remains intact, with decline from 1.2004 (2018 high) as another falling leg. Decisive break of 0.9252 (2023 low) will confirm long term down trend resumption to 61.8% projection of 1.1149 to 0.9407 from 0.9928 at 0.8851.
Safe-Haven Demand Fuels Dollar Rally Amid Trade, Geopolitical Turmoil
Market sentiment took a decisive turn for the worse last week, with risk aversion dominating across asset classes. The combination of deteriorating domestic economic conditions in the US and heightened global uncertainties has fueled concerns that risk appetite could weaken further. Equities faced renewed selling pressure, yields dropped sharply.
Domestically, US economic data painted a troubling picture. Consumer confidence deteriorated sharply, while weak personal spending data and a rise in jobless claims suggested that the labor market could be facing new headwinds. With the economy looking increasingly fragile, concerns are mounting that the economy may struggle to maintain momentum, reinforcing speculation about Fed rate cuts.
Externally, the risk of a full-blown trade war continues to escalate. US President Donald Trump doubled down on his aggressive tariff agenda, reaffirming the March 4 deadline for 25% tariffs on Canada and Mexico and indicating that the EU would be next in line with reciprocal tariffs.
Geopolitical tensions also worsened, particularly after a dramatic Oval Office showdown between Trump, Vice President JD Vance, and Ukrainian President Volodymyr Zelenskiy. The meeting, initially expected to pave the way for a mineral deal between the US and Ukraine—potentially a step toward resolving the Russian invasion—ended in failure. With US-Ukraine relations strained and no clear resolution in sight, uncertainty in the region remains elevated.
On the bright side, markets have scaled up expectations for a Fed rate cut in the first half of the year. However, it’s unclear whether additional monetary easing will truly bolster risk sentiment or simply underscore the extent of the economic challenges ahead. A rate cut could offer short-term relief for risk assets, but it might also underscore fears of an impending downturn in domestic activity.
In the forex market, Dollar emerged as the clear winner for the week, benefiting from risk aversion rather than rate expectations. Sterling and Swiss Franc followed as the next strongest currencies, with the UK seemingly avoiding US tariff threats and the Franc gaining from both risk aversion and Euro weakness. At the other end of the spectrum, commodity currencies struggled, with New Zealand Dollar leading the declines, followed by Australian and Canadian Dollars. Meanwhile, Euro ended in a mixed manner, with the initial post-German election boost fading as tariff threats weighed. Yen also struggled to extend its rally, leaving it stuck in the middle of the performance ladder.
Investors Pin Hopes on Fed Easing as Stocks Sell Off, But Is Relief Temporary?
US equity markets ended February on a weak note, with NASDAQ suffering a sharp -3.5% weekly decline despite a late recovery. S&P 500 also lost nearly -1%, while DOW managed to close about 1% higher, benefiting from recovery after leading the selloff earlier in the month. However, the broader market sentiment remained fragile.
For the entire month, NASDAQ dropped -4%, marking its worst monthly performance since April 2024. S&P 500 fell -1.5%, while the DOW ended down -1.6%. Several factors weighed on market sentiment, including intensifying trade war risks, particularly as the scheduled 25% tariffs on Canada and Mexico approach on March 4. The more consequential reciprocal tariffs, set to take effect on April 2, also remain a source of significant uncertainty.
US economic data further exacerbated concerns, with sharp decline in consumer confidence, jump in jobless claims, and contraction in personal spending, all pointing to risk of extended weakness in household demand. These indicators have fueled doubts about the strength of US consumption, which remains a critical driver of economic growth.
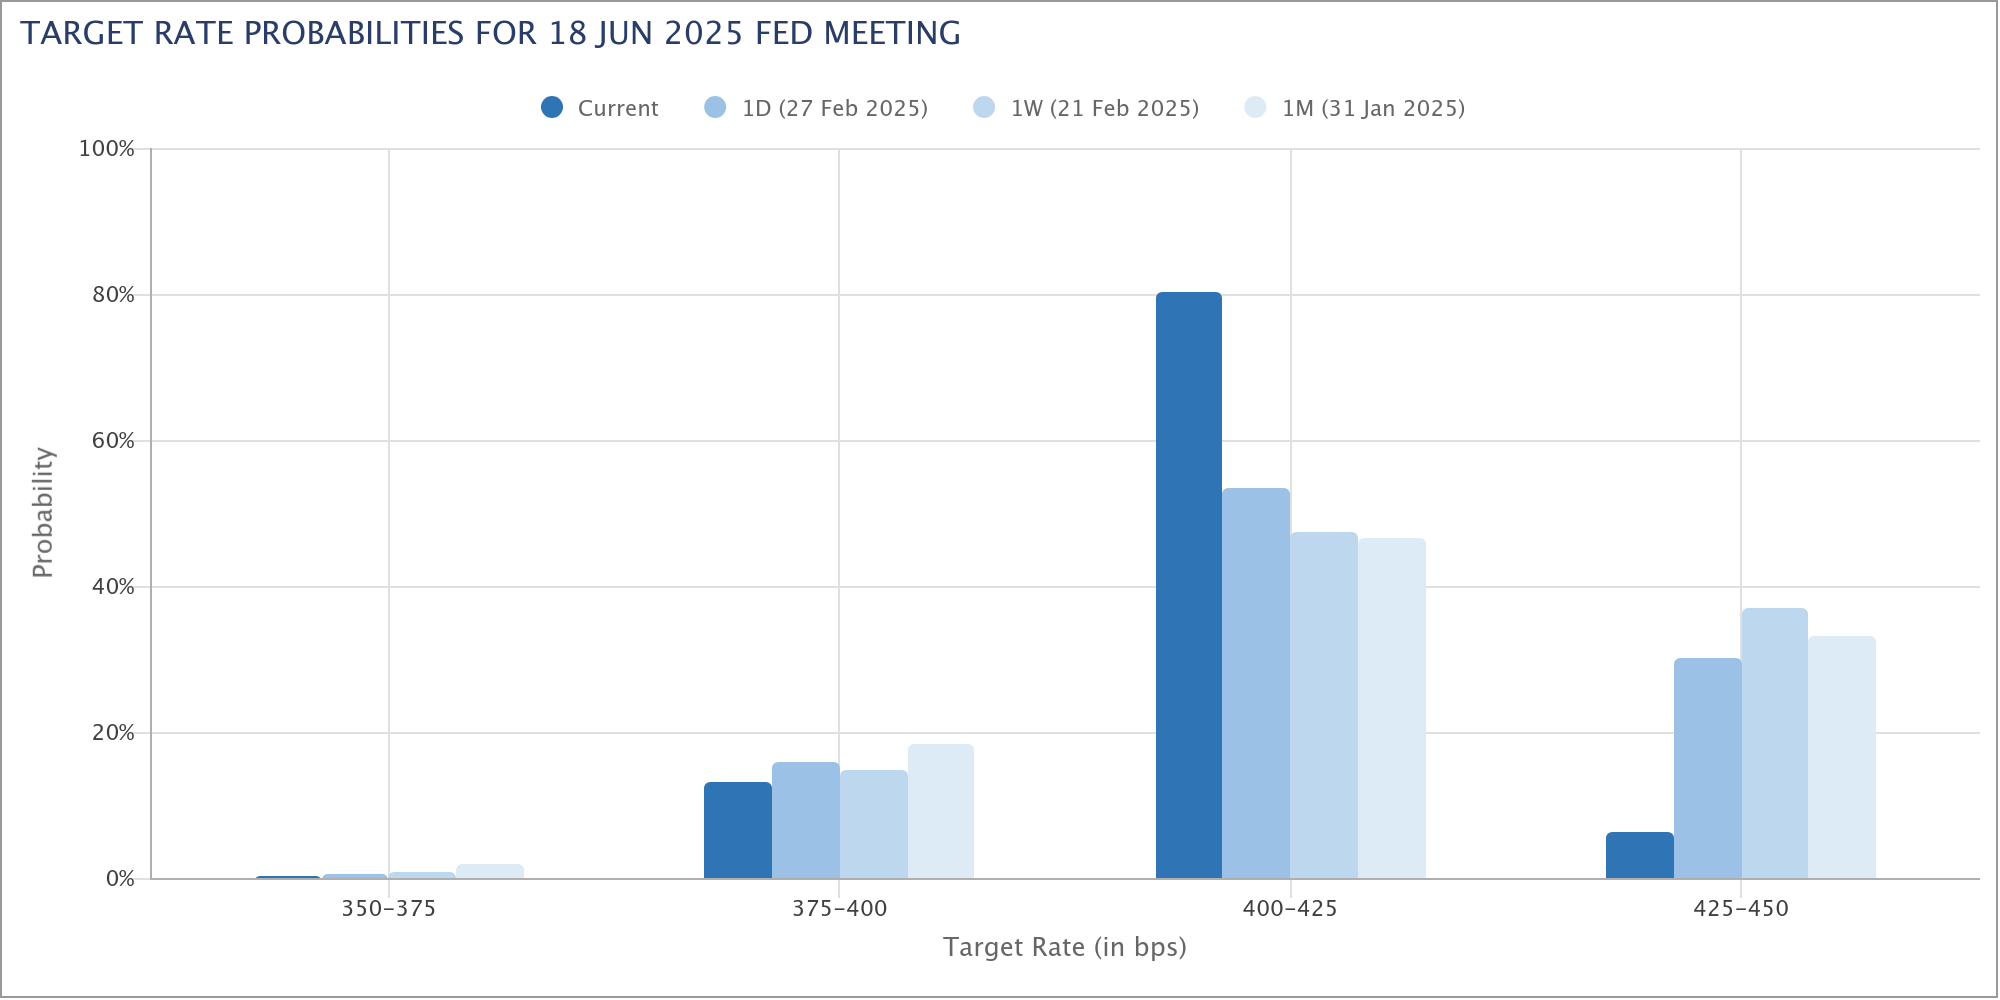
With these headwinds and decline in PCE core inflation as released on Friday, expectations for another Fed rate cut in the first half of the year continued to rise. Fed fund futures now price in a 94% probability of a 25bps cut to 4.00%-4.25% in June, up significantly from 63% just a week ago. This growing optimism about resumed Fed easing has provided some support to market sentiment. But it remains unclear whether it will be enough to reverse the pre-dominating risk-off mood or merely slow the pace of decline.
Technically, NASDAQ is tentatively drawing support from 38.2% retracement of 15708.53 to 20204.58 at 18487.09. Strong rebound from current level, followed by firm break of 55 D EMA (now at 19440.85) will suggest that the corrective pattern from 20204.58 has completed. That will also keep the medium term up trend intact for another rally through 20204.58 at a later stage.
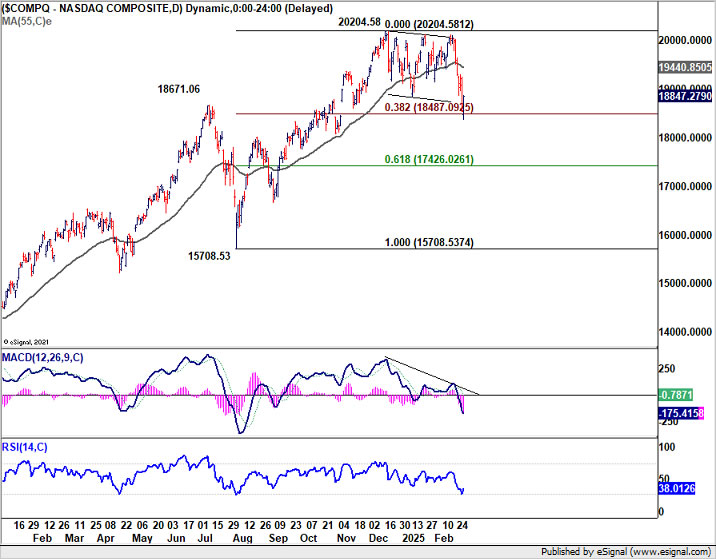
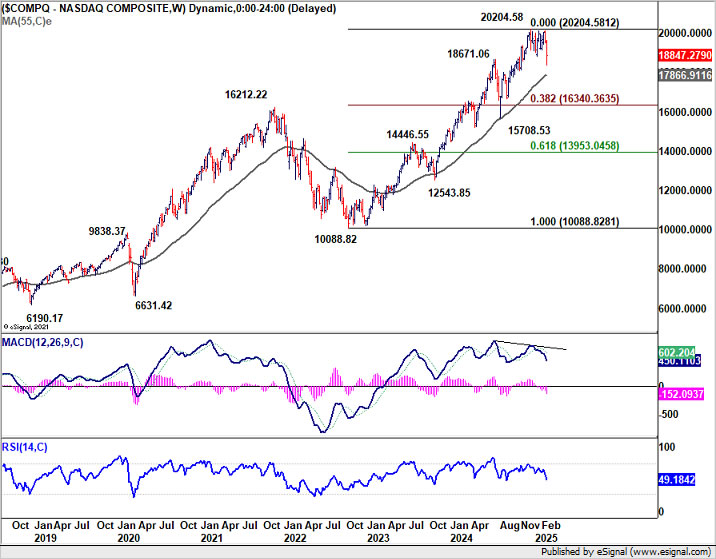
However, sustained break of 18487.09 will raise the chance that a larger scale correction has already started. In the bearish case, NASDAQ should be correcting whole uptrend from 10088.82 (2022 low). Further break of 55 W EMA (now at 17866.91) will confirm this bearish case and pave the way to 38.2% retracement of 10088.82 to 20204.58 at 16340.36.
Risk Aversion Drags Yields Down, But Lifts Dollar Higher
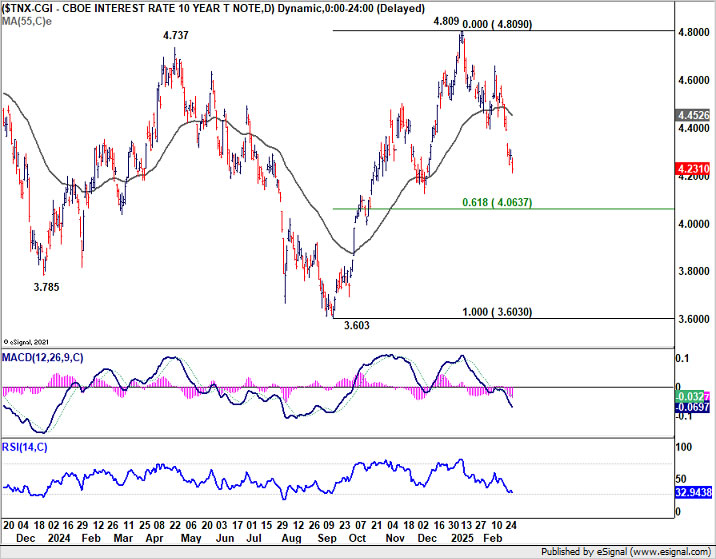
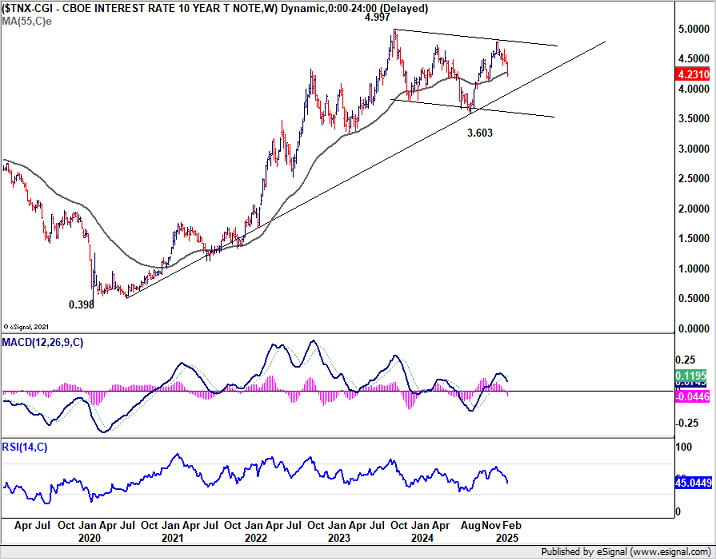
Risk aversion was also evident in the US bond markets, with 10-year Treasury yield tumbling sharply to its lowest level since December. The sharp drop highlights growing concerns over economic uncertainty and trade tensions.
Technically, current development suggests that rise from 3.603 (2024 low) has completed at 4.809 already, well ahead of 4.997 (2023 high). Current fall is seen as another downleg in the sideway corrective pattern from 4.997. Deeper decline is expected to 61.8% retracement of 3.603 to 4.809 at 4.063 next. Risk will stay on the downside as long as 55 D EMA (now at 4.452) holds, in case of recovery.
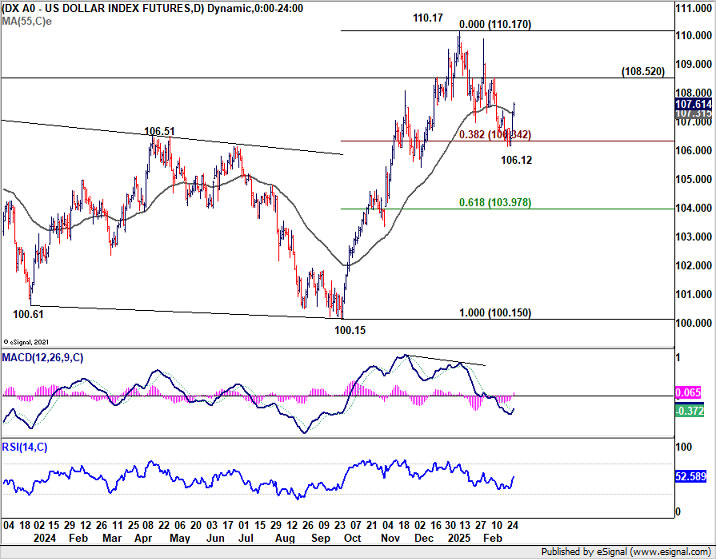
Dollar Index clear reacted more to risk aversion than falling yields and Fed cut expectations. The's strong bounce towards the end of the week and the break of 55 D EMA (now at 107.31) suggests that fall from 110.17 has completed at 106.12. That came after defending 38.2% retracement of 100.15 to 110.17 at 106.34. Further rise should be seen to 108.52 resistance. Firm break there will target a retest on 110.17 high.
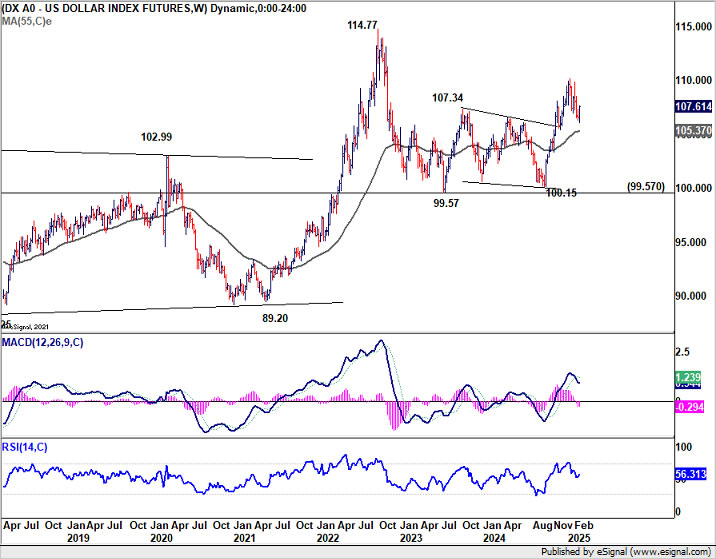
In the bigger picture, Dollar Index is holding comfortably above 55 W EMA (now at 105.37), and thus rise from 100.15 and 99.57 should still be intact. Break of 110.17 will pave the way back to 114.77 (2022 high) at a later stage.
NZD/USD and AUD/USD Sink, Eye 2025 Lows for Support
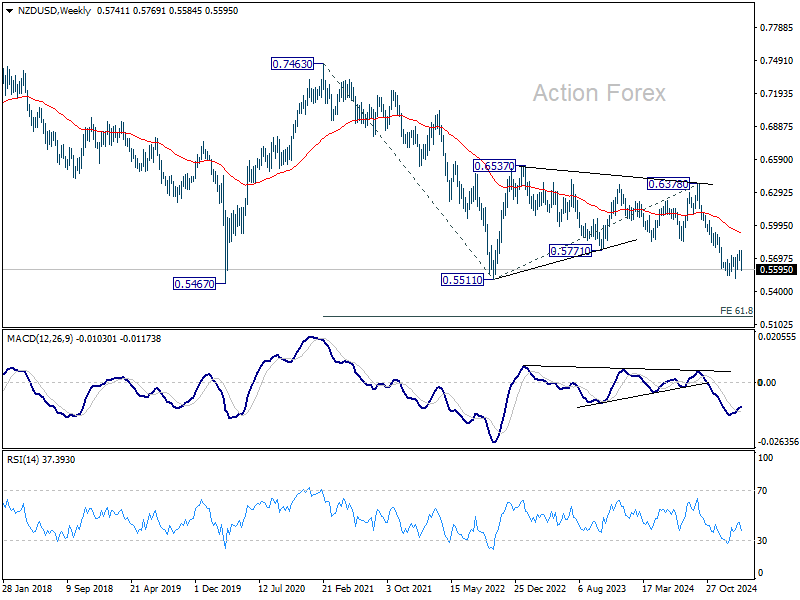
Kiwi and Aussie were the worst-performing currencies last week, each losing around -2.4% against the greenback. With risk sentiment deteriorating downside pressure on these two currencies could persistent. The key focus now is whether risk aversion would intensify and push NZD/USD and AUD/USD through this year's lows to resume the long term down trend. There these key support levels could offer a breather to them.
Technically, NZD/USD's steep decline last week suggests that corrective rebound from 0.5515 should have completed at 0.5571 already. Retest of 0.5515 should be seen next. Strong support from there could bring rebound to extend the corrective pattern with another rising leg. But outlook will stay bearish as long as 38.2% retracement of 0.6378 to 0.5515 at 0.5848 holds. Firm break of 0.5515 will resume the long term down trend to 61.8% projection of 0.7463 to 0.5511 from 0.6378 at 0.5172.

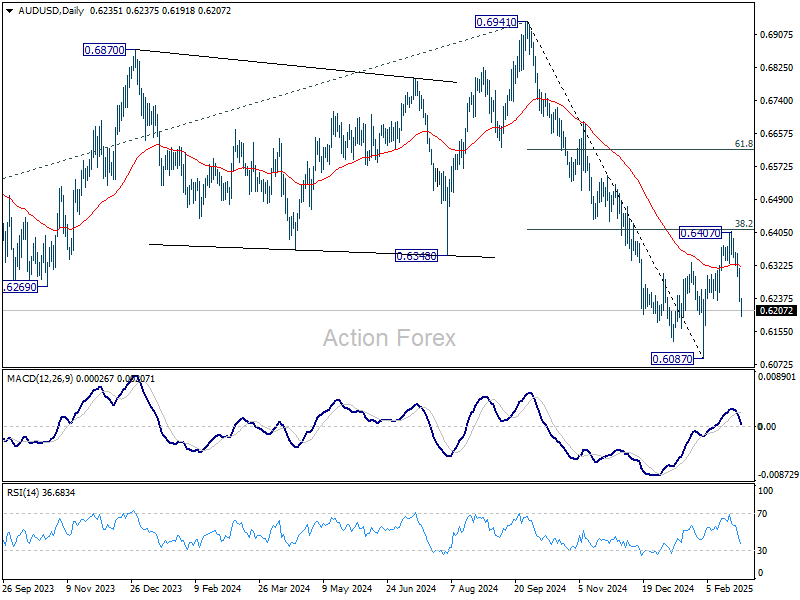
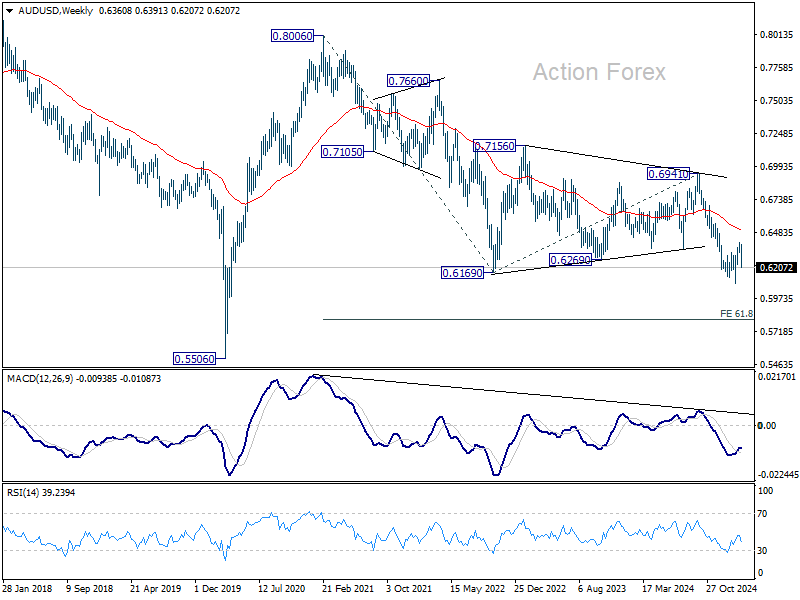
Similarly, AUD/USD's corrective rebound from 0.6087 should have completed at 0.6407. Retest of 0.6087 low should be seen next. Strong rebound from there would extend the corrective pattern with another rising leg. But outlook will stay bearish as long as 38.2% retracement of 0.6941 to 0.6087 at 0.6413 holds. Firm break of 0.6087 will resume the long term down trend to 61.8% projection of 0.8006 to 0.6169 from 0.6941 at 0.5806.
Bitcoin and Gold Tumble on Risk-Off Sentiment
Bitcoin and Gold struggled under renewed risk aversion last week, extending their losses in line with broader market weakness. While Gold retains a comparatively better outlook, both assets remain vulnerable to ongoing volatility.
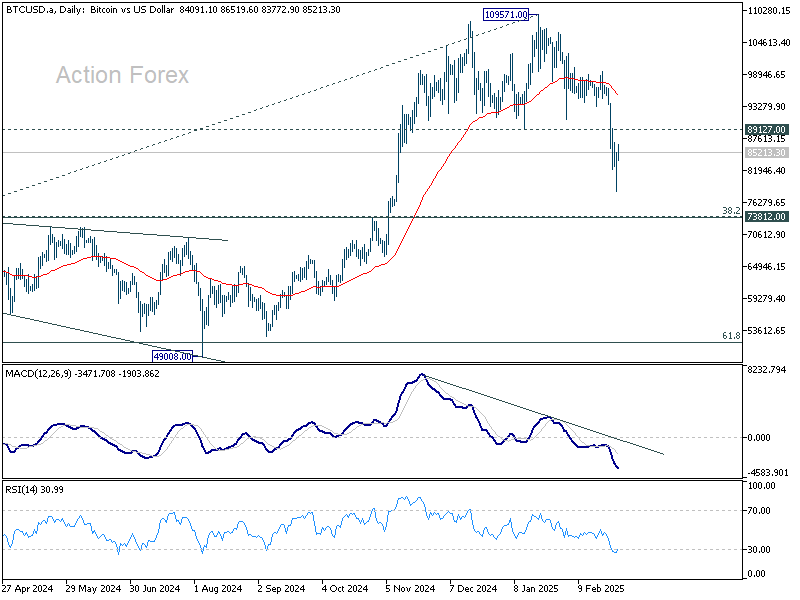
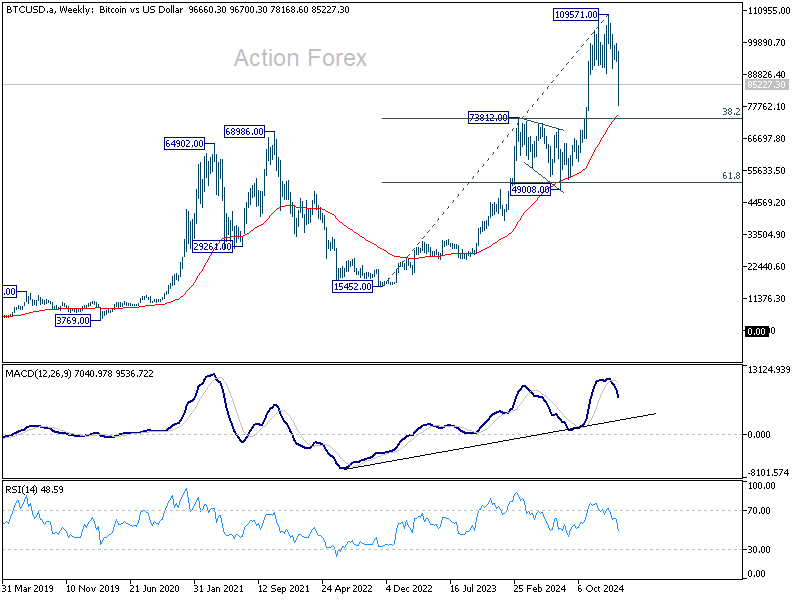
Bitcoin suffered a sharp fall, decisively breaking 89127 support, confirming medium-term topping at 109571. The current slide is seen as a correction of the entire uptrend from the 15452 (2022 low). Deeper decline toward 55 W EMA (now at 74129) is expected.
Strong support could emerge from the 73812 cluster zone (38.2% retracement of 15452 to 109571 at 73617) to bring rebound, at least first attempt. However, downside risks remain as long as 55 D EMA (now at 95288) caps any recovery.
Decisive break of 73617/73812 zone could extended the decline to 50k mark, which is close to 49008 support and 61.8% retracement at 51405.
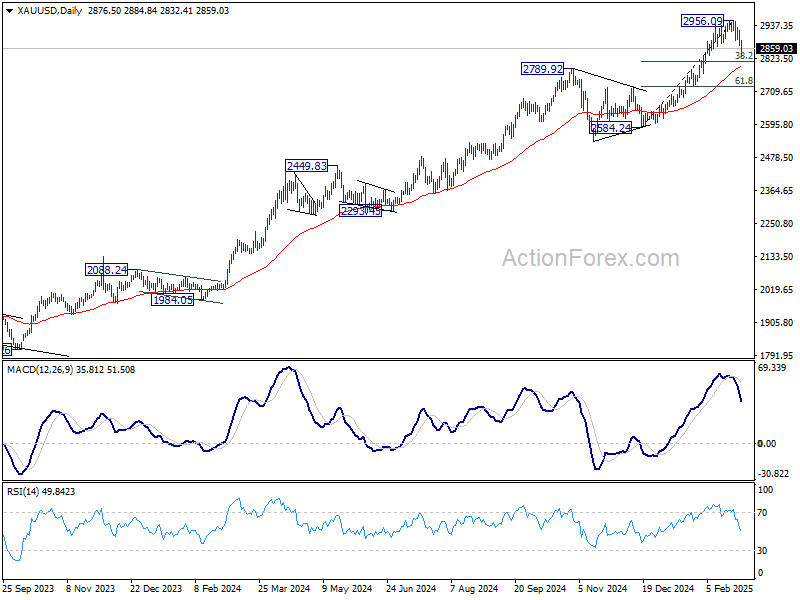
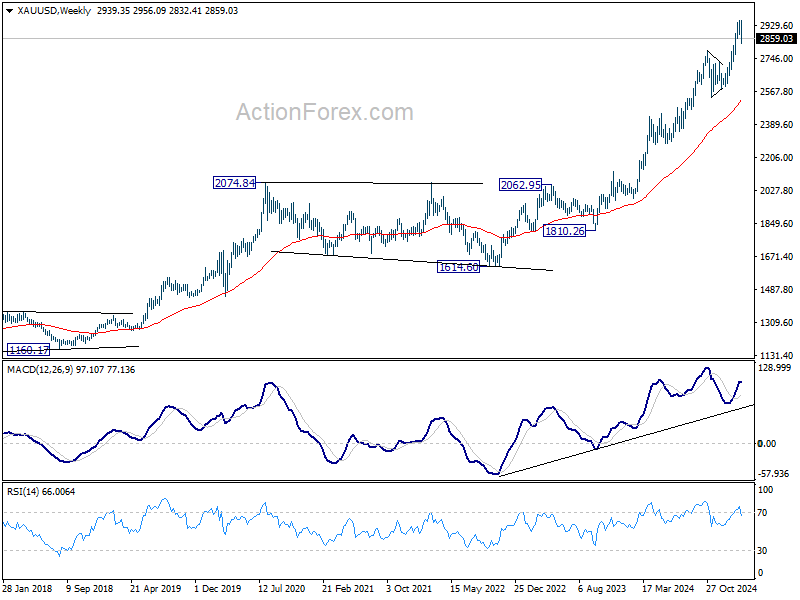
By contrast, Gold’s outlook is less overtly bearish. 2956.09 is seen as a short term top only, for now. Subsequent pullback is viewed primarily as a correction of the rise from 2584.24. Strong support might be seen from 55 D EMA (now at 2792.05) to bring rebound, and set the base for uptrend resumption at a later stage.
However, considering that Gold was just rejected by 3000 psychological level sustained trading below 55 D EMA would argue that larger scale correction in underway. In the bearish case, Gold could be starting a medium term decline back to 55 W EMA (now at 2522.33).
EUR/USD Weekly Outlook
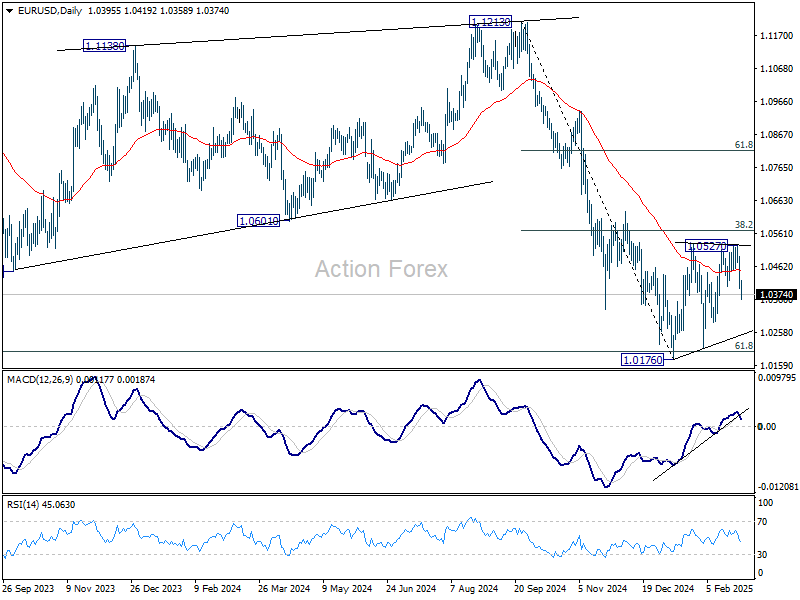
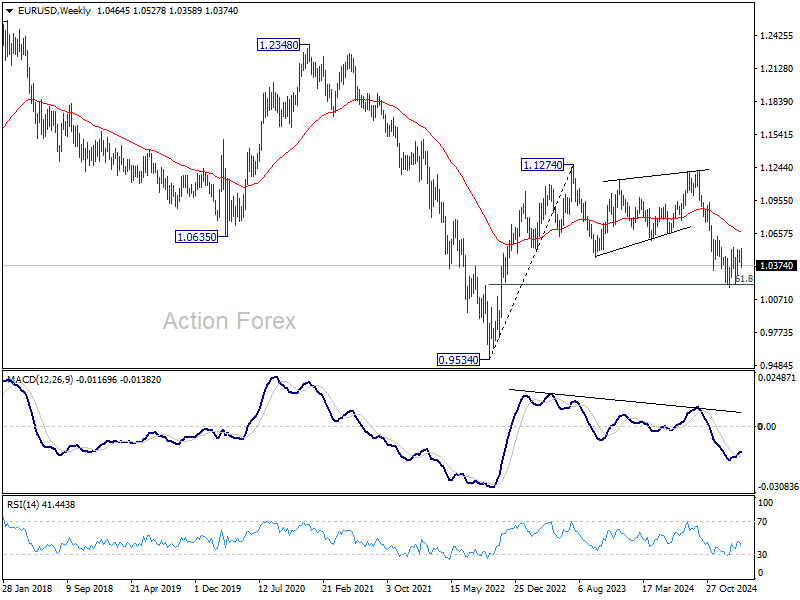
EUR/USD reversed after edging higher to 1.0527 last week, and the development suggests that consolidation from from 1.0176 has already completed. Initial bias stays on the downside this week for retesting 1.0176/0210 support zone first. Firm break there will resume whole fall from 1.1213, and carry larger bearish implications. On the upside, above 1.0419 minor resistance will turn intraday bias neutral. But outlook will stay bearish as long as 38.2% retracement of 1.1213 to 1.0176 at 1.0572 holds.
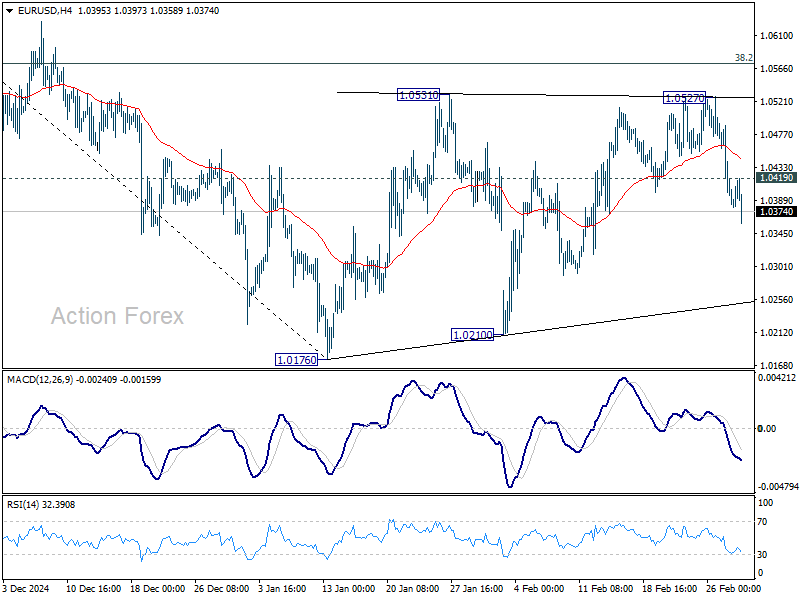
In the bigger picture, immediate focus is on 61.8 retracement of 0.9534 (2022 low) to 1.1274 (2024 high) at 1.0199. Sustained break there will solidify the case of medium term bearish trend reversal, and pave the way back to 0.9534. However, reversal from 1.0199 will argue that price actions from 1.1274 are merely a corrective pattern, and has already completed.
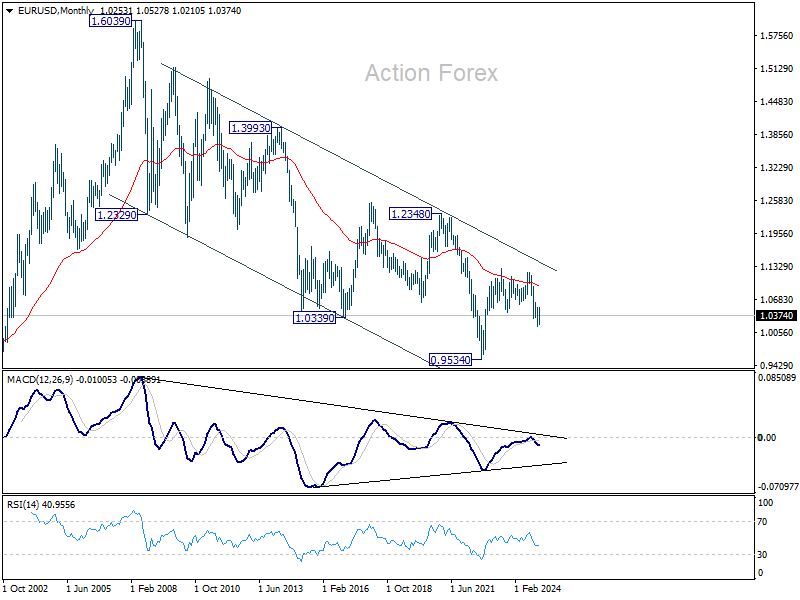
In the long term picture, down trend from 1.6039 remains in force with EUR/USD staying well inside falling channel, and upside of rebound capped by 55 M EMA (now at 1.0929). Consolidation from 0.9534 could extend further and another rising leg might be seem. But as long as 1.1274 resistance holds, eventual downside breakout would be mildly in favor.
Summary 3/3 – 3/7
Monday, Mar 3, 2025
| GMT | Ccy | Events | Consensus | Previous |
|---|---|---|---|---|
| 21:45 | NZD | Terms of Trade Index Q4 | 1.50% | 2.40% |
| 00:00 | AUD | TD-MI Inflation Gauge M/M Feb | 0.10% | |
| 00:30 | AUD | Company Gross Operating Profits Q/Q Q4 | 1.50% | -4.60% |
| 00:30 | JPY | Manufacturing PMI Feb F | 48.9 | 48.9 |
| 01:45 | CNY | Caixin Manufacturing PMI Feb | 50.3 | 50.1 |
| 08:30 | CHF | Manufacturing PMI Feb | 48.4 | 47.5 |
| 08:50 | EUR | France Manufacturing PMI Feb F | 45.5 | 45.5 |
| 08:55 | EUR | Germany Manufacturing PMI Feb F | 46.1 | 46.1 |
| 09:00 | EUR | Eurozone Manufacturing PMI Feb F | 47.3 | 47.3 |
| 09:30 | GBP | Manufacturing PMI Feb F | 46.4 | 46.4 |
| 09:30 | GBP | Mortgage Approvals Jan | 66K | 67K |
| 09:30 | GBP | M4 Money Supply M/M Jan | 0.10% | |
| 10:00 | EUR | Eurozone CPI Y/Y Feb P | 2.30% | 2.50% |
| 10:00 | EUR | Eurozone CPI Core Y/Y Feb P | 2.50% | 2.70% |
| 14:30 | CAD | Manufacturing PMI Feb | 51.6 | |
| 14:45 | USD | Manufacturing PMI Feb F | 51.6 | 51.6 |
| 15:00 | USD | ISM Manufacturing PMI Feb | 50.8 | 50.9 |
| 15:00 | USD | ISM Manufacturing Prices Paid Feb | 56.2 | 54.9 |
| 15:00 | USD | ISM Manufacturing Employment Feb | 50.3 | |
| 15:00 | USD | Construction Spending M/M Jan | -0.10% | 0.50% |
| 21:45 | NZD | Building Permits M/M Jan | -5.60% | |
| 23:30 | JPY | Unemployment Rate Jan | 2.40% | 2.40% |
| 23:50 | JPY | Capital Spending Q4 | 4.90% | 8.10% |
| 23:50 | JPY | Monetary Base Y/Y Feb | -1.80% | -2.50% |
| GMT | Ccy | Events | |
|---|---|---|---|
| 21:45 | NZD | Terms of Trade Index Q4 | |
| Forecast: 1.50% | Previous: 2.40% | ||
| 00:00 | AUD | TD-MI Inflation Gauge M/M Feb | |
| Forecast: | Previous: 0.10% | ||
| 00:30 | AUD | Company Gross Operating Profits Q/Q Q4 | |
| Forecast: 1.50% | Previous: -4.60% | ||
| 00:30 | JPY | Manufacturing PMI Feb F | |
| Forecast: 48.9 | Previous: 48.9 | ||
| 01:45 | CNY | Caixin Manufacturing PMI Feb | |
| Forecast: 50.3 | Previous: 50.1 | ||
| 08:30 | CHF | Manufacturing PMI Feb | |
| Forecast: 48.4 | Previous: 47.5 | ||
| 08:50 | EUR | France Manufacturing PMI Feb F | |
| Forecast: 45.5 | Previous: 45.5 | ||
| 08:55 | EUR | Germany Manufacturing PMI Feb F | |
| Forecast: 46.1 | Previous: 46.1 | ||
| 09:00 | EUR | Eurozone Manufacturing PMI Feb F | |
| Forecast: 47.3 | Previous: 47.3 | ||
| 09:30 | GBP | Manufacturing PMI Feb F | |
| Forecast: 46.4 | Previous: 46.4 | ||
| 09:30 | GBP | Mortgage Approvals Jan | |
| Forecast: 66K | Previous: 67K | ||
| 09:30 | GBP | M4 Money Supply M/M Jan | |
| Forecast: | Previous: 0.10% | ||
| 10:00 | EUR | Eurozone CPI Y/Y Feb P | |
| Forecast: 2.30% | Previous: 2.50% | ||
| 10:00 | EUR | Eurozone CPI Core Y/Y Feb P | |
| Forecast: 2.50% | Previous: 2.70% | ||
| 14:30 | CAD | Manufacturing PMI Feb | |
| Forecast: | Previous: 51.6 | ||
| 14:45 | USD | Manufacturing PMI Feb F | |
| Forecast: 51.6 | Previous: 51.6 | ||
| 15:00 | USD | ISM Manufacturing PMI Feb | |
| Forecast: 50.8 | Previous: 50.9 | ||
| 15:00 | USD | ISM Manufacturing Prices Paid Feb | |
| Forecast: 56.2 | Previous: 54.9 | ||
| 15:00 | USD | ISM Manufacturing Employment Feb | |
| Forecast: | Previous: 50.3 | ||
| 15:00 | USD | Construction Spending M/M Jan | |
| Forecast: -0.10% | Previous: 0.50% | ||
| 21:45 | NZD | Building Permits M/M Jan | |
| Forecast: | Previous: -5.60% | ||
| 23:30 | JPY | Unemployment Rate Jan | |
| Forecast: 2.40% | Previous: 2.40% | ||
| 23:50 | JPY | Capital Spending Q4 | |
| Forecast: 4.90% | Previous: 8.10% | ||
| 23:50 | JPY | Monetary Base Y/Y Feb | |
| Forecast: -1.80% | Previous: -2.50% | ||
Tuesday, Mar 4, 2025
| GMT | Ccy | Events | Consensus | Previous |
|---|---|---|---|---|
| 00:30 | AUD | RBA Meeting Minutes | ||
| 00:30 | AUD | Current Account (AUD) Q4 | -11.0B | -14.1B |
| 00:30 | AUD | Retail Sales M/M Jan | 0.30% | -0.10% |
| 05:00 | JPY | Consumer Confidence Index Feb | 35.7 | 35.2 |
| 10:00 | EUR | Eurozone Unemployment Rate Jan | 6.30% | 6.30% |
| GMT | Ccy | Events | |
|---|---|---|---|
| 00:30 | AUD | RBA Meeting Minutes | |
| Forecast: | Previous: | ||
| 00:30 | AUD | Current Account (AUD) Q4 | |
| Forecast: -11.0B | Previous: -14.1B | ||
| 00:30 | AUD | Retail Sales M/M Jan | |
| Forecast: 0.30% | Previous: -0.10% | ||
| 05:00 | JPY | Consumer Confidence Index Feb | |
| Forecast: 35.7 | Previous: 35.2 | ||
| 10:00 | EUR | Eurozone Unemployment Rate Jan | |
| Forecast: 6.30% | Previous: 6.30% | ||
Wednesday, Mar 5, 2025
| GMT | Ccy | Events | Consensus | Previous |
|---|---|---|---|---|
| 00:30 | AUD | GDP Q/Q Q4 | 0.50% | 0.30% |
| 00:30 | JPY | Services PMI Feb F | 53.1 | 53.1 |
| 01:45 | CNY | Caixin Services PMI Feb | 50.8 | 51 |
| 07:30 | CHF | CPI M/M Feb | 0.50% | -0.10% |
| 07:30 | CHF | CPI Y/Y Feb | 0.40% | |
| 08:50 | EUR | France Services PMI Feb F | 44.5 | 44.5 |
| 08:55 | EUR | Germany Services PMI Feb F | 52.2 | 52.2 |
| 09:00 | EUR | Eurozone Services PMI Feb F | 50.7 | 50.7 |
| 09:30 | GBP | Services PMI Feb F | 51.1 | 51.1 |
| 10:00 | EUR | Eurozone PPI M/M Jan | 0.30% | 0.40% |
| 10:00 | EUR | Eurozone PPI Y/Y Jan | 0% | |
| 13:15 | USD | ADP Employment Change Feb | 140K | 183K |
| 13:30 | CAD | Labor Productivity Q/Q Q4 | 0.30% | -0.40% |
| 14:45 | USD | Services PMI Feb F | 49.7 | 49.7 |
| 15:00 | USD | ISM Services PMI Feb | 53 | 52.8 |
| 15:00 | USD | Factory Orders M/M Jan | 1.50% | -0.90% |
| 15:30 | USD | Crude Oil Inventories | -2.3M | |
| 19:00 | USD | Fed's Beige Book |
| GMT | Ccy | Events | |
|---|---|---|---|
| 00:30 | AUD | GDP Q/Q Q4 | |
| Forecast: 0.50% | Previous: 0.30% | ||
| 00:30 | JPY | Services PMI Feb F | |
| Forecast: 53.1 | Previous: 53.1 | ||
| 01:45 | CNY | Caixin Services PMI Feb | |
| Forecast: 50.8 | Previous: 51 | ||
| 07:30 | CHF | CPI M/M Feb | |
| Forecast: 0.50% | Previous: -0.10% | ||
| 07:30 | CHF | CPI Y/Y Feb | |
| Forecast: | Previous: 0.40% | ||
| 08:50 | EUR | France Services PMI Feb F | |
| Forecast: 44.5 | Previous: 44.5 | ||
| 08:55 | EUR | Germany Services PMI Feb F | |
| Forecast: 52.2 | Previous: 52.2 | ||
| 09:00 | EUR | Eurozone Services PMI Feb F | |
| Forecast: 50.7 | Previous: 50.7 | ||
| 09:30 | GBP | Services PMI Feb F | |
| Forecast: 51.1 | Previous: 51.1 | ||
| 10:00 | EUR | Eurozone PPI M/M Jan | |
| Forecast: 0.30% | Previous: 0.40% | ||
| 10:00 | EUR | Eurozone PPI Y/Y Jan | |
| Forecast: | Previous: 0% | ||
| 13:15 | USD | ADP Employment Change Feb | |
| Forecast: 140K | Previous: 183K | ||
| 13:30 | CAD | Labor Productivity Q/Q Q4 | |
| Forecast: 0.30% | Previous: -0.40% | ||
| 14:45 | USD | Services PMI Feb F | |
| Forecast: 49.7 | Previous: 49.7 | ||
| 15:00 | USD | ISM Services PMI Feb | |
| Forecast: 53 | Previous: 52.8 | ||
| 15:00 | USD | Factory Orders M/M Jan | |
| Forecast: 1.50% | Previous: -0.90% | ||
| 15:30 | USD | Crude Oil Inventories | |
| Forecast: | Previous: -2.3M | ||
| 19:00 | USD | Fed's Beige Book | |
| Forecast: | Previous: | ||
Thursday, Mar 6, 2025
| GMT | Ccy | Events | Consensus | Previous |
|---|---|---|---|---|
| 00:30 | AUD | Building Permits M/M Jan | -0.10% | 0.70% |
| 00:30 | AUD | Trade Balance (AUD) Jan | 5.68B | 5.09B |
| 06:45 | CHF | Unemployment Rate Feb | 2.70% | 2.70% |
| 09:30 | GBP | Construction PMI Feb | 49.8 | 48.1 |
| 10:00 | EUR | Eurozone Retail Sales M/M Jan | 0.10% | -0.20% |
| 12:30 | USD | Challenger Job Cuts Y/Y Feb | -39.50% | |
| 13:15 | EUR | ECB Deposit Rate | 2.50% | 2.75% |
| 13:15 | EUR | ECB Main Refinancing Rate | 2.65% | 2.90% |
| 13:30 | CAD | Trade Balance (CAD) Jan | 1.4B | 0.7B |
| 13:30 | USD | Initial Jobless Claims (Feb 28) | 236K | 242K |
| 13:30 | USD | Trade Balance (USD) Jan | -93.1B | -98.4B |
| 13:30 | USD | Nonfarm Productivity Q4 | 1.20% | 1.20% |
| 13:30 | USD | Unit Labor Costs Q4 | 3% | 3% |
| 13:45 | EUR | ECB Press Conference | ||
| 15:00 | USD | Wholesale Inventories Jan F | 0.70% | 0.70% |
| 15:00 | CAD | Ivey PMI Feb | 50.6 | 47.1 |
| 15:30 | USD | Natural Gas Storage | -261B |
| GMT | Ccy | Events | |
|---|---|---|---|
| 00:30 | AUD | Building Permits M/M Jan | |
| Forecast: -0.10% | Previous: 0.70% | ||
| 00:30 | AUD | Trade Balance (AUD) Jan | |
| Forecast: 5.68B | Previous: 5.09B | ||
| 06:45 | CHF | Unemployment Rate Feb | |
| Forecast: 2.70% | Previous: 2.70% | ||
| 09:30 | GBP | Construction PMI Feb | |
| Forecast: 49.8 | Previous: 48.1 | ||
| 10:00 | EUR | Eurozone Retail Sales M/M Jan | |
| Forecast: 0.10% | Previous: -0.20% | ||
| 12:30 | USD | Challenger Job Cuts Y/Y Feb | |
| Forecast: | Previous: -39.50% | ||
| 13:15 | EUR | ECB Deposit Rate | |
| Forecast: 2.50% | Previous: 2.75% | ||
| 13:15 | EUR | ECB Main Refinancing Rate | |
| Forecast: 2.65% | Previous: 2.90% | ||
| 13:30 | CAD | Trade Balance (CAD) Jan | |
| Forecast: 1.4B | Previous: 0.7B | ||
| 13:30 | USD | Initial Jobless Claims (Feb 28) | |
| Forecast: 236K | Previous: 242K | ||
| 13:30 | USD | Trade Balance (USD) Jan | |
| Forecast: -93.1B | Previous: -98.4B | ||
| 13:30 | USD | Nonfarm Productivity Q4 | |
| Forecast: 1.20% | Previous: 1.20% | ||
| 13:30 | USD | Unit Labor Costs Q4 | |
| Forecast: 3% | Previous: 3% | ||
| 13:45 | EUR | ECB Press Conference | |
| Forecast: | Previous: | ||
| 15:00 | USD | Wholesale Inventories Jan F | |
| Forecast: 0.70% | Previous: 0.70% | ||
| 15:00 | CAD | Ivey PMI Feb | |
| Forecast: 50.6 | Previous: 47.1 | ||
| 15:30 | USD | Natural Gas Storage | |
| Forecast: | Previous: -261B | ||
Friday, Mar 7, 2025
| GMT | Ccy | Events | Consensus | Previous |
|---|---|---|---|---|
| CNY | Trade Balance (USD) Feb | 104.8B | ||
| 07:00 | EUR | Germany Factory Orders M/M Jan | -2.40% | 6.90% |
| 07:45 | EUR | France Trade Balance (EUR) Jan | -4.1B | -3.9B |
| 08:00 | CHF | Foreign Currency Reserves (CHF) Feb | 736B | |
| 10:00 | EUR | Eurozone GDP Q/Q Q4 | 0.10% | 0.10% |
| 13:30 | CAD | Net Change in Employment Feb | 17.8K | 76K |
| 13:30 | CAD | Unemployment Rate Feb | 6.70% | 6.60% |
| 13:30 | CAD | Capacity Utilization Q4 | 79.00% | 79.30% |
| 13:30 | USD | Nonfarm Payrolls Feb | 156K | 143K |
| 13:30 | USD | Unemployment Rate Feb | 4% | 4% |
| 13:30 | USD | Average Hourly Earnings M/M Feb | 0.30% | 0.50% |
| GMT | Ccy | Events | |
|---|---|---|---|
| CNY | Trade Balance (USD) Feb | ||
| Forecast: | Previous: 104.8B | ||
| 07:00 | EUR | Germany Factory Orders M/M Jan | |
| Forecast: -2.40% | Previous: 6.90% | ||
| 07:45 | EUR | France Trade Balance (EUR) Jan | |
| Forecast: -4.1B | Previous: -3.9B | ||
| 08:00 | CHF | Foreign Currency Reserves (CHF) Feb | |
| Forecast: | Previous: 736B | ||
| 10:00 | EUR | Eurozone GDP Q/Q Q4 | |
| Forecast: 0.10% | Previous: 0.10% | ||
| 13:30 | CAD | Net Change in Employment Feb | |
| Forecast: 17.8K | Previous: 76K | ||
| 13:30 | CAD | Unemployment Rate Feb | |
| Forecast: 6.70% | Previous: 6.60% | ||
| 13:30 | CAD | Capacity Utilization Q4 | |
| Forecast: 79.00% | Previous: 79.30% | ||
| 13:30 | USD | Nonfarm Payrolls Feb | |
| Forecast: 156K | Previous: 143K | ||
| 13:30 | USD | Unemployment Rate Feb | |
| Forecast: 4% | Previous: 4% | ||
| 13:30 | USD | Average Hourly Earnings M/M Feb | |
| Forecast: 0.30% | Previous: 0.50% | ||
Markets Weekly Outlook – Tariffs, NFP and ECB Meeting on the Agenda
- Tariffs have been the primary driver of market volatility.
- US economic data shows signs of a potential stall, with consumer spending down and inflation remaining high.
- The S&P 500 and Nasdaq 100 are struggling, and the Fear and Greed index is in fear territory.
- Next week’s focus includes potential US tariffs, China’s Two Sessions meeting, and the ECB’s interest rate decision.
Week in Review: Tariff Chatter Continues to Drive Market Moves
Markets have been through another week where tariffs have been the driving force behind market moves. The PCE data which I had thought would be the major event for the week failed to stoke any real volatility and that is testament to what we have seen in 2025 thus far.
Markets are more occupied with the moves of the Trump administration than they are about the data.
US data this week showed signs that the economy may be stalling while overall market sentiment has been dented by tariff chatter and inflationary concerns. This was reflected in the CB consumer confidence data which showed a significant uptick in the 12 month interest rate expectations by consumers.
U.S. consumer spending dropped in January for the first time in almost two years, and the goods trade gap hit a record high as businesses sped up imports to avoid tariffs. This points to weak economic growth or even a possible contraction this quarter.
Data from the Commerce Department also showed that while inflation slowed down yearly, prices remain stubbornly high with steady monthly increases. Meanwhile, the Trump administration is increasing tariffs, which economists warn will lead to higher prices as businesses pass costs to consumers.
Sources: LSEG Datastream (click to enlarge)
Inflation expectations among consumers rose sharply in February. The Atlanta Federal Reserve cut its first-quarter GDP forecast, now predicting the economy will shrink by 1.5% annually instead of growing at the earlier estimate of 2.3%.
The S&P 500 and Nasdaq 100 struggles continued this week which is no surprise given the current market dynamics. The Fear and Greed index is now in fear territory as tariff chatter ramps up and economic data continues to underwhelm.
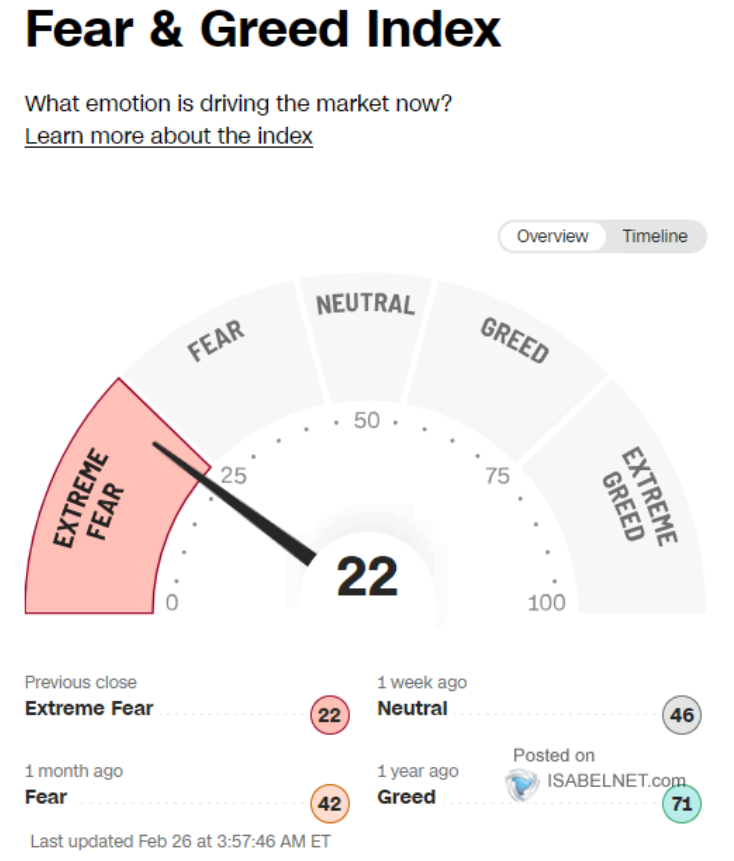
Source: Isabelnet (click to enlarge)
On the FX front,the Dollar returned to its king status this week weighing on US dollar denominated pairs with the Euro losing ground and retreating from the psychological 1.0500 handle.
Gold is the biggest loser this week and I was taken aback by the selloff. Mostly down to the fact that tariffs have until now been a positive for safe haven demand. The only explanation I can see is potential profit taking and gold traders concerned by the rise in inflation expectations.
Oil prices also struggled this week on growing concerns about global growth and Oil demand. A disagreement by OPEC + members on an output increase from April provided a brief respite on Thursday but was followed by another bearish day to end the week.
Crypto markets are also feeling the pinch with Bitcoin on course for its biggest weekly drop since the collapse of FTX in 2022.
The Week Ahead: Tariffs at the Forefront. Will Trump Follow Through?
Asia Pacific Markets
The main focus this week in the Asia Pacific region for me is China’s Two Sessions meeting.
Markets are closely watching China’s Government Work Report, which Premier Li Qiang will deliver on March 5. It will reveal the country’s 2025 growth target and outline key policies. China is expected to keep its growth goal at “around 5.0%,” the same as in 2024, while giving more details about fiscal and monetary plans.
This Saturday morning, China will release its official February purchasing managers’ index (PMI), with a slight growth at 50.1 expected. The Caixin PMI will follow on Monday. On Friday, China Customs will provide the first trade data for the first two months of 2025.
Europe + UK + US
In developed markets, the US PCE data released last week failed to shake markets as expected but the Trump administrations continue to throw curveballs for Global Market participants to navigate.
Next week is important for the US, with trade tariffs on imports from China, Mexico, and Canada possibly starting on March 4, along with key economic data, like the February jobs report.
President Trump argues that foreign countries will bear the cost due to a stronger dollar, but consumer prices may rise, similar to past tariffs. Consumer confidence is already shaky due to spending concerns and austerity measures, and more tariff news could worsen the outlook and dent overall market sentiment.
Economic data, including the ISM reports, is expected to show slow growth. Manufacturing and services surveys suggest a weaker outlook, and corporate caution over changing trade policies may lead to only a small rise in payrolls. Federal job cuts may take months to show a clear impact.
Next week, the European Central Bank will decide on interest rates after reviewing a new inflation report. A 0.25% rate cut is expected, though inflation might rise in February before easing. With more hawkish voices in the ECB, debates on the final rate for the eurozone are growing more important.
Unemployment is also in focus. Despite businesses cutting jobs recently, the unemployment rate remains at a record low of 6.3%. Any shift in the labor market could impact how far the ECB can lower rates.
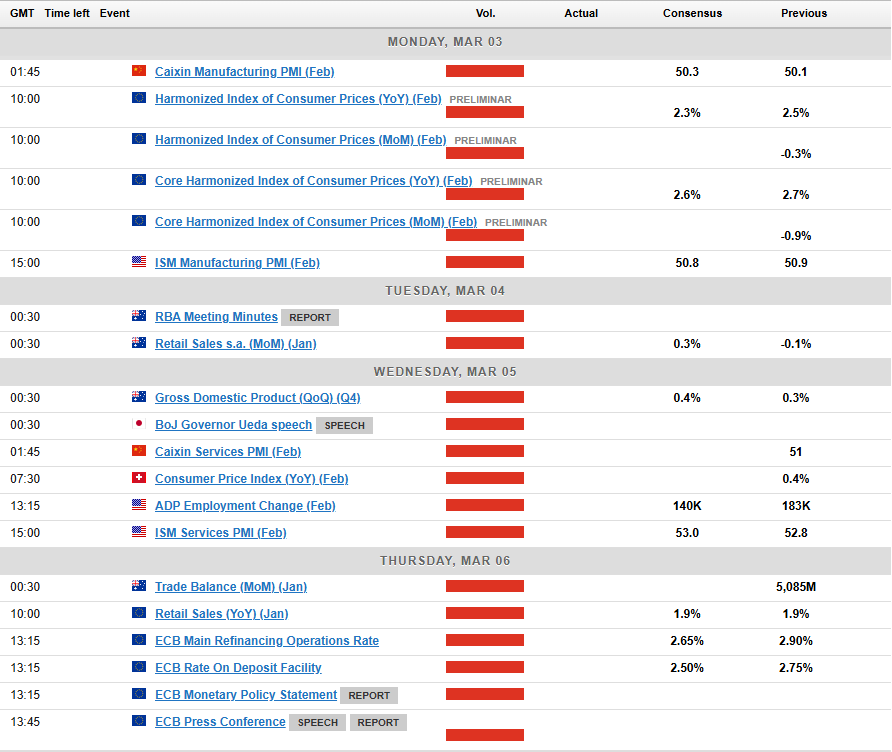
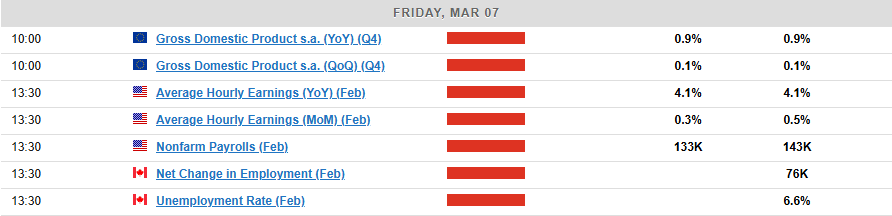
Chart of the Week
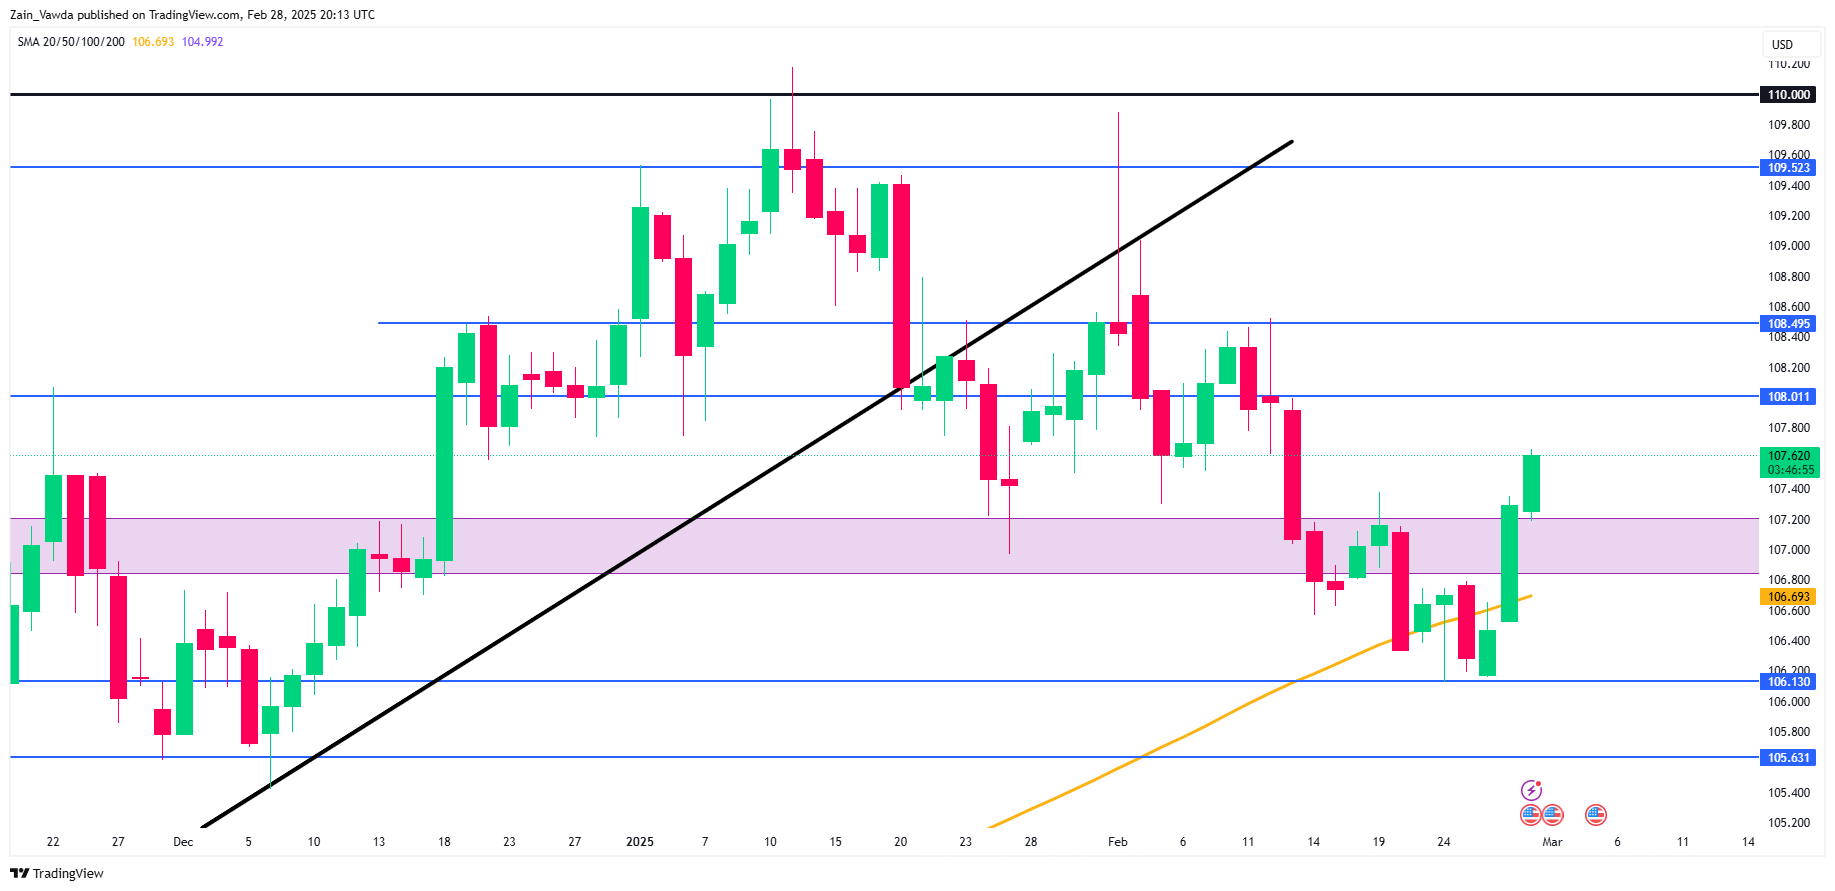
This week’s focus is on the US Dollar Index (DXY) after a solid recovery this week which has propelled the DXY back above the 107.00 handle.
A lot of the move was down to the tariff chatter which arose toward the backend of the week and that is likely to carry over into next week.
Currently the DXY is supported by the 107.00 handle with the 100-day MA resting at 106.700 also likely to provide support.
Immediate resistance rests at 108.00 before the 108.49 handle comes into focus.
US Dollar Index Daily Chart – February 28, 2025
Source:TradingView.Com (click to enlarge)
Key Levels to Consider:
Support
- 107.00
- 106.13
- 105.63
Resistance
- 108.00
- 108.49
- 109.52
The Weekly Bottom Line: Deadline 2.0
Canadian Highlights
- President Trump signalled that broad-based tariffs on Canadian exports will come into effect on March 4th. The wait is on to see if they are indeed implemented.
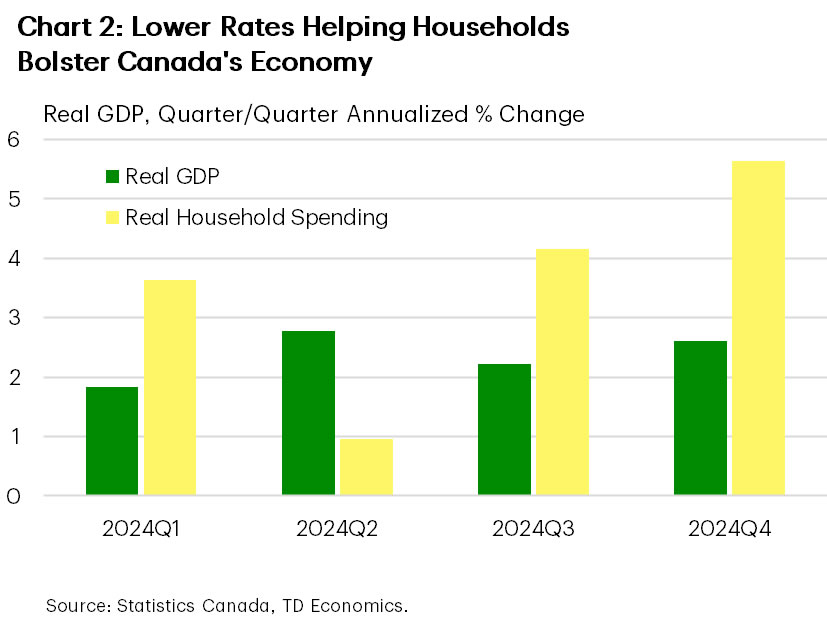
- If enacted, these tariffs would hit just when the economy is on the mend. Canada’s economy advanced at a healthy 2.6% annualized rate in Q4, bolstered by consumer spending.
- Although markets currently judge it as a near 50/50 proposition, we think the Bank of Canada will cut their policy rate on March 12th.
U.S. Highlights
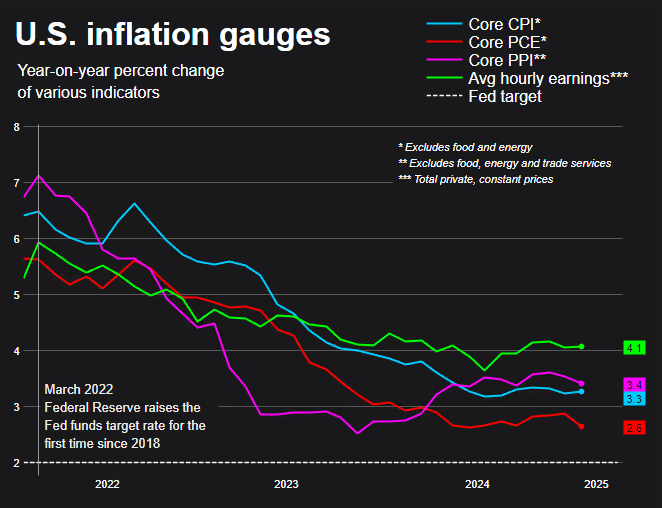
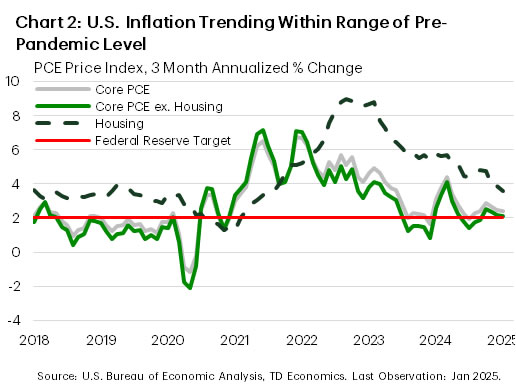
- The Fed’s preferred inflation metric, core PCE, rose 2.6% year-on-year in January, in-line with expectations and continuing to converge with the Fed’s 2% target.
- The Conference Board’s Consumer Confidence Index showed a material decline in February, as tariffs weighed on sentiment and boosted inflation expectations.
- The President announced an additional 10% tariff on China set to take effect on March 4th, in concert with the previously announced 25% tariffs against Canada and Mexico.
Canada – Deadline 2.0
Markets were in a dour mood this week, directly related to President Trump’s repeated threat of broad-based tariffs to begin next Tuesday, March 4th. There was a bit of “will he, won’t he”, with respect to these threats. The signal from the Oval Office on Monday appeared to indicate that they’ll proceed. This message got muddied on Wednesday during a U.S. cabinet meeting, where it seemed as though they could be punted for another month. Unfortunately, Canadians got concerning clarification from President Trump on Thursday that they are indeed set to be enacted next week. The Canadian dollar was down over one cent USD in the week (as of writing). Meanwhile, the Canadian 10-year yield was lower by around 20 bps to 3%.
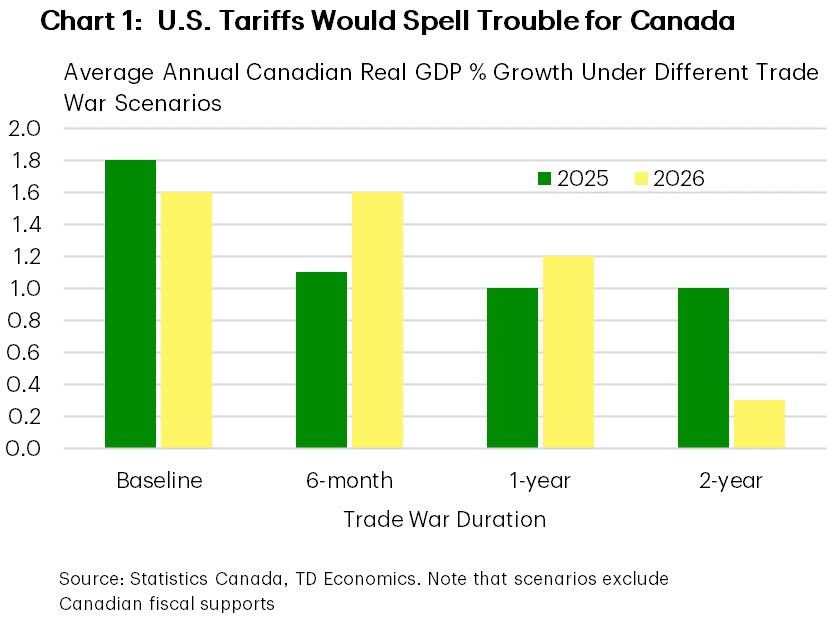
Of course, we’ve done this dance before. Just a few weeks ago, U.S. tariffs were paused at the 11th hour after negotiations between President Trump and Prime Minister Trudeau. So, it remains to be seen if March 4th will mark the beginning of a harmful trade war, or if cooler heads will prevail again. When forecasting the potential damage to the Canadian economy, the one unknown is how long punitive 25% tariffs would be in effect. Our latest Q&A presents economic growth outcomes that could unfold depending on how long U.S. tariffs (and reciprocal ones from Canada), are in place. A two-year trade war would hamper growth well into 2026, whereas as a six-month duration could see growth rebounding smartly next year, although both scenarios would see deteriorating conditions in 2025 (Chart 1).
Although there’s never an ideal time for a trade war, high tariffs would thump the Canadian economy just as it’s on the mend. Indeed, job growth has been robust for three straight months in the Labour Force Survey (LFS), and even this week’s payroll jobs report (which had been lagging it’s LFS counterpart) showed an increase in employment in December. What’s more, investment intentions in the capital and repair expenditures survey pointed to an above-trend 6% gain in non-residential spending by Canadian companies and governments in 2025 (see commentary). However, this result comes with the huge caveat that it only partially captured tariff threats, which really ramped up after the survey’s cut-off date. And, in the marquee release of the week, Canadian real GDP jumped 2.6% annualized in the fourth quarter. Details of the report were favourable as well, with lower interest rates, government stimulus measures, and decent income growth propelling a huge gain in consumer spending (Chart 2).
In the wake of the robust GDP data, markets pared back their expectations of a rate cut by the Bank of Canada on March 12th. However, markets are still placing about a 50% chance that a cut will take place. We think the Bank will cut their policy rate next month, even with what is a solidly improving current economic backdrop. In our view, it’s prudent from a risk-management perspective to insulate against downside growth risks by cutting the policy rate again. Of course, if a Canada-U.S. trade war does start next week, this would virtually lock in another cut next month. And now, we wait.
U.S. – Angst Builds with Tariff Threats
The final week of February included an update on the health of the American consumer, and the Federal Reserve’s preferred inflation metric. Meanwhile, financial markets remained cautious as the prospect for broad-based tariffs to go into effect next week against the nation’s three largest trading partners kept sentiment subdued. As of the time of writing, the S&P 500 was down 2.3% on the week, while the 10-year Treasury yield fell nearly 20 basis-points to 4.24%.
The impact of tariff threats on consumer confidence has partially contributed to the negative sentiment in financial markets over the past week. Last Friday, the University of Michigan consumer sentiment index fell to its lowest level in 15 months, and this was followed by the Conference Board Consumer Confidence Index dropping sharply this week to an eight-month low. The Conference Board’s survey also noted that mentions of trade and tariffs had risen to a level last seen in 2019. While we saw real personal consumption expenditures fall 0.5% month-on-month in January in data released this week, severe weather undoubtedly played a role.
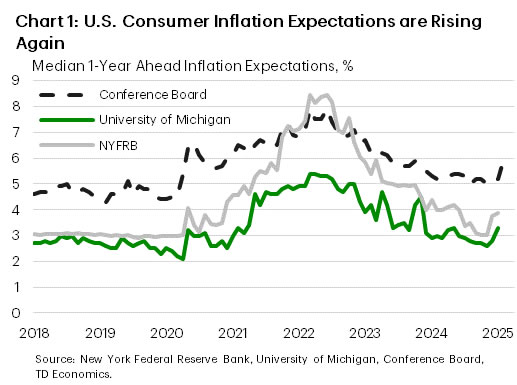
At the same time, consumer surveys have also begun to show signs of rising inflation expectations (Chart 1), which could present a risk for the Federal Reserve’s mission to return inflation to their 2% target. Core PCE inflation, the Fed’s preferred metric, rose 2.6% year-on-year in January. Looking at the three-month annualized percentage change, momentum has continued to trend favorably (Chart 2) with both the housing and excluding housing subcategories within range of pre-pandemic levels. However, these metrics remain slightly elevated on aggregate, which supports the Federal Reserve’s holding pattern. This, combined with rising inflation expectations, is also likely why several of the Federal Reserve officials we heard from this week favored a patient approach to future monetary policy adjustments, particularly amid elevated uncertainty. Market pricing has the Fed returning to rate cuts in June, with one additional rate cut before year end – in line with the median FOMC official projection from December.
Looking ahead to next week, there will be plenty to keep markets on their toes. First up will be the potential for the 25% tariffs on Canada and Mexico, plus the new additional 10% tariff on China announced this week, to be implemented next Tuesday. If an eleventh-hour resolution cannot be achieved again, then significant trade disruptions would likely follow. President Trump will also be delivering his State of the Union address on Tuesday, which may include new policy considerations. Lastly, we’ll round out the week with the employment report for February on Friday, which will be the last employment report released prior to the Fed’s next meeting in mid-March. Consensus expectations currently call for 158k new jobs to have been created this month, which would likely be viewed positively by the Federal Reserve. All-in-all, there will be plenty of information released next week to guide expectations in the months ahead.