Sample Category Title
Fed’s Goolsbee: Rate cuts on hold until policy uncertainty clears
Chicago Fed President Austan Goolsbee emphasized the need for caution before resuming rate cuts, citing uncertainty over the economic impact of the Trump administration’s policies.
Speaking in a TV interview overnight, Goolsbee stated that Fed remains in “wait-and-see” mode as it assesses the effects of new tariffs, immigration policies, tax cuts, government spending reductions, and federal workforce changes.
Goolsbee made it clear that if the administration’s policies push inflation higher, Fed is obligated by law to respond accordingly. However, he stressed that the overall policy package remains unclear, making it difficult for Fed to determine its next steps.
“There’s a lot of uncertainty, a lot of kind of dust in the air, and before the Fed can go back to cutting the rates, I feel and have expressed that we got to get a little dust out of the air,” he said.
BoE’s Dhingra reaffirms dovish stance, signals concern over weak consumption
BoE MPC member Swati Dhingra, one of the most dovish voices on the committee, reinforced her call for faster rate cuts. She argued that policy remains overly restrictive despite ongoing disinflation.
Dhingra, who voted for a 50bps rate cut earlier this month, pushed back against the common interpretation that gradual easing cycle means 25bps cuts per quarter, stating that "that's not actually what the committee has said. That's not my definition, clearly." She emphasized that even under the assumption of quarterly 25bps cuts, monetary policy would still be "in restrictive territory all of this year".
Her primary concern remains the persistent weakness in consumer spending, stating that "consumption remains pretty weak, so we’re not seeing that resurgence of inflationary pressures." She also noted that the slow recovery in demand justifies a more accommodative stance, as "we basically aren’t recovering fully."
Despite concerns about potential inflationary pressures in certain items, Dhingra maintained that the disinflation process remains intact. She believes the key takeaway is that monetary policy is still restrictive, and reducing the level of restraint would not necessarily derail inflation's downward trend.
Her remarks highlight a clear divide within the MPC, where some members advocate patience, while doves like Dhingra and Catherine Mann argue that rate cuts should come sooner and in larger increments.
Gold (XAU/USD) Retreats From Fresh All-Time Highs, Bulls Remain in Control
- Gold is nearing the $3000/oz mark, potentially reaching it briefly before a pullback.
- Concerns about the stock market and a murky Fed outlook are driving investors towards gold.
- Key economic data releases this week include US GDP and PCE data.
Risk aversion persisted in the markets today, as the end of February draws to a close. The risk aversion tone is a result of the ongoing uncertainty of US trade and tariff policy.
President Trump agreed to suspend tariffs for one month on Canada and Mexico in exchange for certain concessions. Will the tariffs be delayed again and scrapped entirely, is the question on the minds of market participants?
Golds Impressive 2025 – More to Come?
The Gold price rally in 2025 has also coincided with a weaker US Dollar.
Is the gold rally exhausted or will a touch of $3000/oz occur this week? That is the pertinent question this week, as $3000/oz remains a possibility.
By Friday, gold had climbed for the eighth week in a row, marking its best streak since 2020, which saw nine straight weeks of gains. While this could indicate the rally is losing steam, gold is so close to the $3,000 mark that it’s likely to at least touch that level briefly before pulling back.
Will Gold Outperform Stocks in 2025?
There is a growing belief that Gold prices may outperform stocks in 2025 as market concerns keep the metal elevated. Excluding the uncertainties around tariffs, central banks are another piece of the puzzle, with the Fed outlook in particular seeming murky.
Concerns around the stock market being overvalued and with retailers concerned about performance moving forward, this is becoming a real possibility.
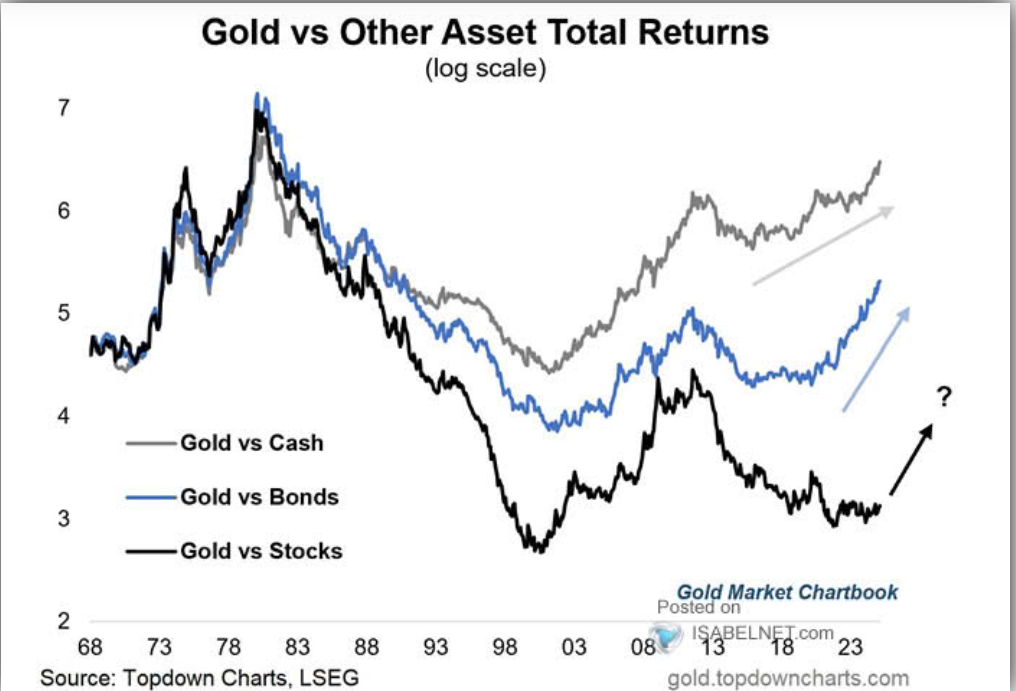
Source: LSEG, Isabelnet
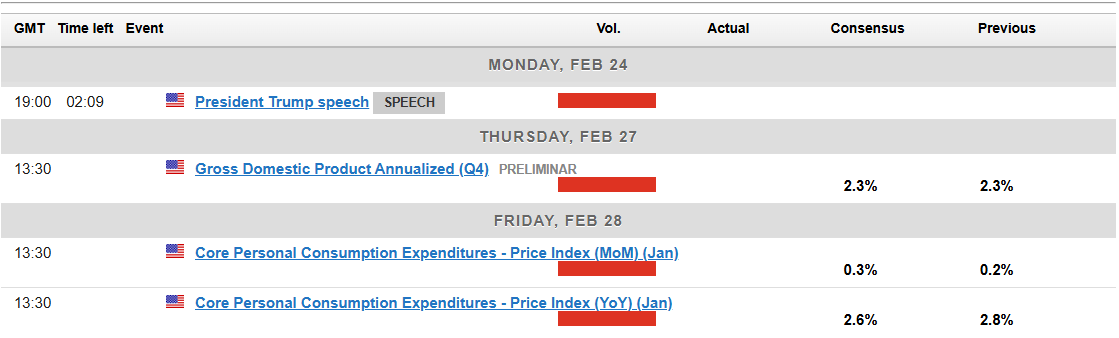
Data for the Rest of the week
Traders will keep an eye on the US GDP report for the fourth quarter of 2024, due later this week. Recent signs of a slowdown in the US economy, like Friday’s weaker Services PMI data, have added to the interest in this report.
There are also a host of Federal Reserve policymakers who will be speaking this week. The biggest event though from my point of view will be the Feds Preferred inflation gauge, the PCE data release on Friday.
Given the recent uptick in inflation, Fed Chair Powell urged caution about reading too much into the data. He mentioned that the Fed prefers the PCE data and thus making this data release a massive one.
Technical Analysis – Gold (XAU/USD)
Gold saw a pullback in Asian trade before bulls took control once more, propelling the precious metal to fresh all-time highs around 2956.
This move was met by significant selling pressure pushing price back down to 2930. Is this a sign of waning bullish momentum?
That is the question as the huge psychological $3000/oz handle lies in wait.
Bulls remain firmly in control at present with a break of 2956 opening up a test of 2975 on route to 3000.
I still think the 3000 handle will be hit, but the precious metal may struggle to find acceptance above this level at the first time of asking.
When we compare the current 8-week gold rally to the 9-week rally in 2020, the current one shows stronger momentum. Back in 2020, the rally ended with a bearish hammer indicating a pullback, but last week, gold closed near its highs.
Unless we see a clear reason to sell, like a drop in the stock market, gold might still hit $3,000 briefly. However, $3,000 is a significant level, and many might take profits quickly if it gets there.
Gold (XAU/USD) Daily Chart, February 24, 2025
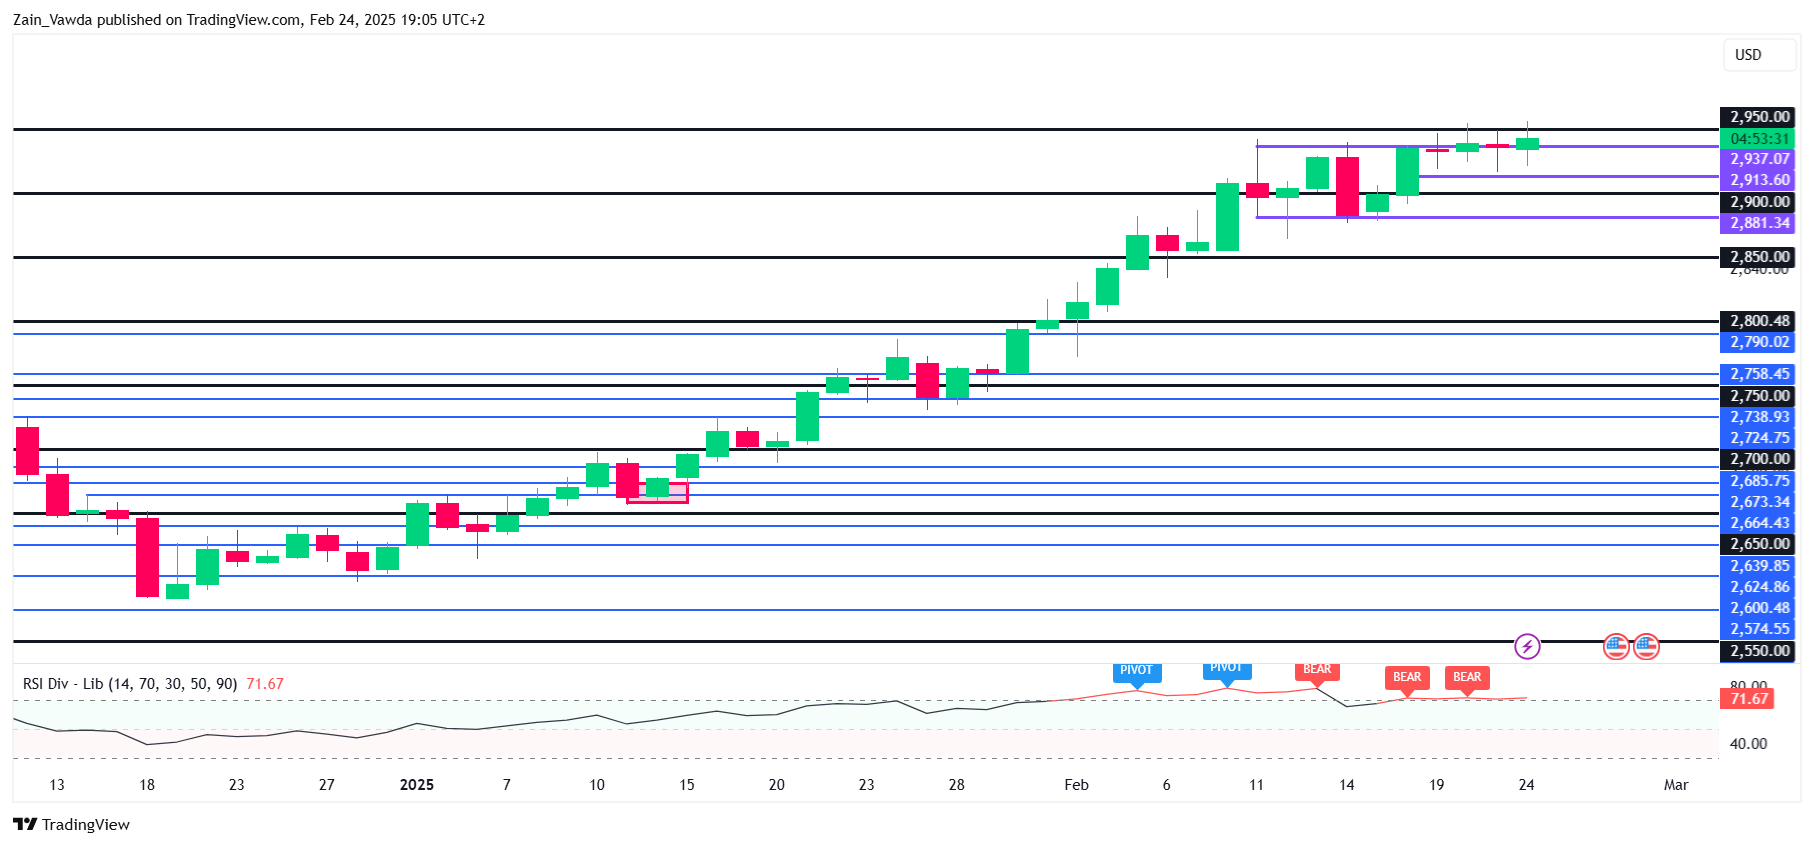
Source: TradingView (click to enlarge)
Support
- 2930
- 2900
- 2882
Resistance
- 2956
- 2975
- 3000
Nasdaq 100 Outlook: Bulls Got Spooked by Stagflation Fears
- The recent steep rise in the US 5-year breakeven inflation rate to 2.61%, a two-year high coupled with the unexpected contraction seen in the S&P Global flash US Services PMI for February has increased the odds of a stagflation environment.
- An increasingly less dovish monetary policy stance is likely to be adopted by the US Federal Reserve, in turn, tighten liquidity conditions that may trigger a medium-term negative feedback loop into the US stock market.
- Bearish technical elements in terms of trend condition and market breadth have emerged on the Nasdaq 100.
- The medium-term uptrend phase of the Nasdaq 100 since 5 August 2024 is at a critical juncture of a potential trend change towards a multi-week corrective decline sequence.
Despite the Nasdaq 100’s earlier single-day loss of -3% on 27 January inflicted by Chinese Artificial Intelligence (AI) start-up DeepSeek’s cutting-edge capabilities with lower operational costs, the price actions of Nasdaq 100 have remained resilient in the entire month of February.
It continued its upward climb but in a choppy fashion to recoup its January losses and printed a fresh all-time closing high of 22,176 on 19 February.
However, stagflation fears have resurfaced last week. Firstly, several US Federal Reserve officials as expressed in their respective discussions, noted in the latest FOMC minutes have flagged concerns of heightened inflationary pressures in the US if the White House follows through with its hawkish trade tariffs policy.
Secondly, the S&P Global flash US Services PMI data for February fell sharply unexpectedly to a contractionary level of 49.7 from 52.9 in the previous month, its first contraction in the services sector activity in the US over two years.
Given that the services sector contributes to almost three-quarters of US economic growth, the latest contractionary reading of the S&P Global flash US Services PMI, a leading economic growth indicator has triggered a “growth scare infused with sticky inflation” feedback loop into the US stock market that torpedoed all the four major US benchmark stock indices on last Friday. The Nasdaq 100 declined by almost 2%, its worst single-day decline in two months.
Inflationary expectations continued to divert further away from the Fed’s 2% target
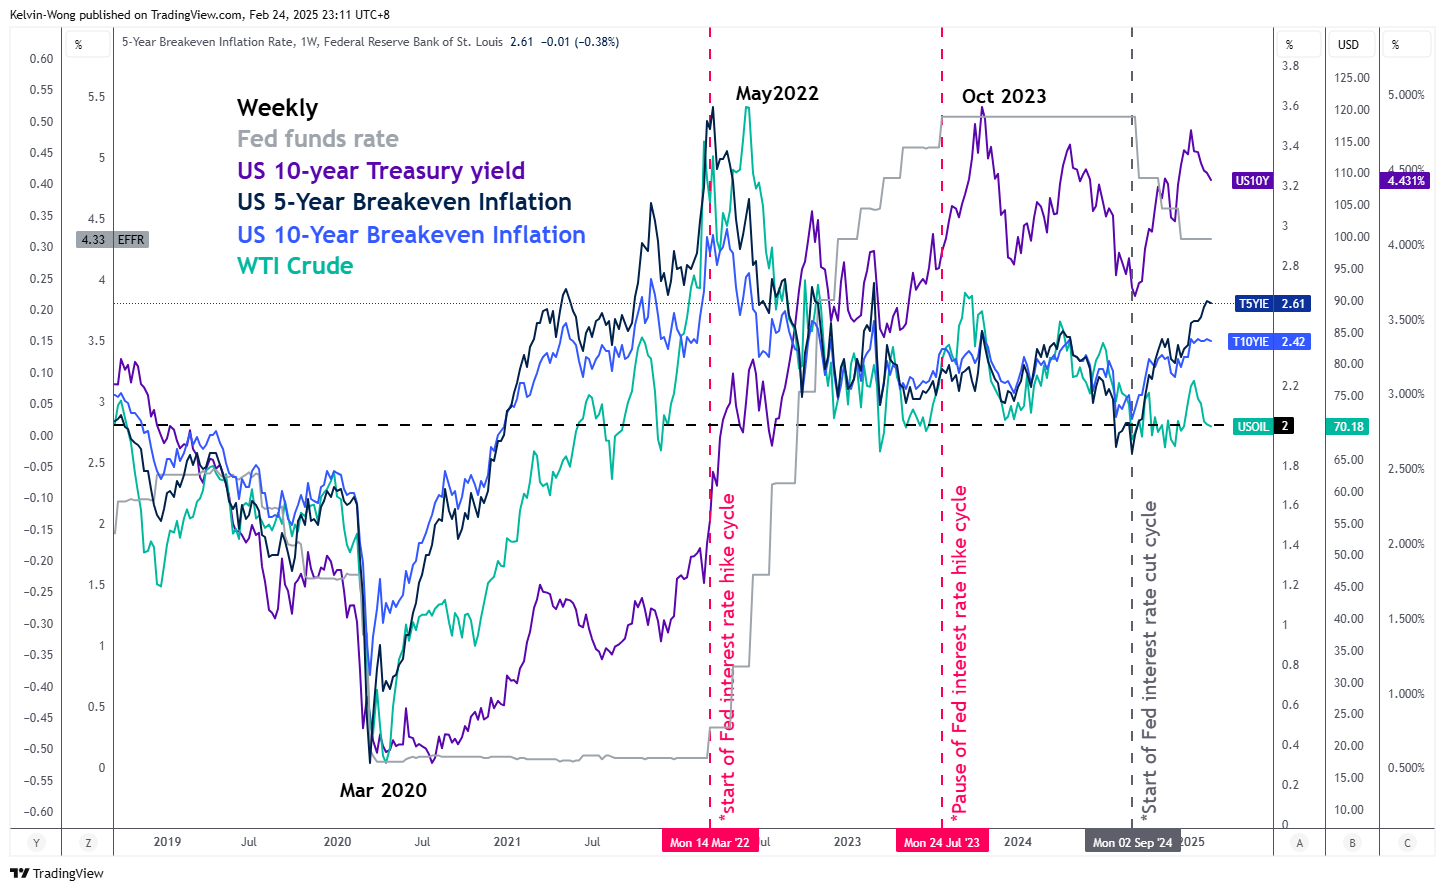
Fig 1: 5-year & 10-year US breakeven inflation rates as of 21 Feb 2025 (Source: TradingView, click to enlarge chart)
Market-transacted inflationary expectations (breakeven inflation rates) in the US as inferred from the prices of Treasury Inflation-Protected Securities (TIPS) have surged significantly since December 2024.
The 5-year breakeven inflation rate has climbed to 2.61% as of last Friday, 21 February, its highest level in almost two years (see Fig 1).
Hence, the Fed is likely to adopt a less dovish monetary policy guidance in 2025 which may lead to a liquidity-tightening condition that is likely to be detrimental to US stock indices due to a higher cost of funding environment that can dampen earnings growth.
Bearish technical elements surfaced on the Nasdaq 100 ahead of Nvidia’s earnings results
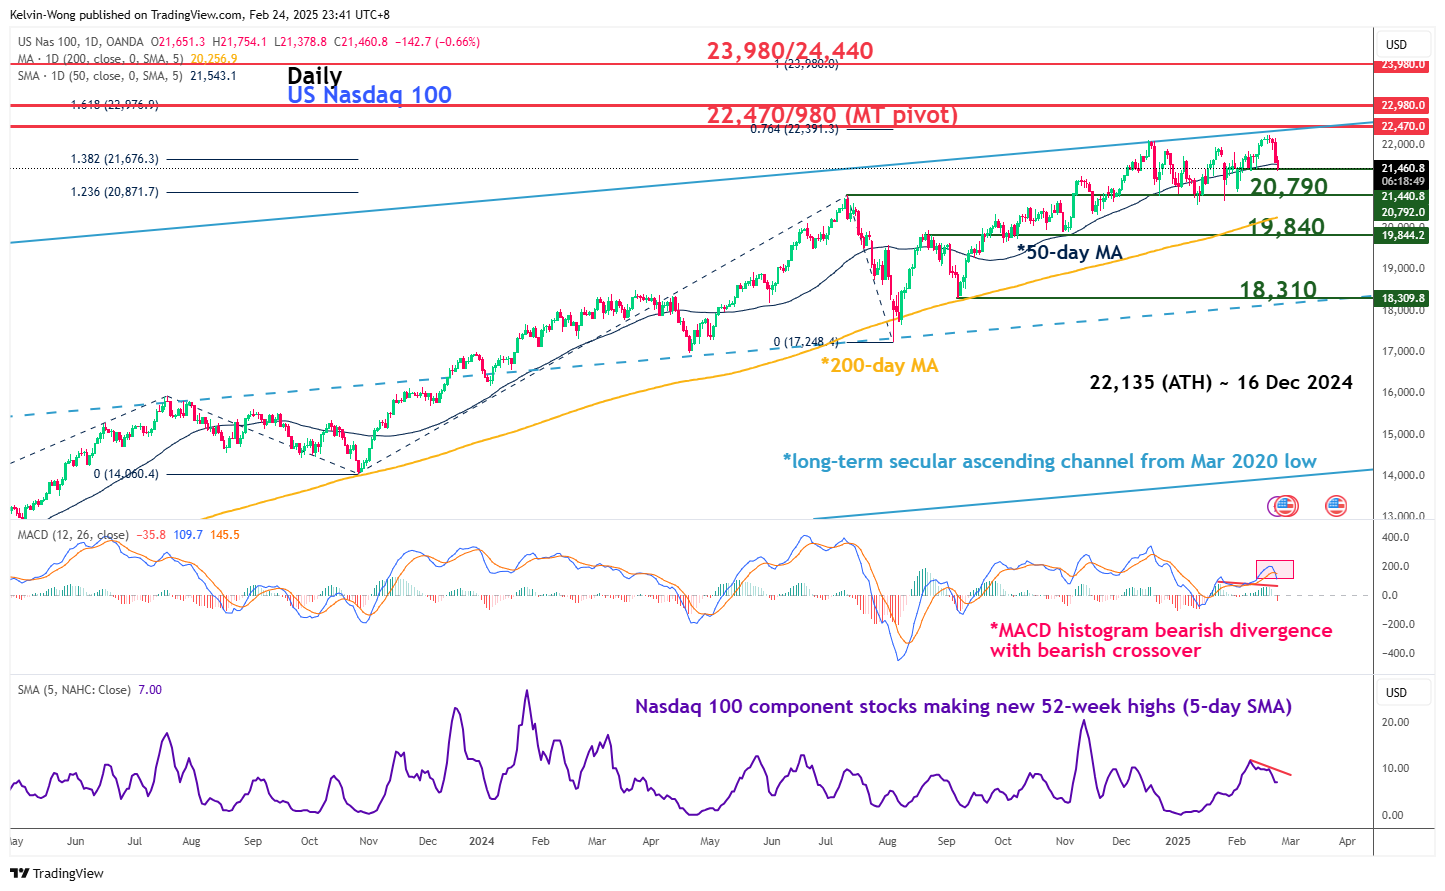
Fig 2: Nasdaq 100 CFD major & medium-term trends as of 24 Feb 2025 (Source: TradingView, click to enlarge chart)
US AI juggernaut Nvidia, also the second biggest market cap component stock in the Nasdaq 100 will report its fourth-quarter earnings results for calendar year 2024 on Wednesday, 26 February after the close of the US cash stock market session.
Interestingly, the trend condition and market breadth elements of the Nasdaq 100 are not so rosy at this juncture.
The daily MACD trend indicator flashed out an earlier bearish divergence on its histogram on 18 February coupled with a recent MACD signal line bearish crossover last Friday, 21 February. These observations suggest the bullish momentum of the medium-term uptrend phase of the Nasdaq 100 from the 5 August 2024 low may be exhausted, and a trend change towards a potential corrective decline sequence may be imminent.
In addition, the number of Nasdaq 100 component stocks that are making new 52-week highs (smoothed by a 5-day moving average) are lesser since 11 February while the Nasdaq 100 scaled to a fresh all-time closing high on 19 February which represents a weak market breadth condition at this juncture.
Watch the key 20,790 intermediate support on the Nasdaq 100 CFD Index (a proxy of Nasdaq 100 E-mini futures), and a daily close below it may trigger a multi-week corrective decline sequence to expose the medium-term supports of 19,840 and 18,310 (see Fig 2).
On the other hand, clearance above the 22,470/980 medium-term pivotal resistance zone invalidates the bearish scenario for the continuation of its impulsive upmove sequence for the next medium-term resistance zone to come in at 23,980/24,440 in the first step.
USDCHF Technical Analysis
The USDCHF pair fell for three straight sessions, trading around 0.8960 during Monday’s Asian session. The daily chart shows a bearish trend, with the pair staying below the 9- and 14-day Exponential Moving Averages (EMAs). The 14-day Relative Strength Index (RSI) is below 50, signaling continued weakness. If the pair drops further, it could find support at 0.8900, with a break below that possibly leading to the two-month low of 0.8736. On the upside, resistance levels are at 0.9009 and 0.9026, based on the 9- and 14-day EMAs. A break above these could boost momentum toward the recent high of 0.9201.
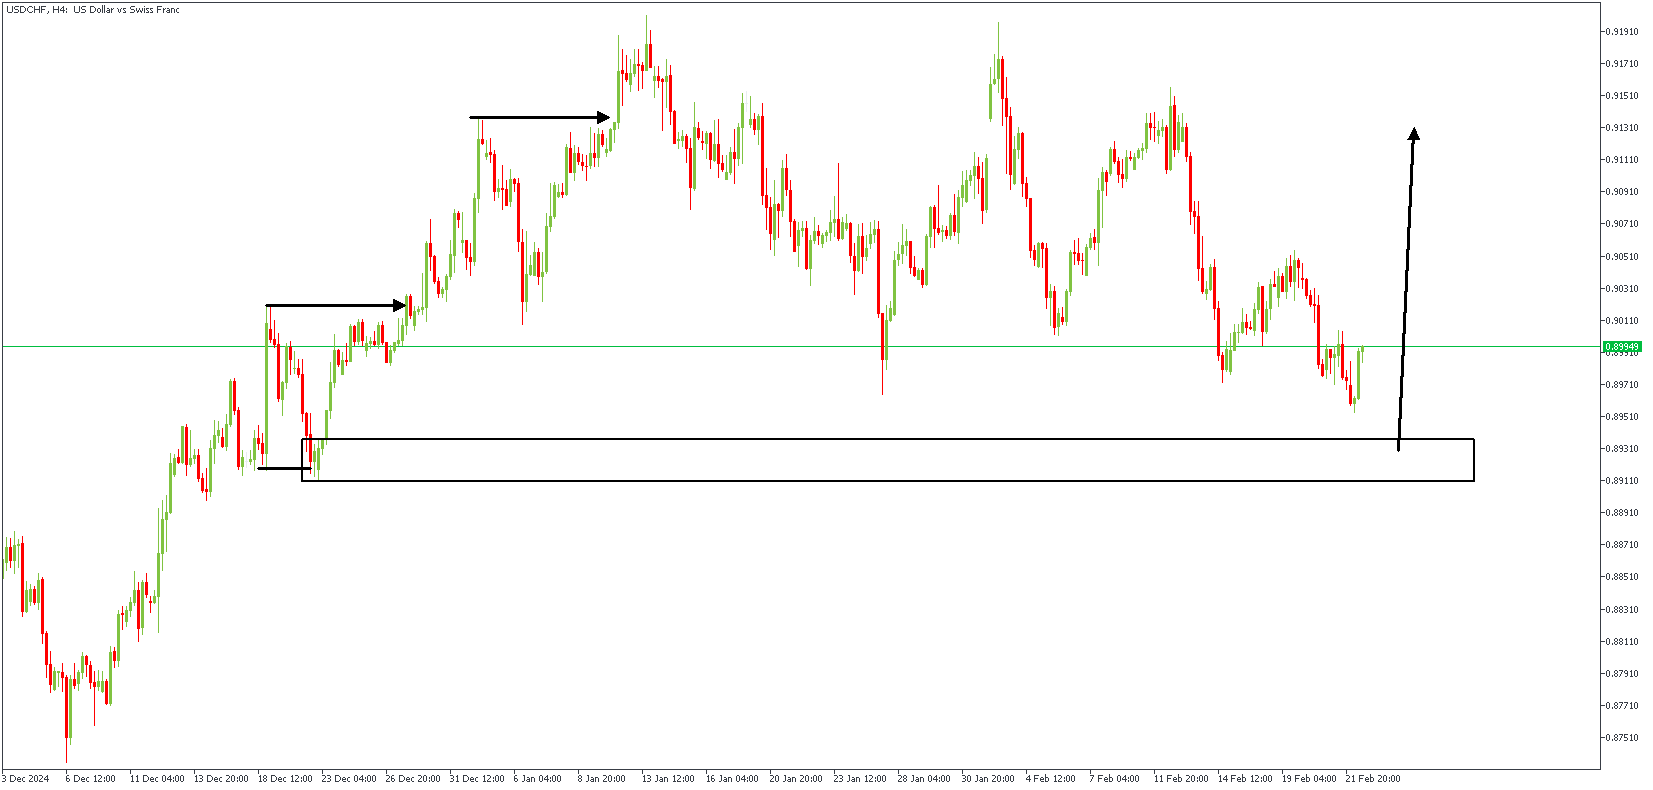
USDCHF – H4 Timeframe
When the price sweeps above/below a previous turning point (high or low) before breaking the structure in the opposite direction, the new high/low created becomes a “protected” point. Regarding the price action on the 4-hour timeframe chart of USDCHF, we see that the price is currently approaching a “protected” low after having printed a double break of the structure pattern. The expected outcome here is bullish.
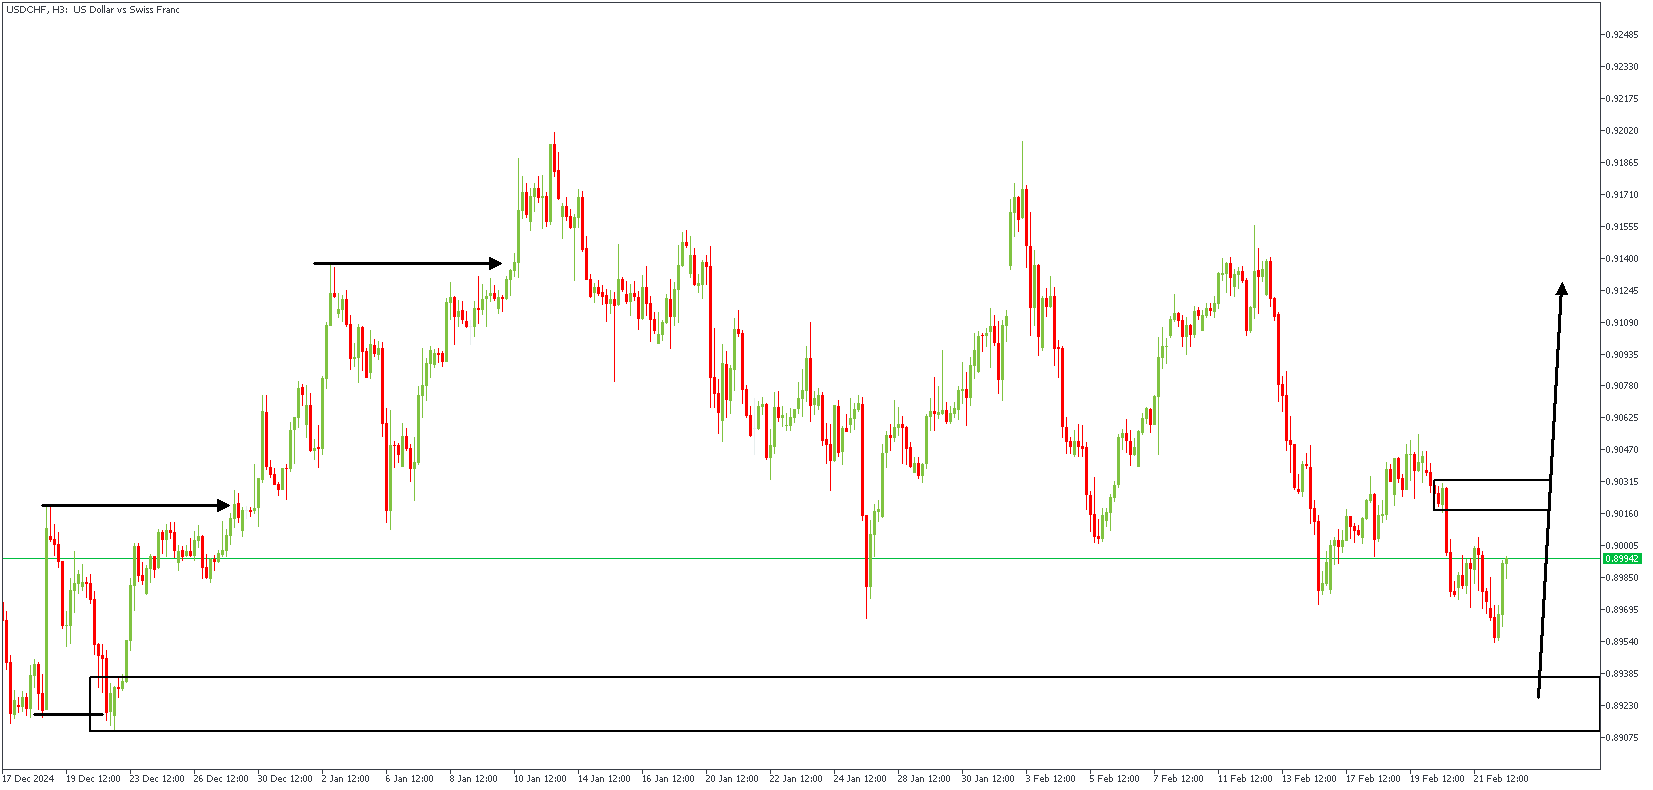
USDCHF – H3 Timeframe
On the 3-hour timeframe chart of USDCHF, the price still has an unfilled FVG (fair value gap) area, meaning it could be seeking an avenue to return to the FVG before embarking on the bullish continuation.
Analyst’s Expectations:
- Direction: Bullish
- Target- 0.91199
- Invalidation- 0.88900
CADCHF Technical Analysis
Bank of Canada (BoC) Governor Macklem has recently said the economy is improving due to stronger consumer demand but warned that a trade war with the US could cause serious harm. He estimated that such a conflict could shrink Canada’s economy by nearly 3% over two years and lower long-term growth by 2.5%. Macklem emphasized that the situation is uncertain, and the BoC will adjust its policy as needed at the 12th Mar. meeting. The Canadian Dollar (CAD) weakened last week, particularly against the Japanese Yen (JPY), falling below 105 to its lowest level since last September. This drop broke a key support level, suggesting the CAD could decline further. Diverging policies between the BoC and Bank of Japan (BoJ) and trade tensions may continue to pressure the CAD.
CADCHF – H4 Timeframe
The price action on the 4-hour timeframe chart of CADCHF has recently been rejected off the demand zone at the origin of a double break of structure pattern. This has led to a reversal in the initial bearish momentum, thus implying a change in the trend. At present, the bullish impulse is expected to push prices to create a new higher high.
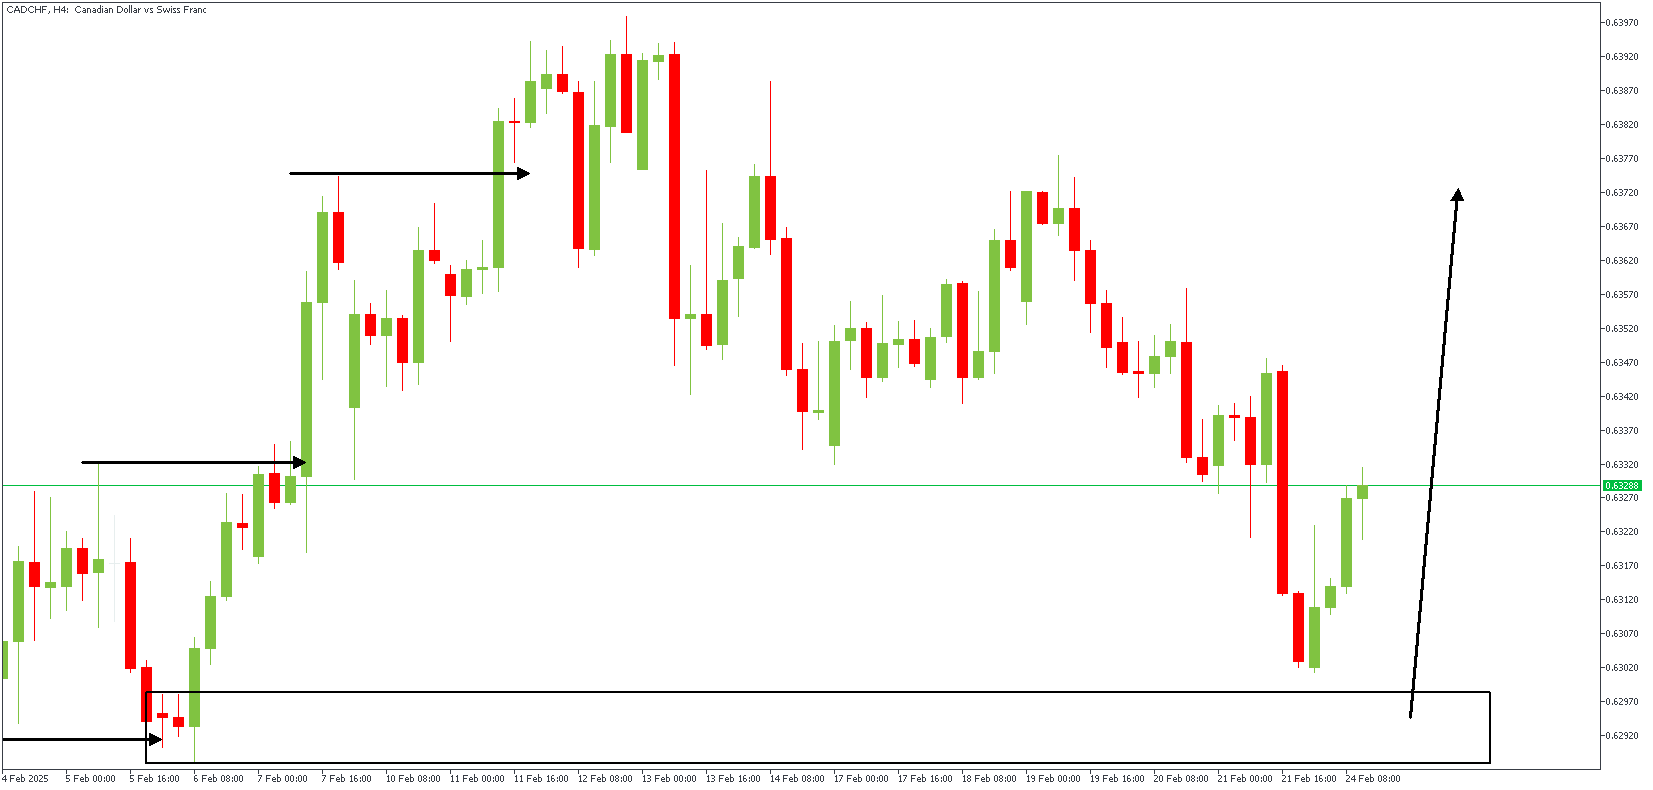
CADCHF – H3 Timeframe
The 3-hour timeframe chart of CADCHF shows a more detailed presentation of the double break of structure pattern, showing the swept low, the initial high, and the induced high. Such price behavior often confirms a change in the character of the market sentiment.
Analyst’s Expectations:
- Direction: Bullish
- Target- 0.63786
- Invalidation- 0.62807

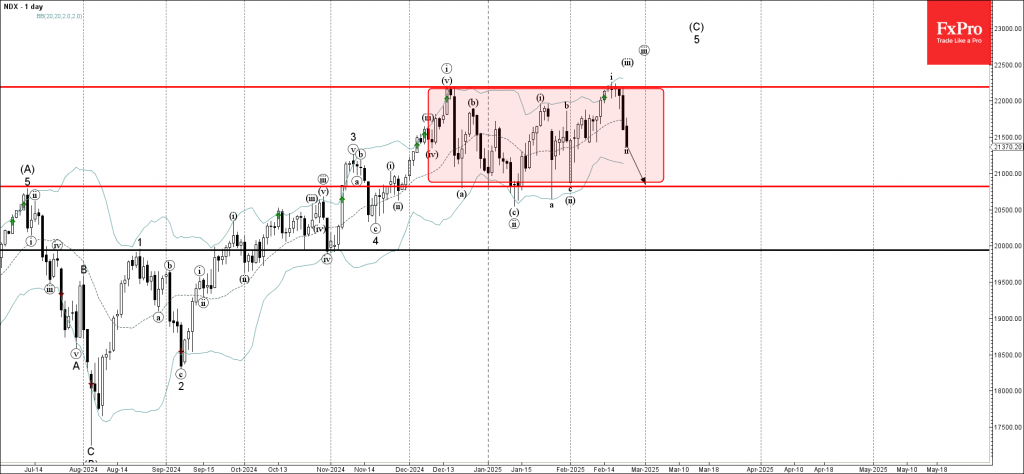
Nasdaq-100 Wave Analysis
- Nasdaq-100 falling inside sideways price range
- Likely to reach support level 20820.00
Nasdaq-100 index recently reversed from the resistance level 22190.00 (the upper border of the sideways price range inside which the index moved from December) intersecting with the upper daily Bollinger Band.
The downward reversal from the resistance level 22190.00 started the active short-term correction ii.
The Nasdaq-100 index can be expected to fall further to the next support level 20820.00 (which has been reversing the price from December).
USDCAD Wave Analysis
- USDCAD reversed from the support area
- Likely to rise to resistance level 1.4380
USDCAD currency pair recently reversed from the support area between the pivotal support level 1.4180 (former monthly high from November), 61.8% Fibonacci retracement of the upward impulse from November and the lower daily Bollinger Band.
The upward reversal from this support area stopped the A-wave of the active ABC correction (2) from the end of January.
Given the clear daily uptrend and the oversold daily Stochastic, USDCAD currency pair can be expected to rise to the next resistance level 1.4380.

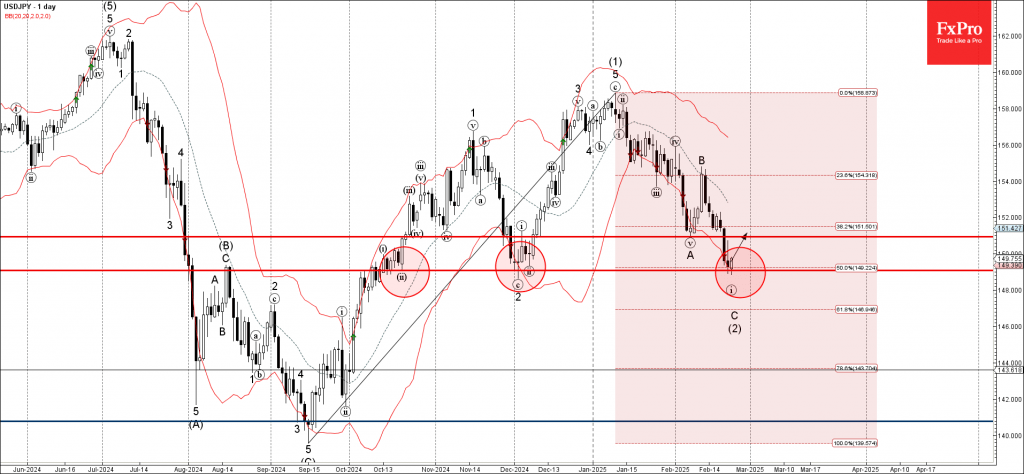
USDJPY Wave Analysis
- USDJPY reversed from the support area
- Likely to rise to the resistance level 150.95
USDJPY currency pair previously reversed up from the support area set between the support level 149.00 (which has been reversing the price from October), 50% Fibonacci retracement of the upward impulse (1) from September and the lower daily Bollinger Band.
The upward reversal from this support area stopped the C-wave of the previous ABC correction (2) from the start of January.
Given the rising bearish yen sentiment seen across the FX markets today, USDJPY currency pair can be expected to rise to the next resistance level 150.95 (the former low of wave A from the start of February).
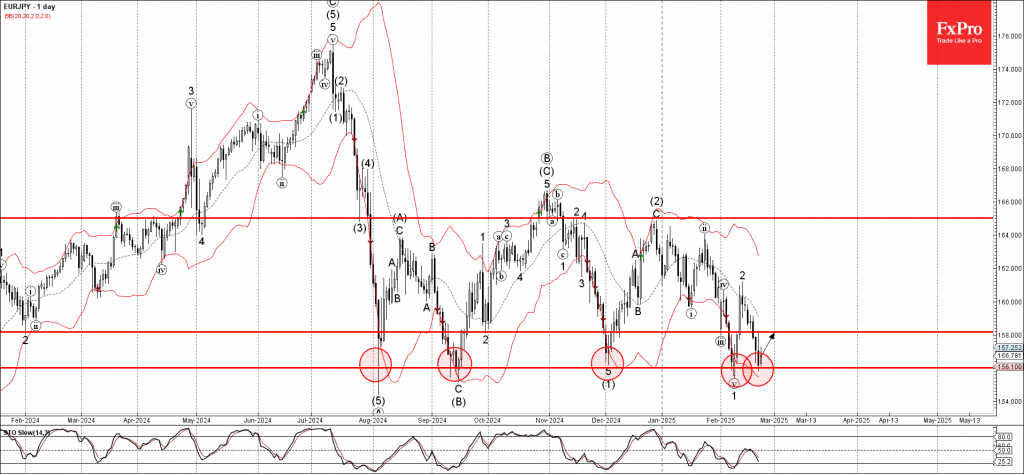
EURJPY Wave Analysis
- EURJPY reversed from the support zone
- Likely to rise to the resistance level 158.00
EURJPY currency pair recently reversed up from the support zone between the multi-month support level 156.00 (which has been reversing the pair from last August) and the lower daily Bollinger Band.
The upward reversal from this support zone is likely to form the daily Japanese candlesticks reversal pattern Piercing Line – if the pair closes today near the current levels.
Given the strength of the support level 156.00 and the bullish euro sentiment seen today, EURJPY currency pair can be expected to rise to the next resistance level 158.00.