
Sample Category Title
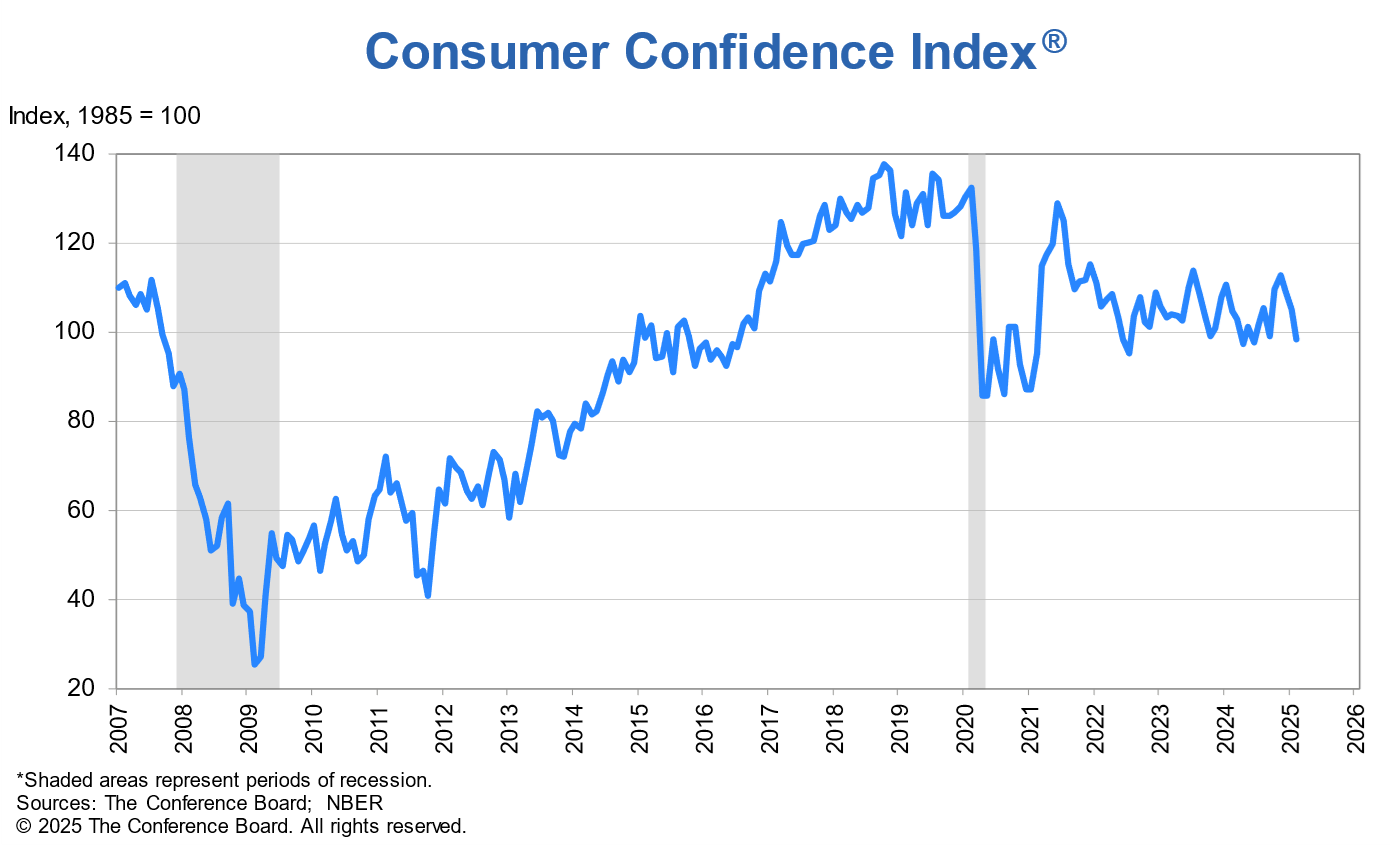
US consumer confidence plunges to 98.3, signals recession risk
US. Conference Board Consumer Confidence tumbled from 104.1 to 98.3 in February, marking the largest monthly decline since August 2021 and falling well short of expectations at 103.3. The deterioration was broad-based, with Present Situation Index dropping -3.4 points to 136.5, while Expectations Index sank -9.3 points to 72.9. This is the first time since June 2024 that the Expectations Index has fallen below the critical threshold of 80, which historically signals elevated recession risk.
Stephanie Guichard, Senior Economist at The Conference Board, highlighted that consumer sentiment has now declined for three consecutive months, pushing the index to the bottom of its two-year range. She pointed out that pessimism about future business conditions, income, and employment prospects has worsened, with job market expectations hitting a ten-month low.
A key concern is the sharp rise in inflation expectations, which surged from 5.2% to 6% in February. Guichard attributed this to a combination of sticky inflation and a spike in household staple prices, as well as the anticipated impact of new trade tariffs. Notably, mentions of trade and tariffs in consumer surveys have surged to levels not seen since 2019.
Monetary Policy Divergence and FX Exchange Rate Impacts: EURCAD & AUDCAD Analysis
Talking Points
- ECB and BOC Monetary Policy Divergence – EURCAD Exchange Rate Fluctuations
- RBA and BOC Monetary Policy Divergence – AUDCAD Exchange Rate Fluctuations
- Canada and Australia Inflation Data and Interest Rate Expectations
- AUDCAD Technical Analysis: Trend Break and Support
Following the inflation peak of 2022 and as central banks globally began raising interest rates, the global disinflation process has progressed at different paces for each economy. This divergence has created arbitrage opportunities for their respective currency exchange rates.
ECB and BOC Monetary Policy Divergence – EURCAD Exchange Rate Fluctuations
For example, in early 2022, the Bank of Canada (BOC) was the first to raise interest rates in March, and the European Central Bank (ECB) followed suit in July.
The monetary policy divergence between the respective central banks caused fluctuations in FX exchange rates, impacting multiple major, minor, and cross FX pairs due to changes in the supply and demand balance.
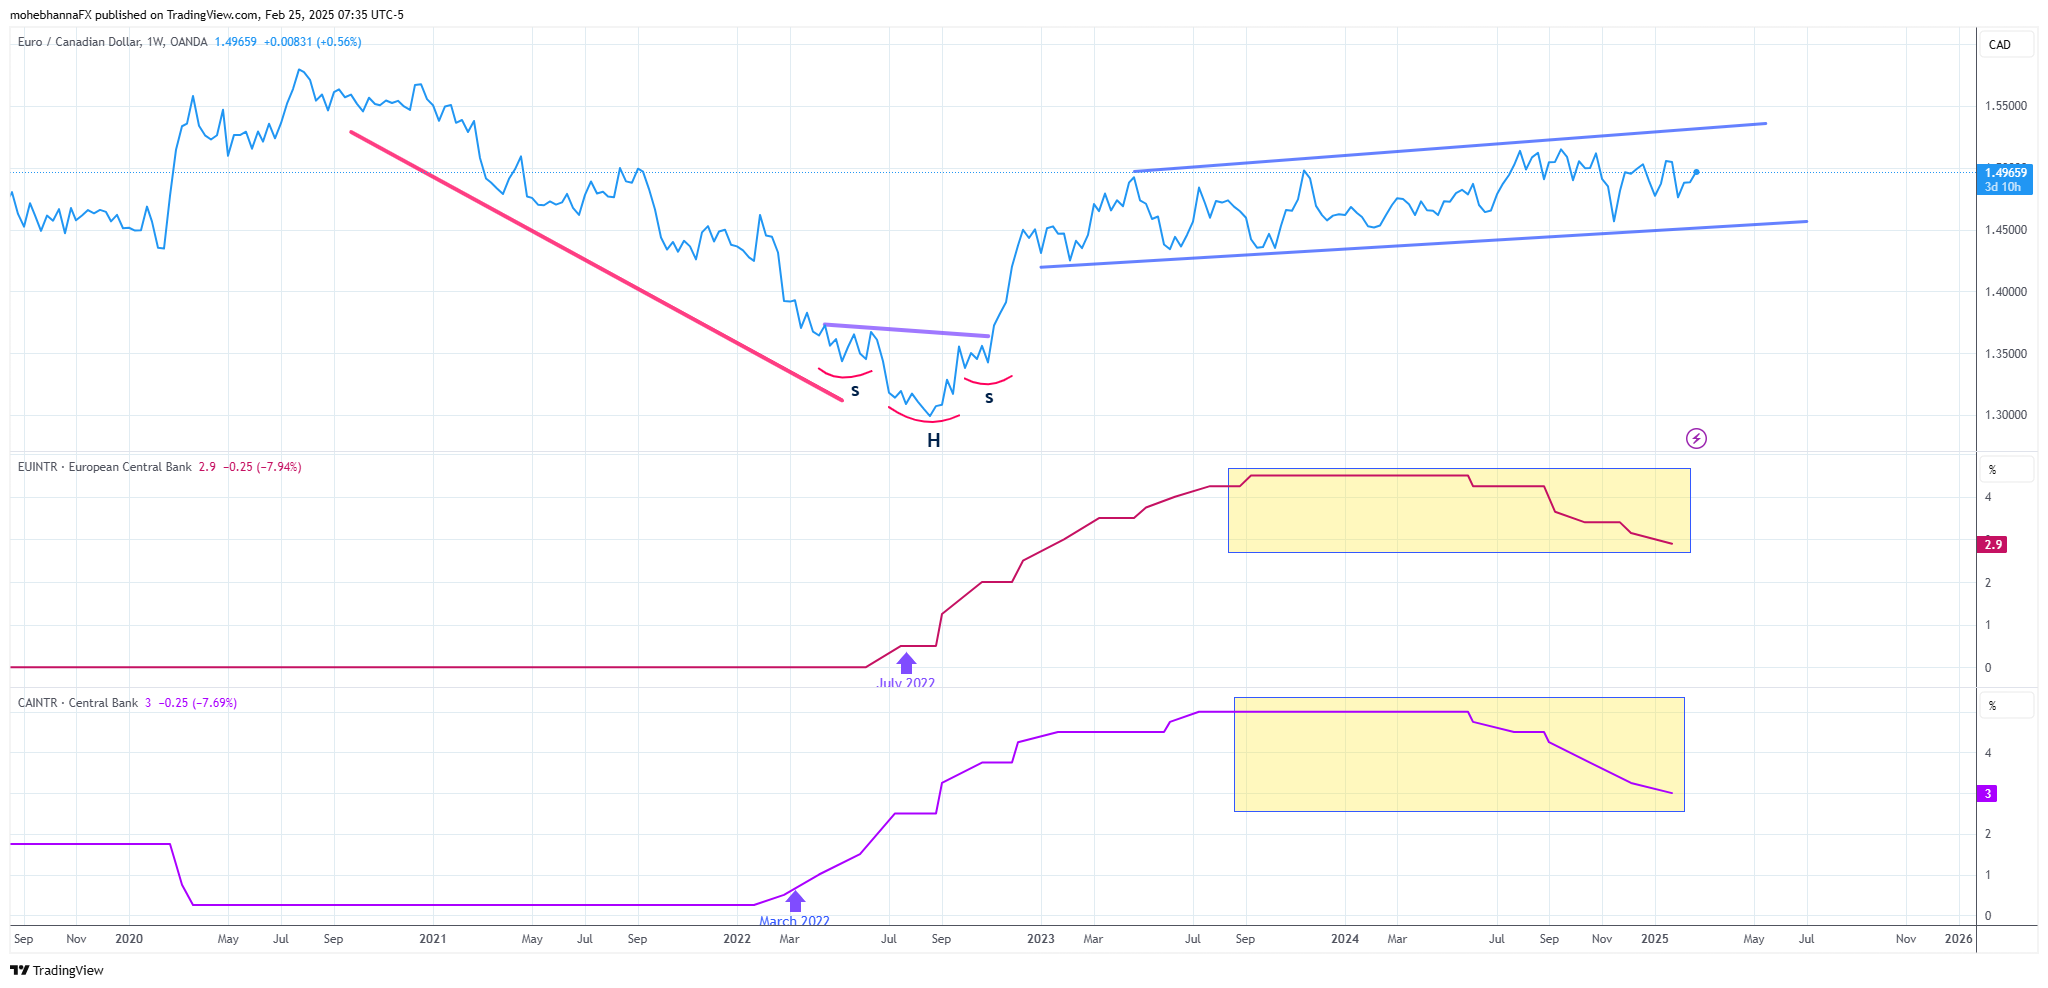
Source: https://www.tradingview.com
The chart shows the EURCAD exchange rate’s reaction to the rate hikes by both banks. The pair was initially trading in a downtrend. However, as the BOC began its rate hikes in March 2022, the trend weakened, followed by a reversal pattern: an inverted complex head and shoulders.
By August 2023, the two central bank monetary policies aligned, and the uptrend began to lose momentum. Price began to trade within a confined range, as marked on the chart. The sideways price action continued as the central banks’ monetary policies converged, as they held and began cutting rates in mid-2024 (highlighted rectangles).
RBA and BOC Monetary Policy Divergence – AUDCAD Exchange Rate Fluctuations
Inflation and interest rates remain a hot topic, especially given that global inflation indicators moved slightly higher in the second half of 2024, and concerns about trade wars persist.
This section will examine the monetary policies of the Bank of Canada and the Reserve Bank of Australia monetary policy divergence. The Canadian and Australian dollars are considered commodity currencies because both are impacted by commodity prices. Therefore, they may have more exposure to tariff risks. However, these risks are not equal, and the pace at which the BOC and RBA manage their monetary policies may differ, thus creating FX exchange rate arbitrage opportunities.
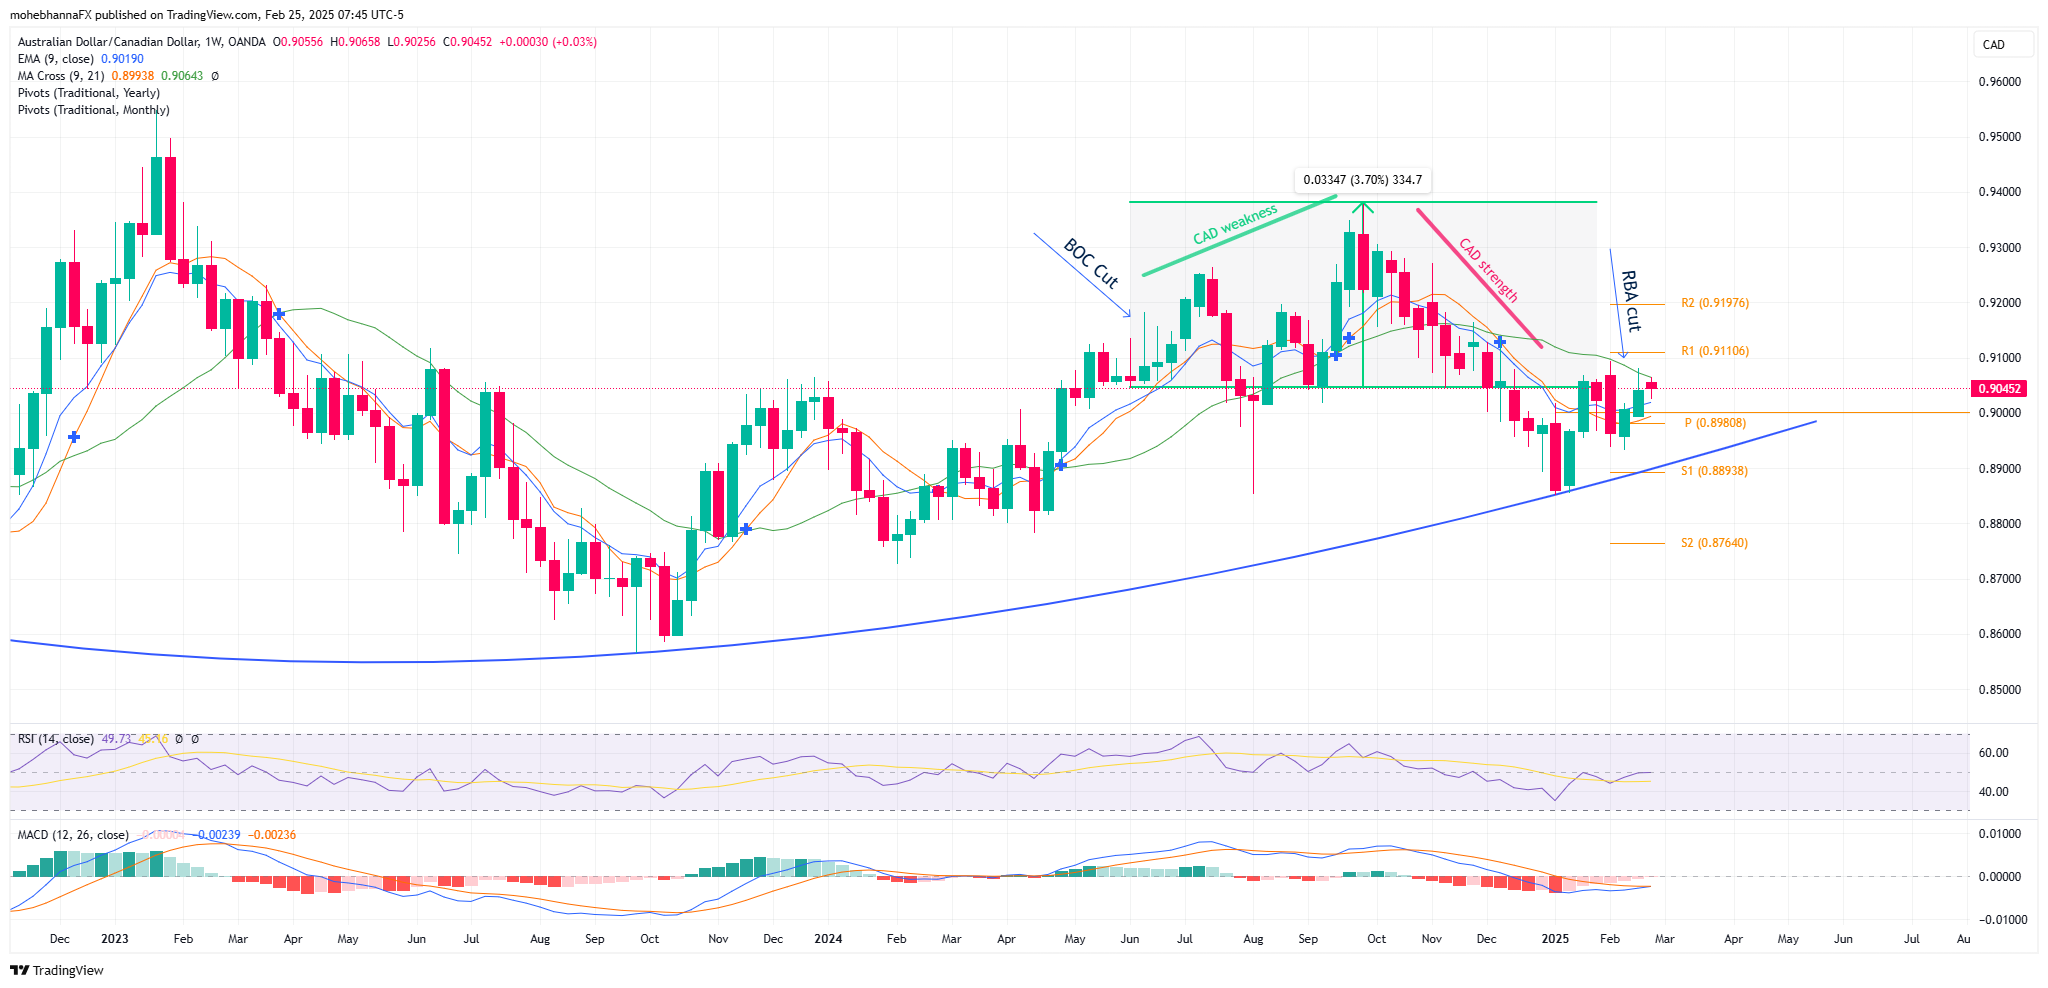
Source: https://www.tradingview.com/
In June 2024, as global central banks began cutting interest rates, the BOC cut its rates by 25 basis points, while the RBA preferred to wait until February 2025 for its first 25 bps cut. The BOC’s earlier move resulted in a stronger Australian dollar against its Canadian counterpart. The AUDCAD exchange rate rose by approximately 3.7% between June and September 2024, as shown on the chart.
By October 2024, ahead of the RBA’s first actual cut, market participants began to anticipate the move, and the trend reversed. The Australian dollar fell against its Canadian counterpart back to the same price level from which it had initially risen in June 2024, when the BOC first cut rates
Canada and Australia Inflation Data and Interest Rate Expectations
Canada’s inflation data, released on February 18, 2025, was higher than forecast, with both Median CPI and Trimmed (Core) CPI at 2.7%. This, along with an upward revision to last month’s Median CPI, has led traders to reduce bets on the BOC’s interest rate cut path. According to Bloomberg’s analyst survey, 42.8% of participants expect a 25 basis point rate cut for the upcoming March 12th BOC interest rate decision, down from 100% earlier that month.
Markets are looking forward today to inflation data from Australia, according to the Bloomberg analyst surveys, the CPI Y/Y is forecasted at 2.6%, compared to 2.5% for last month. The analysts’ survey shows that 16.8% of participants expect the RBA to cut rates by 25 basis points at their upcoming April 1st 2025 meeting.
AUDCAD Technical Analysis: Trend Break and Support
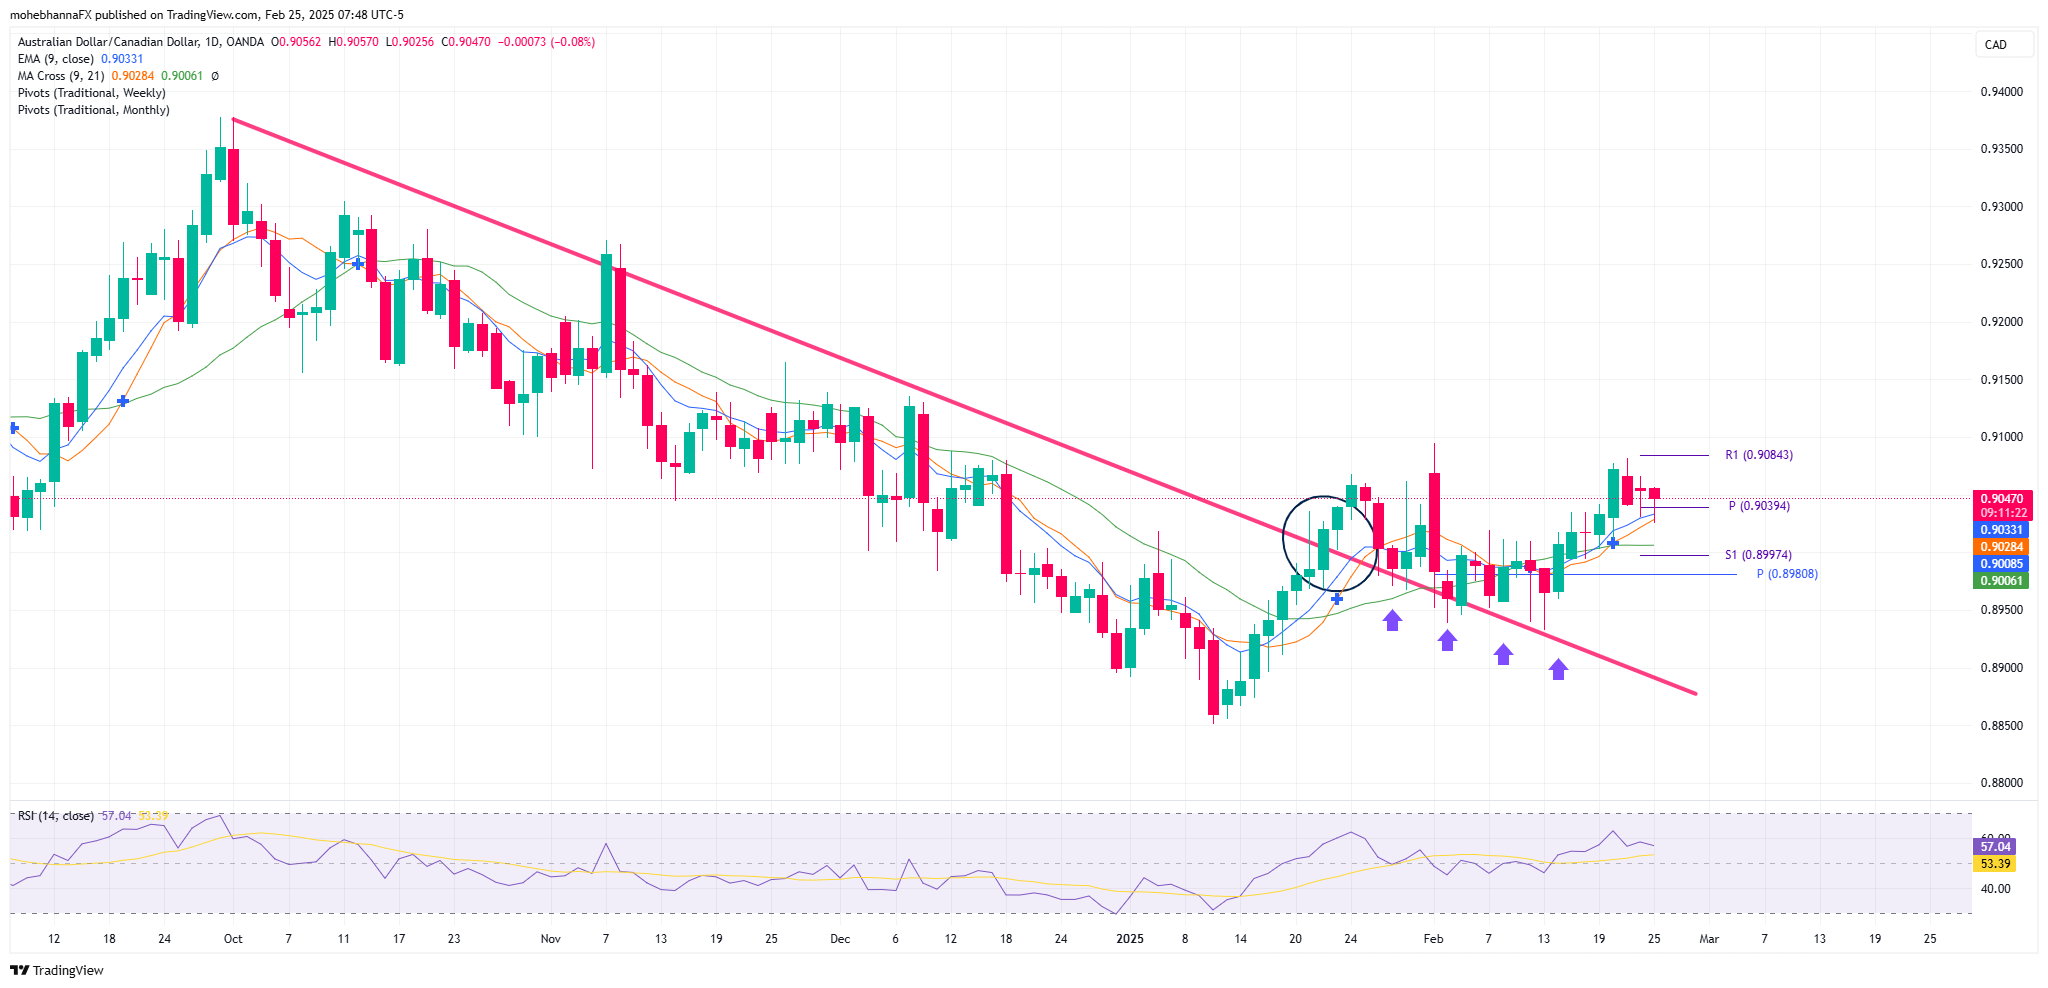
Source: https://www.tradingview.com/
- Price action was trading in a downward trend which was broken in January 2025, marked by a circle on the chart, multiple throwbacks followed through which were able to find support above the trendline extension, marked by purple arrows.
- A confluence of support lies below price action represented by the intersection of EMA9, SMA9, SMA20 and the weekly PP of 0.9039.
- RSI is in line with the price action and near its neutral level.
In conclusion, the divergence in monetary policies between central banks, exemplified by the BOC, RBA, and ECB, has created significant fluctuations in currency exchange rates. As inflation rates change and central banks adjust their interest rate stances, arbitrage opportunities arise for traders. Analyzing these divergences, coupled with technical analysis of price action and support levels, provides valuable insights into potential future movements in the FX market. The shifting expectations surrounding interest rate hikes/cuts, driven by evolving inflation data, will likely continue to influence currency valuations, making it crucial for market participants to stay informed and adapt their strategies accordingly.
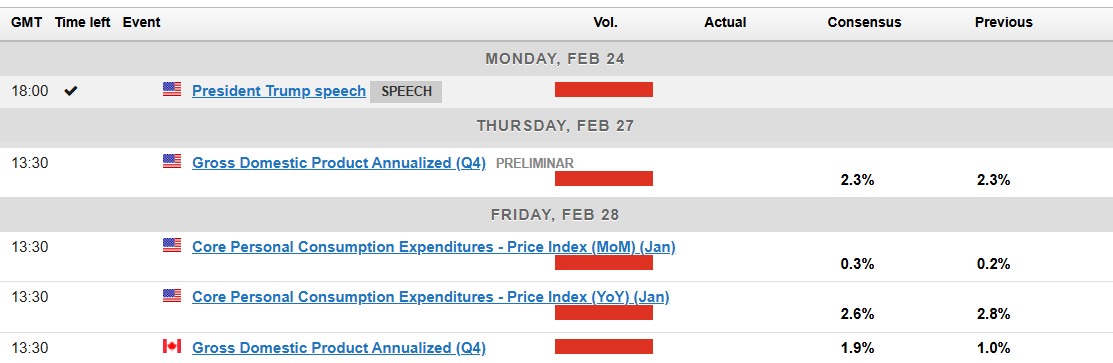
USD/CAD Eyes Breakout as Tariff Deadline Approaches
- The US Dollar’s recovery on tariff talk is causing the USD/CAD pair to bounce.
- The main events to watch out for this week are the US PCE data and Canadian GDP for Q4.
- A close above 1.43100 on the daily candle chart would signal a structural shift that could empower bulls.
USD/CAD has enjoyed a bounce to start the week as the US Dollar eyes a recovery. The pair has been caught in a tight range since February 14, but does appear to be consolidating ahead of a potential breakout.
President Trump’s Tariff Pledge
US President Donald Trump announced yesterday that tariffs for Canada and Mexico would go ahead on March 3. This message lent support to the US Dollar and allowed USD/CAD to record another bullish day.
Given that approximately 75% of Canadian exports head to the US, tariffs and a potential tit-for-tat trade war may prove detrimental to the Canadian economy.
Bank of Canada Awaits Tariff Confirmation
Bank of Canada Governor Macklem recently acknowledged that tariffs have added to
uncertainty.
Depending on how the tariff scenarios develop it could impact the decision by the Bank of
Canada (BoC) at its March 12, 2025, as pressure from consumers continue to mount.
Tariff developments may also prove to be a key driver for the pair this week as the deadline
approaches. Keep an eye out for any comments or more details from both US and Canadian
officials.
The Week Ahead – US & Canada
The economic calendar is full this week with a lot of US data and Federal Reserve policymakers speak. Today we have housing starts data before we focus on comments from Federal Reserve policymakers Barr and Logan.
The main data events affecting USDCAD will be released on Friday with Canadian GDP for Q4 before attention shifts to the much anticipated PCE data release from the US.
Technical Analysis and Outlook
USDCAD had been stuck in a range for nearly a month now as price continued its grand higher yesterday.
Overall, on a daily timeframe the trend remains bearish which is supported by the 14-period SMA which remains below the 50 level, a sign that bearish momentum remains in play. A daily candle close above the 1.43100 will lead to a shift in structure and could embolden bulls.
USD/CAD Daily Chart, February 25, 2025
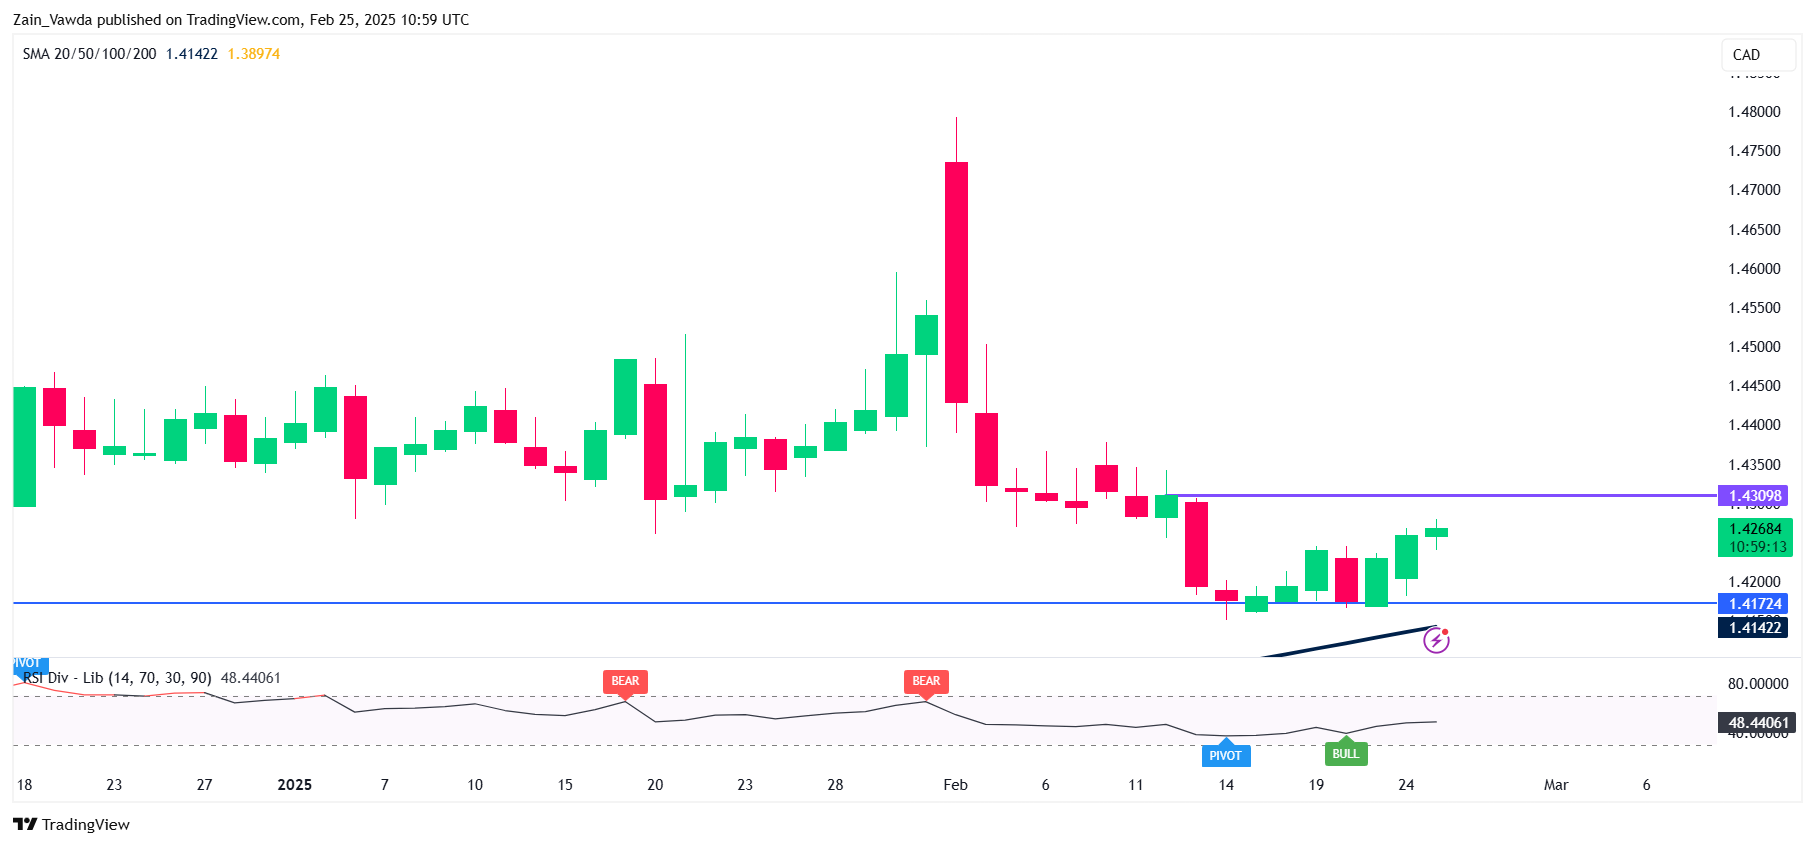
Source: TradingView (click to enlarge)
Dropping down to a H4 chart, and as you can see price bottomed out on February 14, printing a series of higher highs and higher lows.
However my concern is with the two moving averages resting at 1.4285 and 1.4340 which could cap any move to the upside.
USD/CAD Four-Hour Chart, February 25, 2025
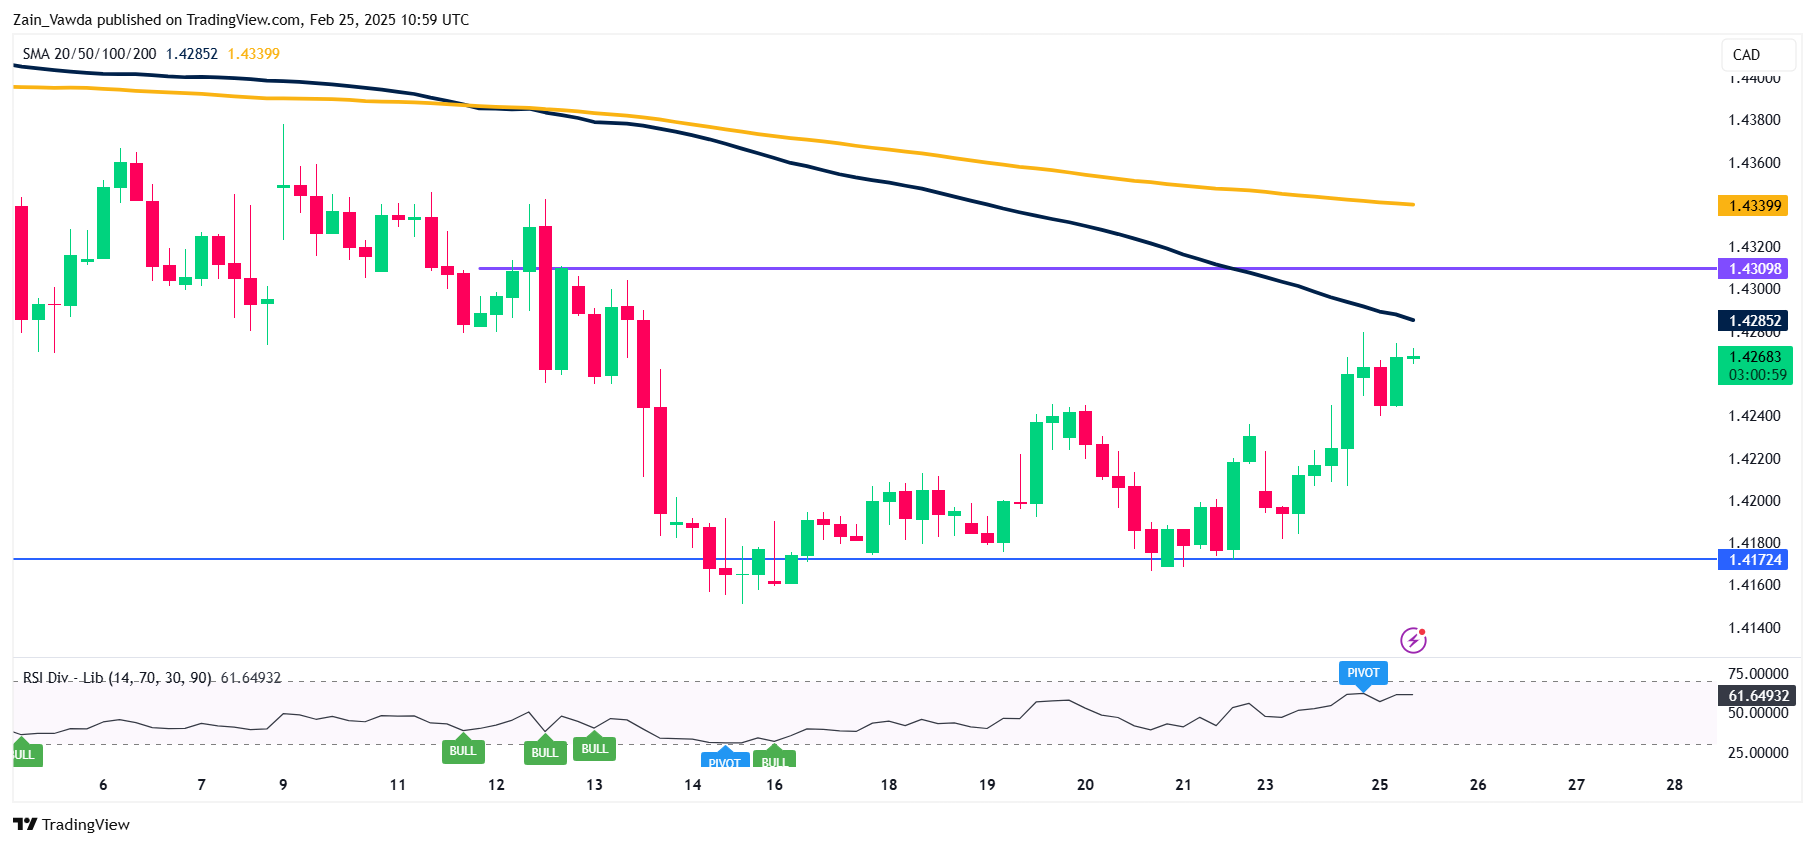
Source: TradingView (click to enlarge)
Support
- 1.4172
- 1.4000
- 1.3956
Resistance
- 1.4310
- 1.4500
- 1.4594
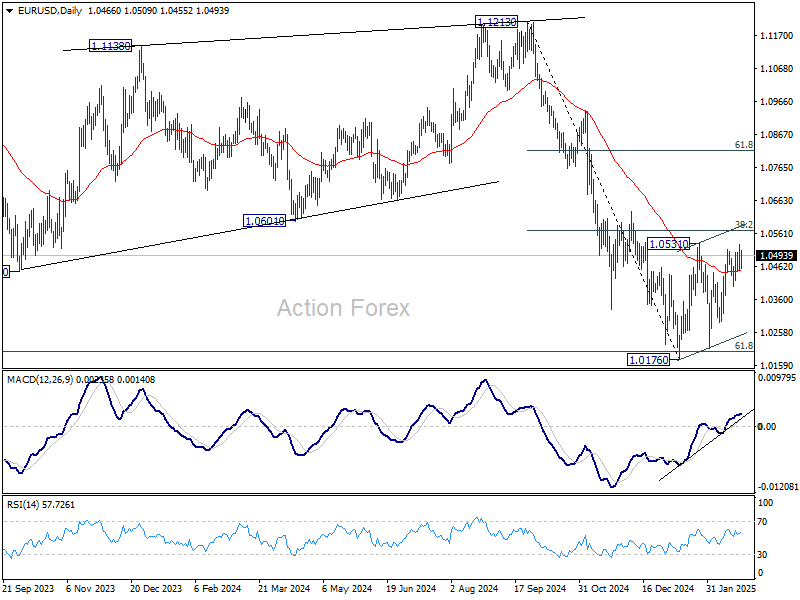
EUR/USD Mid-Day Outlook
Daily Pivots: (S1) 1.0438; (P) 1.0483; (R1) 1.0513; More...
Intraday bias in EUR/USD stays neutral for the moment. Price actions from 1.0176 are seen as a corrective pattern only. Strong resistance is expected from 38.2% retracement of 1.1213 to 1.0176 at 1.0572 to limit upside. On the downside, break of 1.0400 support will turn bias back to the downside for 1.0176/0210 support zone. However, decisive break of 1.0572 will raise the chance of reversal, and target 61.8% retracement at 1.0817.
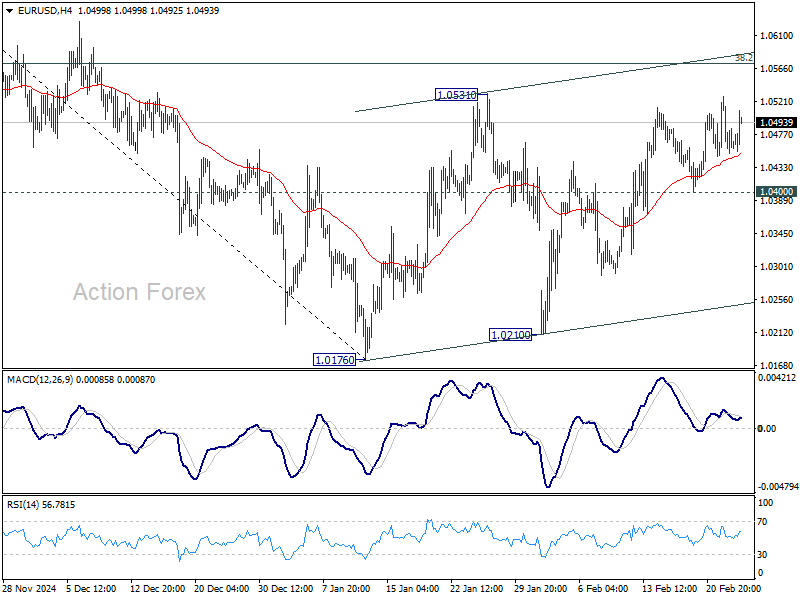
In the bigger picture, immediate focus is on 61.8 retracement of 0.9534 (2022 low) to 1.1274 (2024 high) at 1.0199. Sustained break there will solidify the case of medium term bearish trend reversal, and pave the way back to 0.9534. However, reversal from 1.0199 will argue that price actions from 1.1274 are merely a corrective pattern, and has already completed.
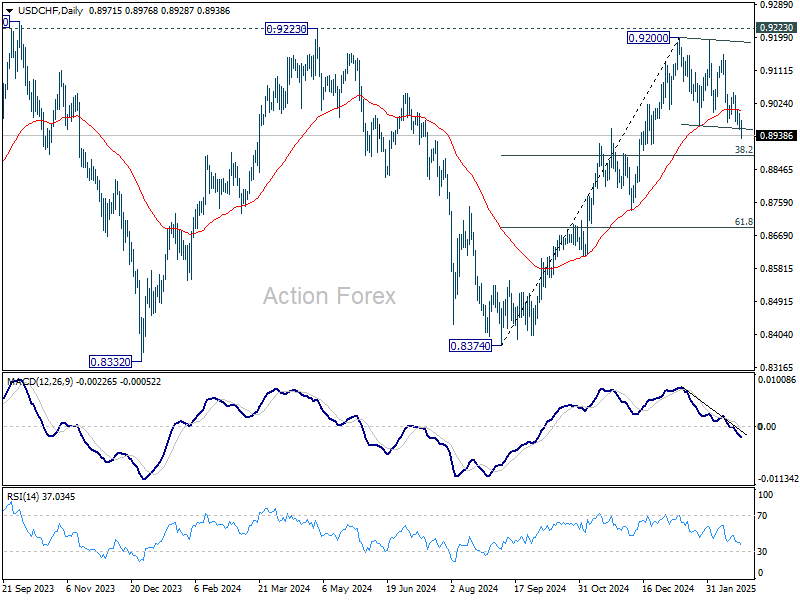
USD/CHF Mid-Day Outlook
Daily Pivots: (S1) 0.8951; (P) 0.8974; (R1) 0.8995; More…
USD/CHF's price actions from 0.9200 are seen as a corrective pattern only. While deeper pull back might be seen, larger rally is still expected to continue as long as 38.2% retracement of 0.8374 to 0.9200 at 0.8884 holds. On the upside, above 0.9053 will bring retest of 0.9200 resistance. However, sustained break of 0.8884 will indicate bearish reversal, and target 61.8% retracement at 0.8690 instead.
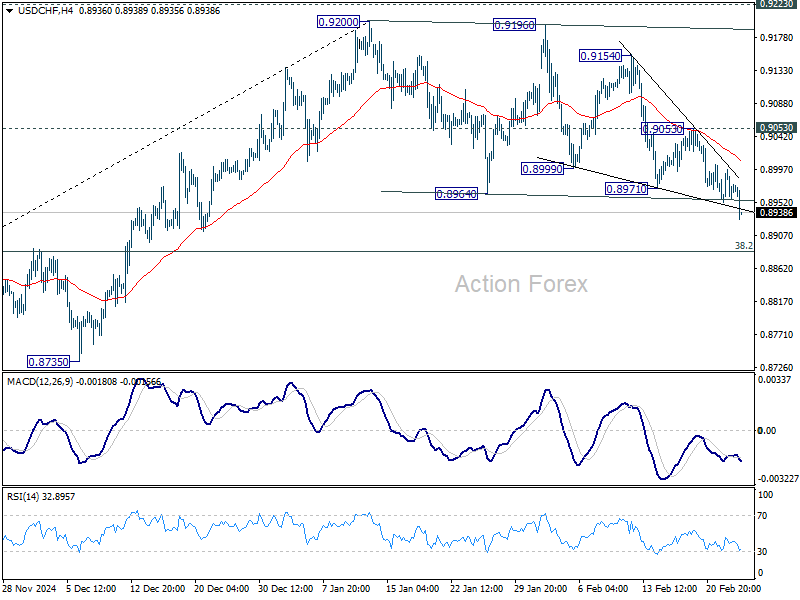
In the bigger picture, decisive break of 0.9223 resistance will argue that whole down trend from 1.0342 (2017 high) has completed with three waves down to 0.8332 (2023 low). Outlook will be turned bullish for 1.0146 resistance next. Nevertheless, rejection by 0.9223 will retain medium term bearishness for another decline through 0.8332 at a later stage.
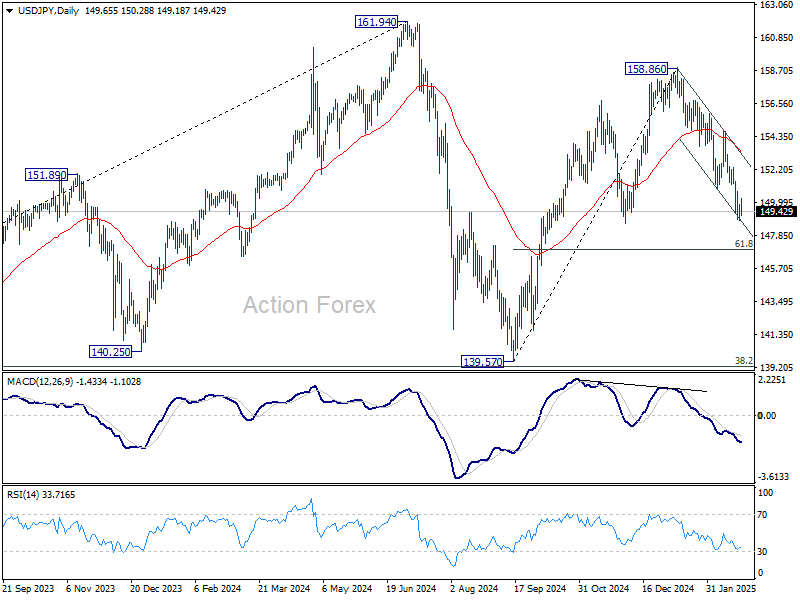
USD/JPY Mid-Day Outlook
Daily Pivots: (S1) 149.09; (P) 149.48; (R1) 150.12; More...
Intraday bias in USD/JPY stays neutral for consolidations above 148.83 temporary low. Further decline is expected as long as 154.79 resistance holds. Fall from 158.86 is seen as the third leg of the pattern from 161.94 high. Below 148.83 will target 61.8% retracement of 139.57 to 158.86 at 146.32 next.
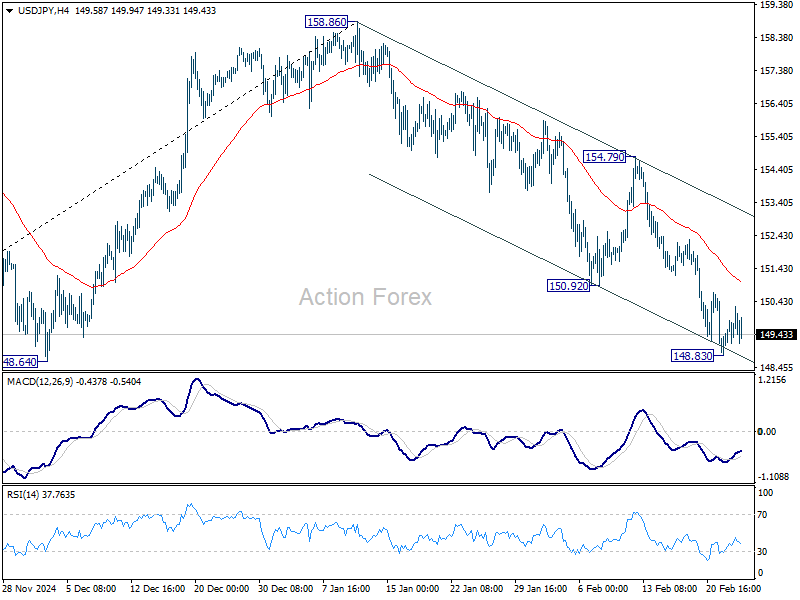
In the bigger picture, price actions from 161.94 are seen as a corrective pattern to rise from 102.58 (2021 low). In case of another fall, strong support should be seen from 38.2% retracement of 102.58 to 161.94 at 139.26 to bring rebound. However, sustained break of 139.26 would open up deeper medium term decline to 61.8% retracement at 125.25.
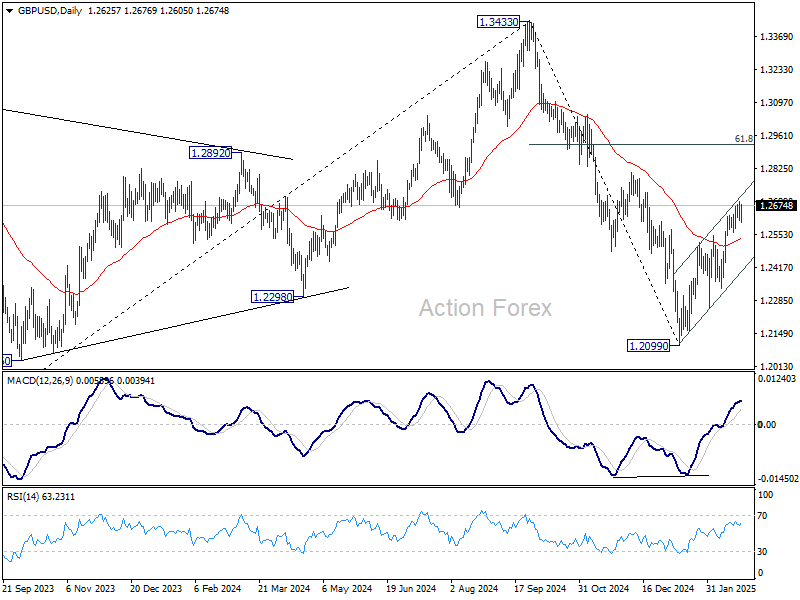
GBP/USD Mid-Day Outlook
Daily Pivots: (S1) 1.2594; (P) 1.2643; (R1) 1.2673; More...
Intraday bias in GBP/USD stays neutral at this point. Further rise will remain in favor as long as 1.2522 resistance turned support holds. Above 1.2689 will resume the rally from 1.2099 to 1.2810 resistance next. However, firm break below 1.2522 will argue that the rebound might have completed, and bring deeper fall to 1.2331 support.
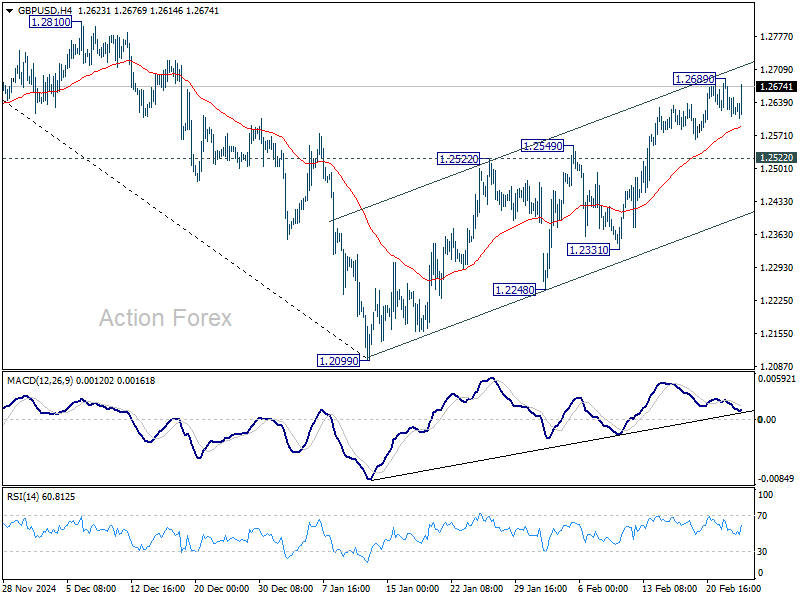
In the bigger picture, rise from 1.0351 (2022 low) should have already completed at 1.3433 (2024 high), and the trend has reversed. Further fall is now expected as long as 1.2810 resistance holds. Deeper decline should be seen to 61.8% retracement of 1.0351 to 1.3433 at 1.1528, even as a corrective move. However, firm break of 1.2810 will dampen this bearish view and bring retest of 1.3433 high instead.
Greenback Drops Ahead of Consumer Data, Risk Sentiment in Focus
Dollar weakened notably against European majors and Yen as markets transitioned into US session, despite subdued overall trading activity. The decline was largely driven by extended fall in US 10-year Treasury yield, which hit its lowest level since mid-December.
Beyond geopolitical and trade war concerns, market focus has turned toward whether slowing US consumption and softer economic data could force Fed to resume rate cuts sooner than expected, even as inflation remains elevated. Fed funds futures now price in a near 65% chance of a 25bps rate cut in June, a notable increase from 45% just a week ago.
The next catalyst for Dollar’s direction will be consumer confidence report, set for release shortly. However, Dollar’s next moves may not be straightforward, as risk aversion—if it intensifies—could provide some support due to safe-haven demand. US stocks, particularly the tech-heavy NASDAQ, could be vulnerable on the upcoming Nvidia earnings report later in the week.
For now, commodity currencies are under the most pressure, with Kiwi leading the declines. On the other hand, Swiss Franc is the strongest performer, followed closely by Sterling and Euro. Dollar and Yen are positioned in the middle.
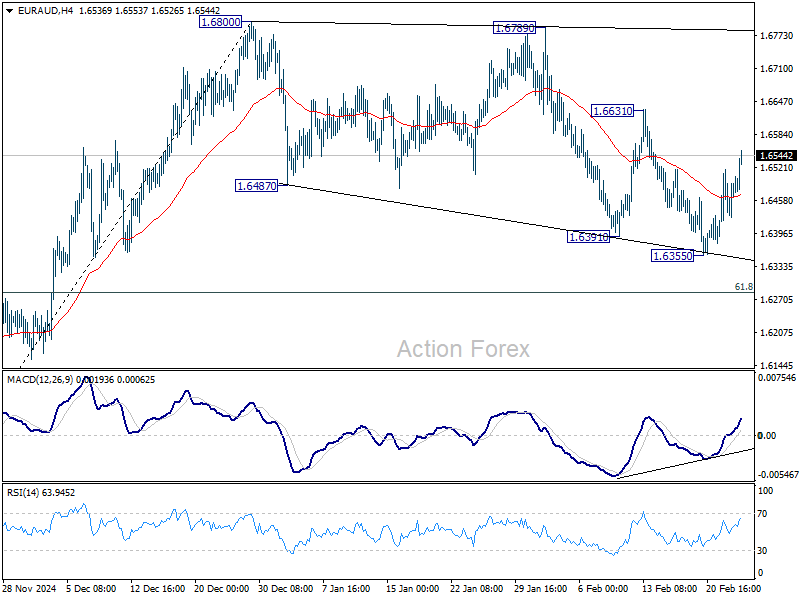
Looking ahead to the Asian session, Australia’s monthly CPI reading will draw attention. Consensus suggests inflation might edge up from 2.5% to 2.6% in January, supporting RBA’s cautious stance even after it initiated its easing cycle earlier this month. Still, a downside surprise would provide RBA with added confidence to proceed with additional rate cuts if economic conditions worsen.
Technically, EUR/AUD's rebound is gaining some momentum today. Firm break of 1.6631 resistance will argue that the corrective pattern from 1.6800 has completed, and larger rise from 01.5963 is finally ready to resume through 1.6800.
In Europe, at the time of writing, FTSE is up 0.47%. DAX is up 0.43%. CAC is up 0.04%. UK 10-year yield is down -0.0475 at 4.525. Germany 10-year yield is down -0.0012 at 2.479. Earlier in Asia, Nikkei fell -1.39%. Hong Kong HSI fell -1.32%. China Shanghai SSE fell -0.80%. Singapore Strait Times fell -0.30%. Japan 10-year JGB yield fell -0.0511 to 1.376.
ECB’s Nagel expects more rate cuts Amid encouraging price trends
German ECB Governing Council member Joachim Nagel indicated that incoming data suggests the central bank is on track to achieve its inflation target this year, opening the door for further rate cuts.
Speaking today, Nagel stated, "This would allow us on the Governing Council to lower the key interest rates further," reinforcing expectations that ECB will continue its gradual easing cycle.
However, Nagel also cautioned against premature optimism, highlighting "persistently elevated core inflation and the undiminished strength of services inflation."
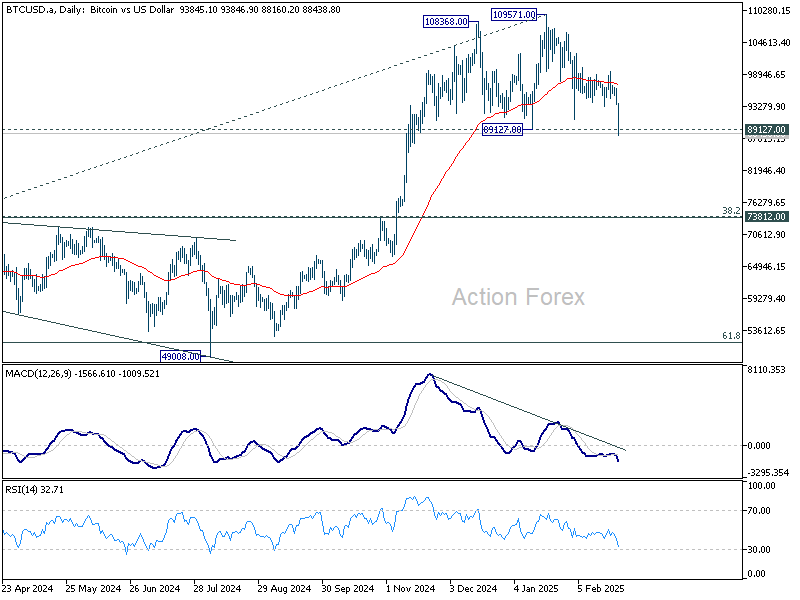
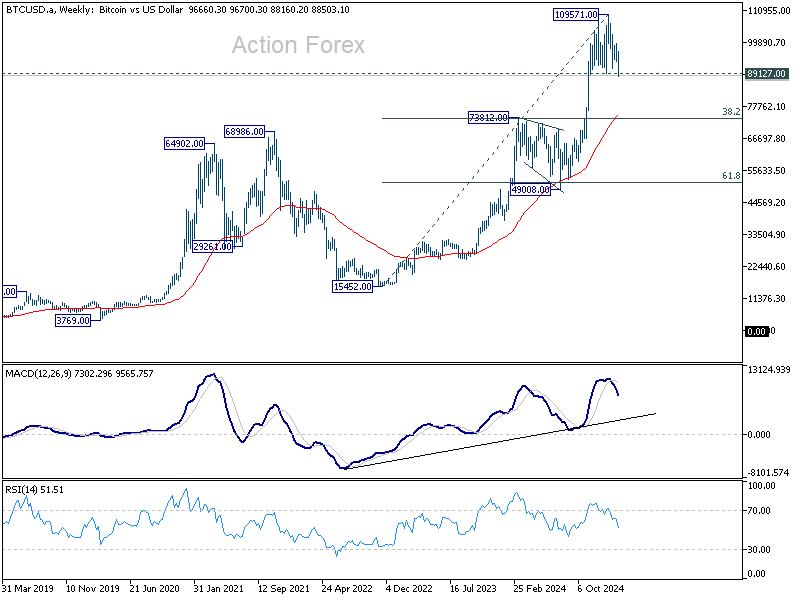
Bitcoin breaches 90K, double top breakdown could trigger deep correction
Bitcoin’s selloff intensified today, plunging below the 90k mark and hitting its lowest level since November. The immediate catalyst appears to be last week’s massive hack of USD 1.5B worth of Ether from cryptoexchange Bybit—an incident researchers have labeled the biggest crypto heist on record.
Although Bybit has announced that it fully restored the stolen Ether, market sentiment remains firmly negative, as traders grow wary of systemic risks and question the exchange’s ability to prevent future breaches.
Technically, Bitcoin now hovers at a critical juncture. The key 89,127 support level is under heavy pressure, and decisive break there would complete a double top pattern (108368, 108571). Such a development would strongly indicate that a larger-scale correction is underway.
In the bearish scenario, Bitcoin could be entering a correction of the entire rally from 15,452 (2022 low). The correction could target 73,812 cluster support (38.2% retracement of 15,452 to 109,571 at 73,617) before completion.
GBP/USD Mid-Day Outlook
Daily Pivots: (S1) 1.2594; (P) 1.2643; (R1) 1.2673; More...
Intraday bias in GBP/USD stays neutral at this point. Further rise will remain in favor as long as 1.2522 resistance turned support holds. Above 1.2689 will resume the rally from 1.2099 to 1.2810 resistance next. However, firm break below 1.2522 will argue that the rebound might have completed, and bring deeper fall to 1.2331 support.
In the bigger picture, rise from 1.0351 (2022 low) should have already completed at 1.3433 (2024 high), and the trend has reversed. Further fall is now expected as long as 1.2810 resistance holds. Deeper decline should be seen to 61.8% retracement of 1.0351 to 1.3433 at 1.1528, even as a corrective move. However, firm break of 1.2810 will dampen this bearish view and bring retest of 1.3433 high instead.
ECB’s Nagel expects more rate cuts Amid encouraging price trends
German ECB Governing Council member Joachim Nagel indicated that incoming data suggests the central bank is on track to achieve its inflation target this year, opening the door for further rate cuts.
Speaking today, Nagel stated, "This would allow us on the Governing Council to lower the key interest rates further," reinforcing expectations that ECB will continue its gradual easing cycle.
However, Nagel also cautioned against premature optimism, highlighting "persistently elevated core inflation and the undiminished strength of services inflation."
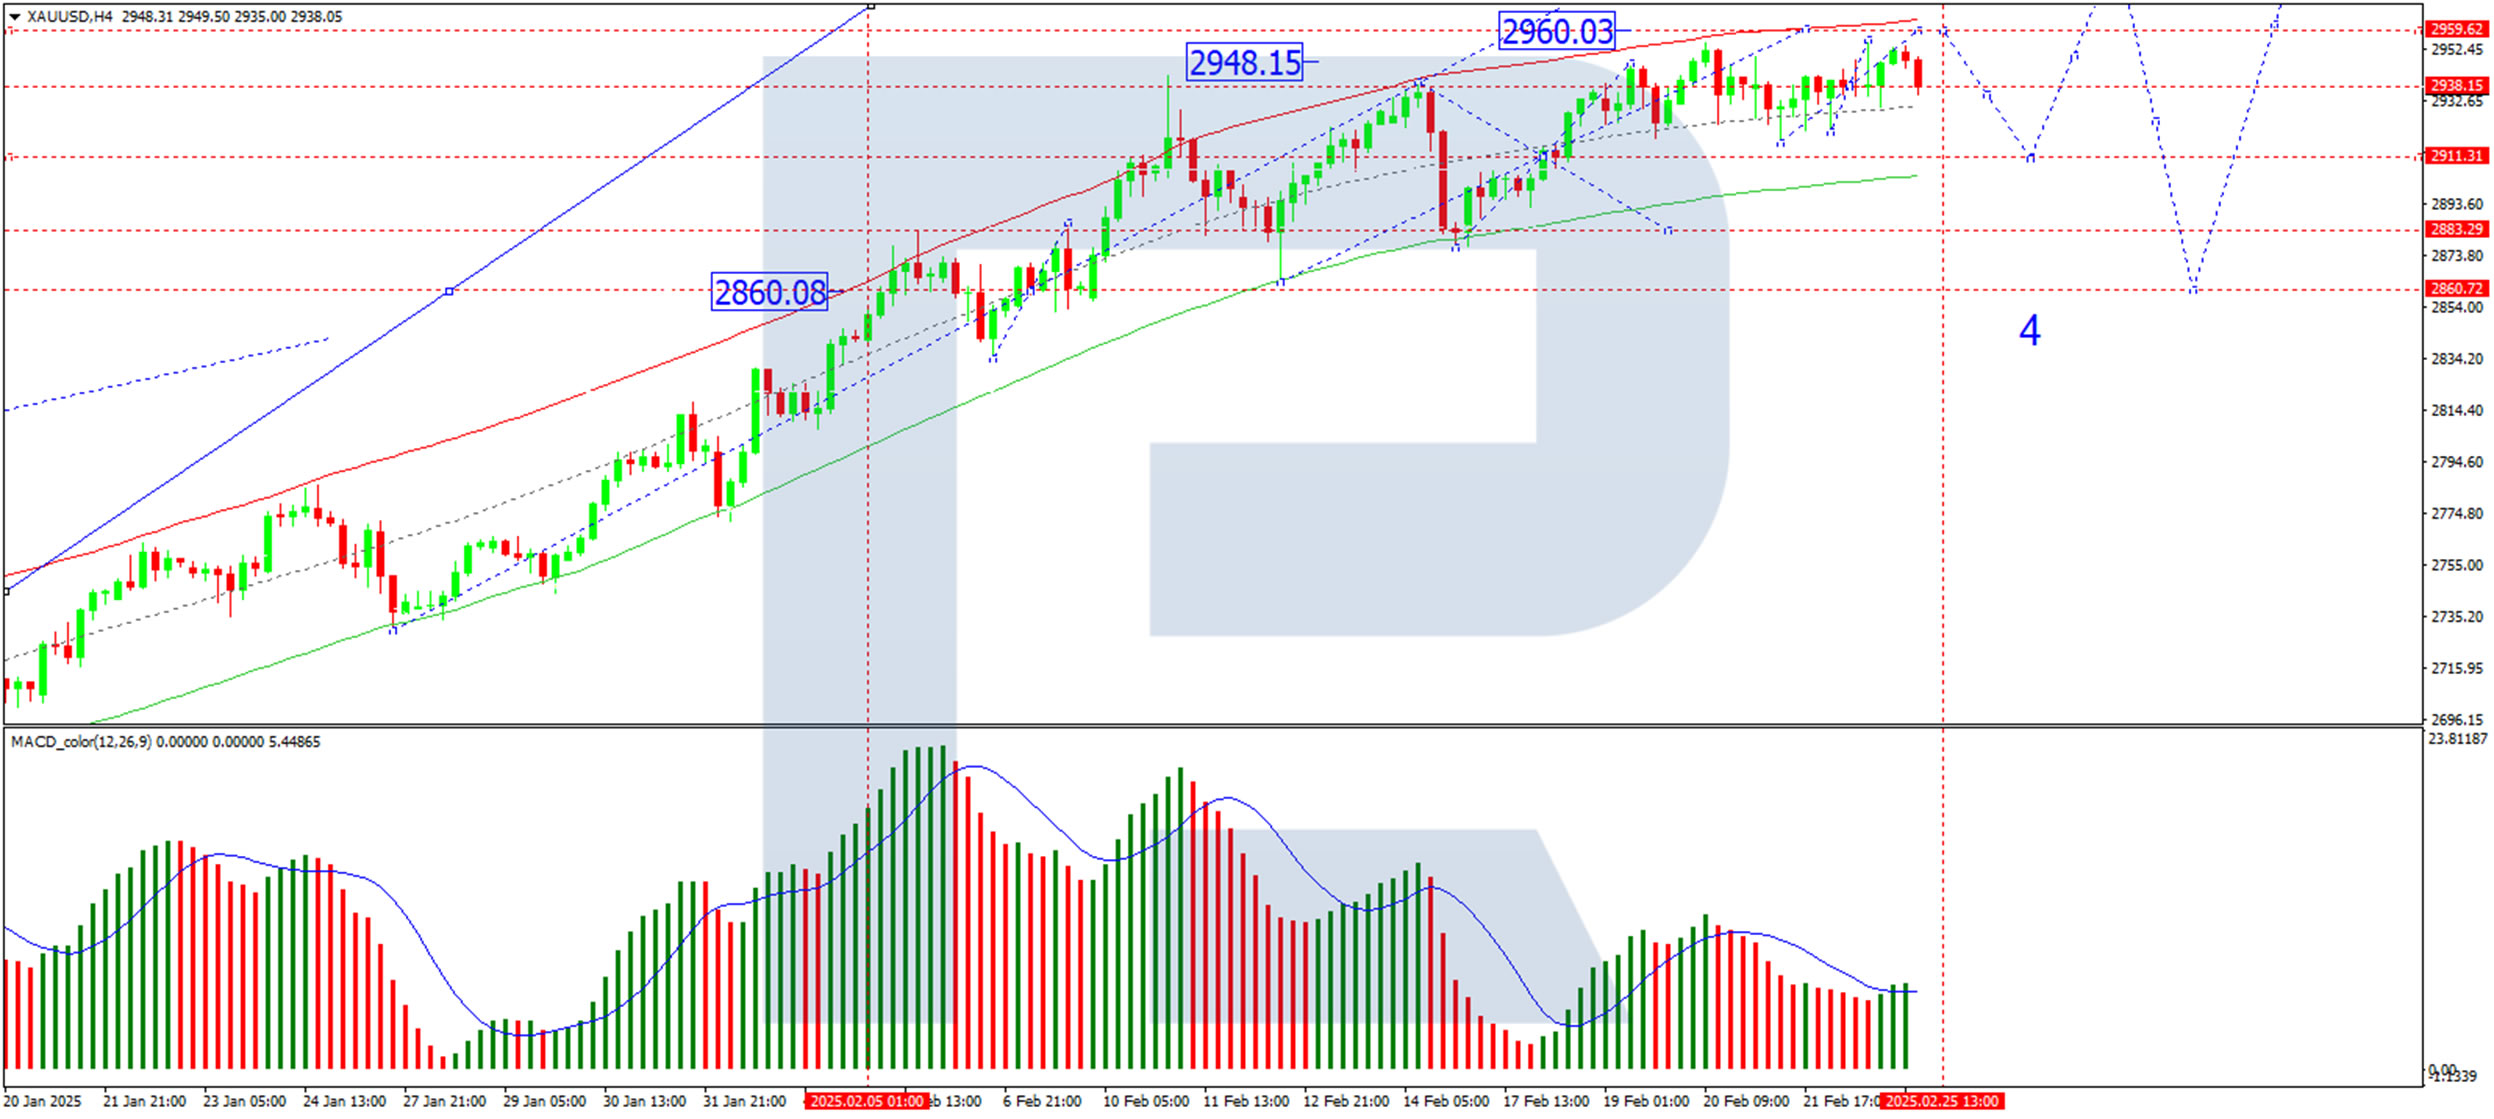
Gold Prices Rise Again as Demand for Safe-Haven Assets Increases
Gold stabilised around 2,940 USD per troy ounce on Tuesday, remaining close to record highs. The metal continues to benefit from strong demand for safe-haven assets amid growing concerns over US President Donald Trump’s tariff policies.
Key factors driving Gold prices
On Monday, Trump confirmed that tariffs on Canadian and Mexican imports will proceed as planned. This triggered fresh market concerns over inflation risks, which could influence the Federal Reserve’s future monetary policy.
In addition to geopolitical tensions, Gold is receiving support from the SPDR Gold Trust, the world’s largest gold-backed exchange-traded fund. The fund reported increased assets to 904.38, marking the highest level since August 2023.
Investors focus now shifts to Friday’s Personal Consumption Expenditures (PCE) report, the Fed’s preferred inflation gauge. The data is expected to show the slowest price growth since June 2024. However, persistent inflationary pressures may keep the Fed cautious about cutting interest rates too soon.
Technical analysis of XAU/USD
On the H4 chart, XAU/USD is consolidating around 2,938. A potential downward move towards 2,911 (a test from above) is likely before a renewed growth wave targets 2,960 as a local high. Once this level is reached, a corrective decline towards 2,860 could begin. The MACD indicator confirms this outlook, with its signal line above the zero level and pointing decisively upwards.
On the H1 chart, Gold recently formed a growth wave to 2,956 before correcting back to 2,938. A consolidation range is expected to develop around this level. If the price breaks downwards, a move towards 2,920 could occur before another upward impulse targets 2,960. The Stochastic oscillator supports this scenario, with its signal line below 20, indicating an imminent rise towards 80.
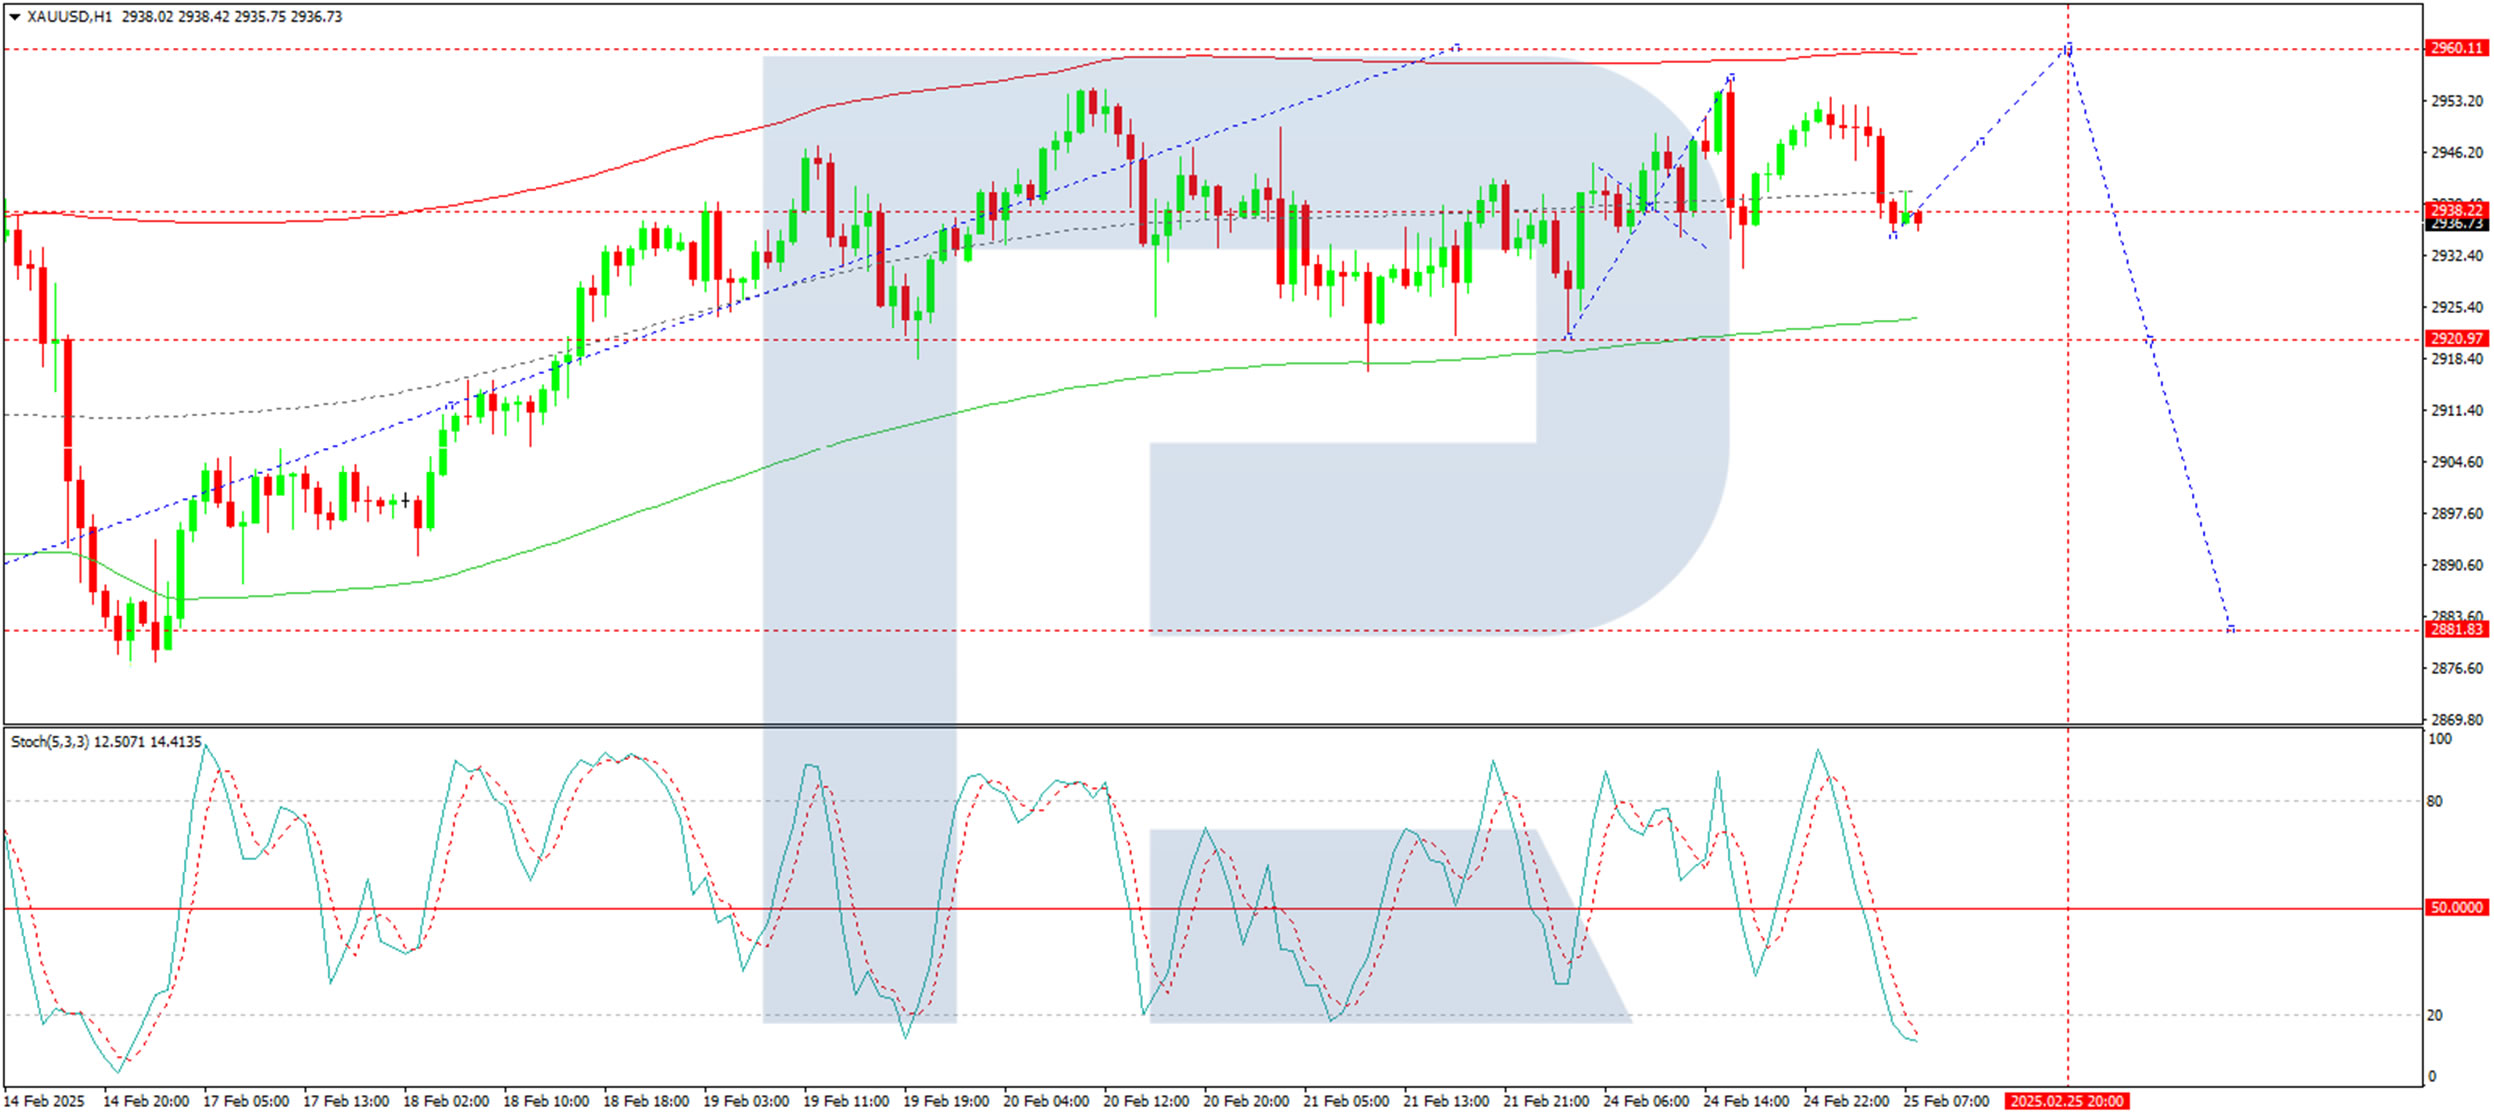
Conclusion
Gold remains in a strong uptrend, supported by safe-haven demand, geopolitical uncertainties, and increased holdings in gold-backed ETFs. Technical indicators suggest a potential short-term dip before another move higher towards 2,960. However, investors should watch upcoming inflation data, which could influence the Fed’s rate outlook and Gold’s trajectory.