Sample Category Title
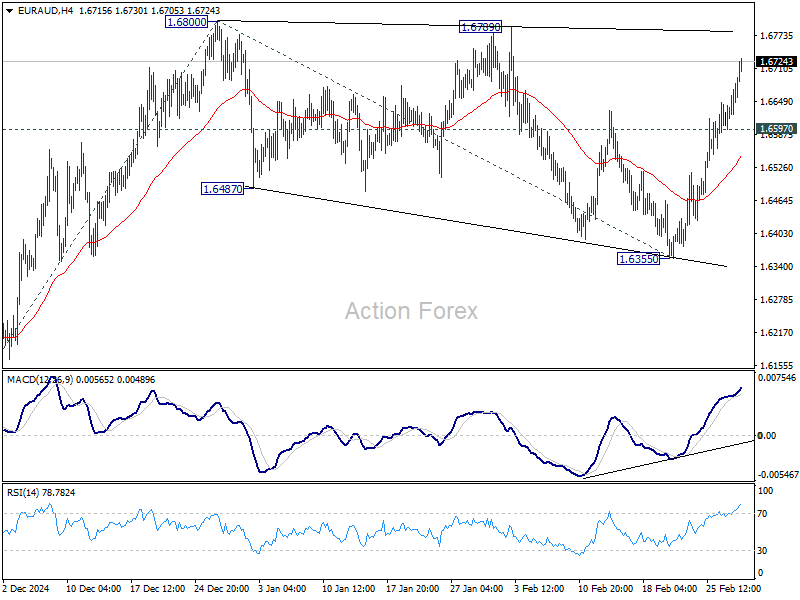
EUR/AUD Daily Outlook
Daily Pivots: (S1) 1.6621; (P) 1.6654; (R1) 1.6709; More...
Intraday bias in EUR/AUD stays on the upside for retesting 1.6800 resistance. Break there will resume the rise from 1.5963 to 61.8% projection of 1.5963 to 136800 from 1.6355 at 1.6872. Sustained trading above there should bring upside acceleration to 100% projection at 1.7192, which is close to 1.7180 high. On the downside, below 1.6597 minor support will delay the bullish case and turn intraday bias neutral first.
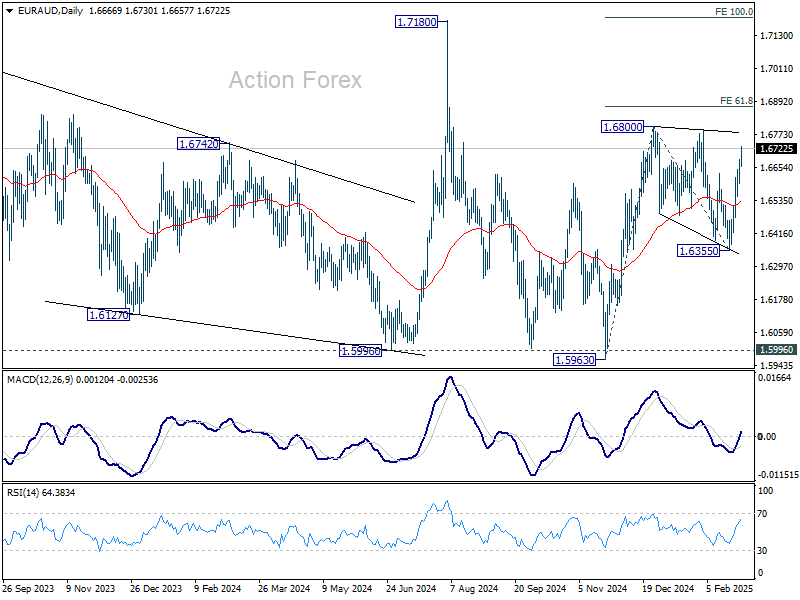
In the bigger picture, with 1.5996 key support (2024 low) intact, larger up trend from 1.4281 (2022 low) is still in favor to resume through 1.7180 at a later stage. Nevertheless, sustained break of 1.5996 will indicate that such up trend has completed and deeper decline would be seen.
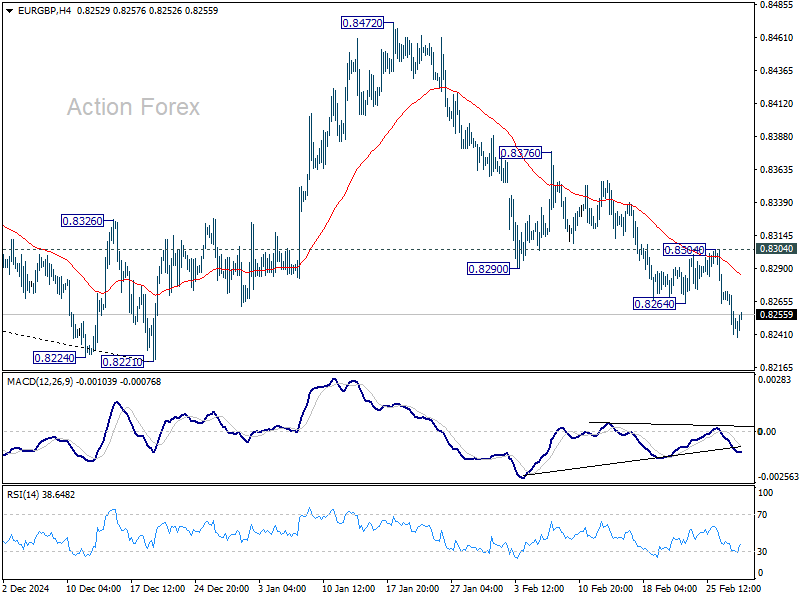
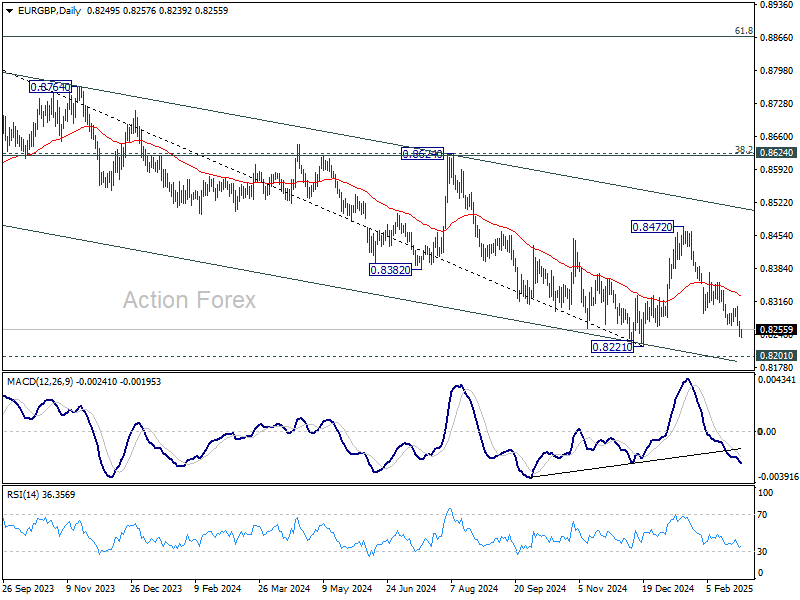
EUR/GBP Daily Outlook
Daily Pivots: (S1) 0.8238; (P) 0.8256; (R1) 0.8271; More...
Intraday bias in EUR/GBP remains on the downside as fall from 0.8472 is in progress for retesting 0.8201/21 key support level. Firm break there will carry larger bearish implications. For now, risk will stay on the downside as long as 0.8304 resistance holds, in case of recovery.
In the bigger picture, the medium term down trend remains intact with EUR/GBP staying well inside the falling channel. Prior rejection by 55 W EMA (now at 0.8431) also affirm bearishness. Decisive break of 0.8201/8221 support zone will resume whole down trend from 0.9449 (2020 high) and carry larger bearish implications.
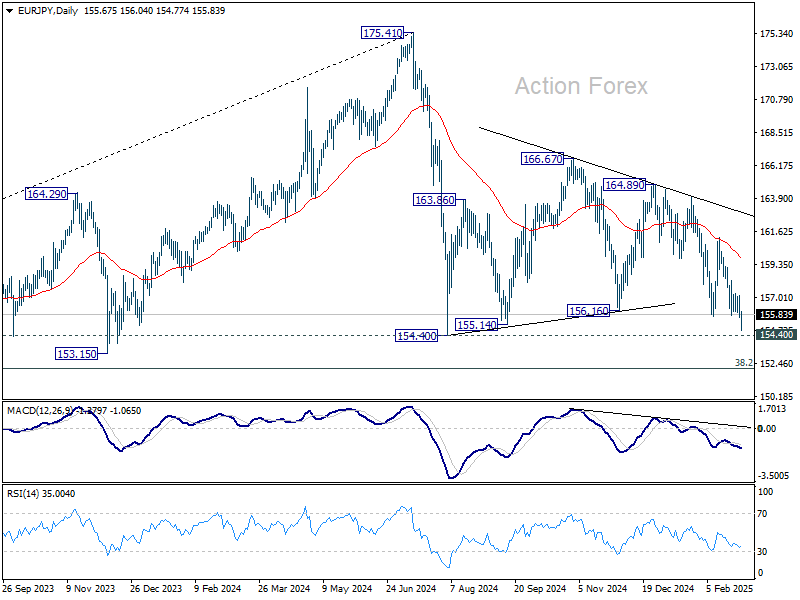
EUR/JPY Daily Outlook
Daily Pivots: (S1) 155.21; (P) 156.22; (R1) 156.77; More...
Intraday bias in EUR/JPY is back on the downside with break of 155.72 support, and deeper fall should be seen to 154.40 key support. Firm break there will confirm resumption of whole decline from 175.41 and target 152.11 fibonacci level next. On the upside, above 157.29 resistance will turn intraday bias neutral again first.
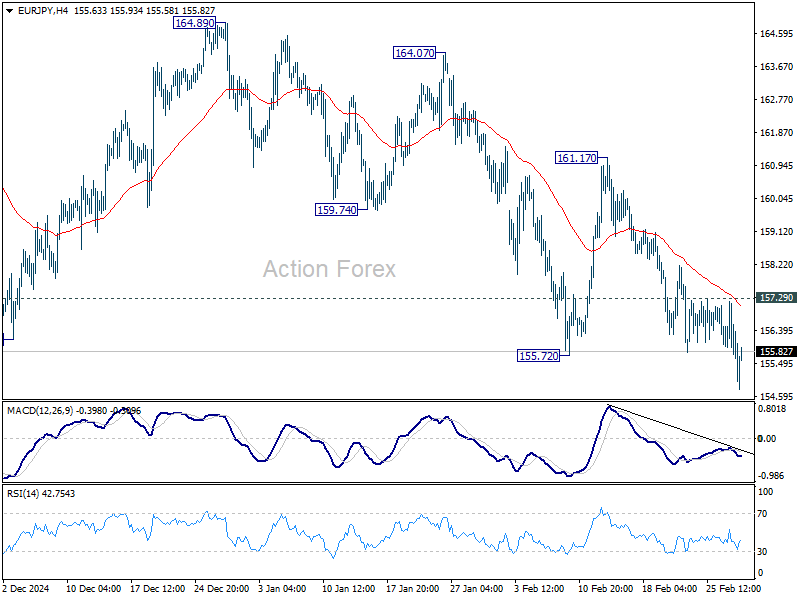
In the bigger picture, price actions from 175.41 are seen as correction to rally from 114.42 (2020 low). Strong support should be seen from 38.2% retracement of 114.42 to 175.41 at 152.11 to contain downside. However, sustained break of 152.11 will bring deeper fall even still as a correction. Next target will be 100% projection of 175.41 to 154.40 from 166.67 at 145.66.
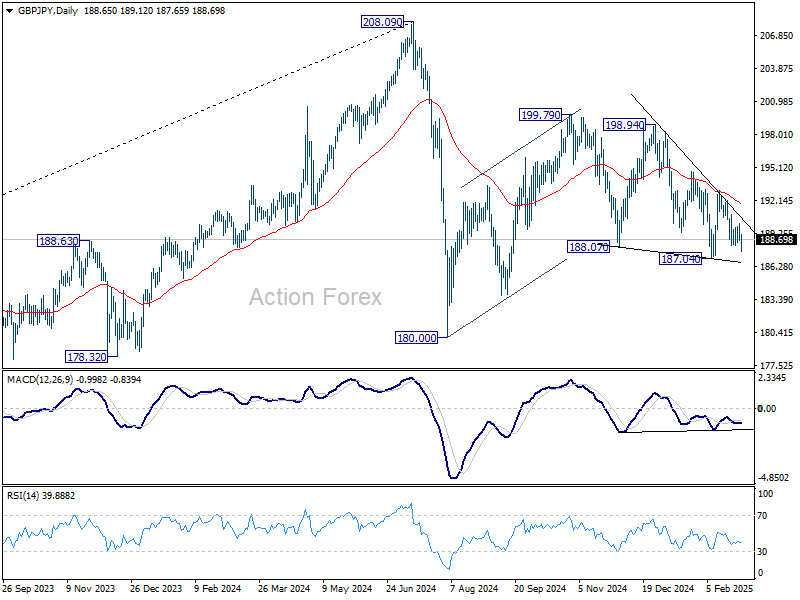
GBP/JPY Daily Outlook
Daily Pivots: (S1) 188.20; (P) 189.15; (R1) 189.73; More...
Intraday bias in GBP/JPY remains neutral for now, and risk stays mildly on the downside with 193.04 resistance intact. On the downside, firm break of 187.04 will extend the fall from 199.79 towards 180.00 support. That will also raise the chance that correction from 208.09 is resuming downward.
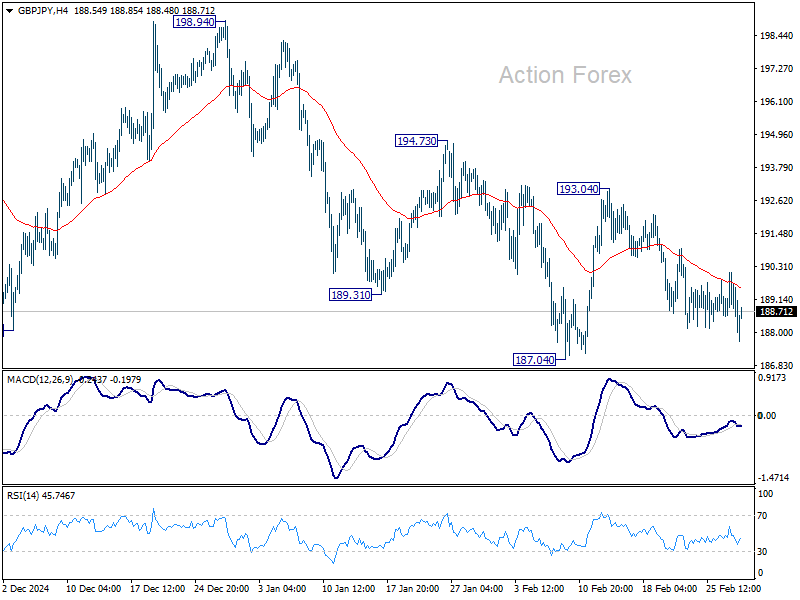
In the bigger picture, price actions from 208.09 are seen as a correction to rally from 123.94 (2020 low). Strong support should be seen from 38.2% retracement of 123.94 to 208.09 at 175.94 to contain downside. However, sustained break of 152.11 will bring deeper fall even still as a correction.
EUR/USD Daily Outlook
Daily Pivots: (S1) 1.0365; (P) 1.0430; (R1) 1.0462; More...
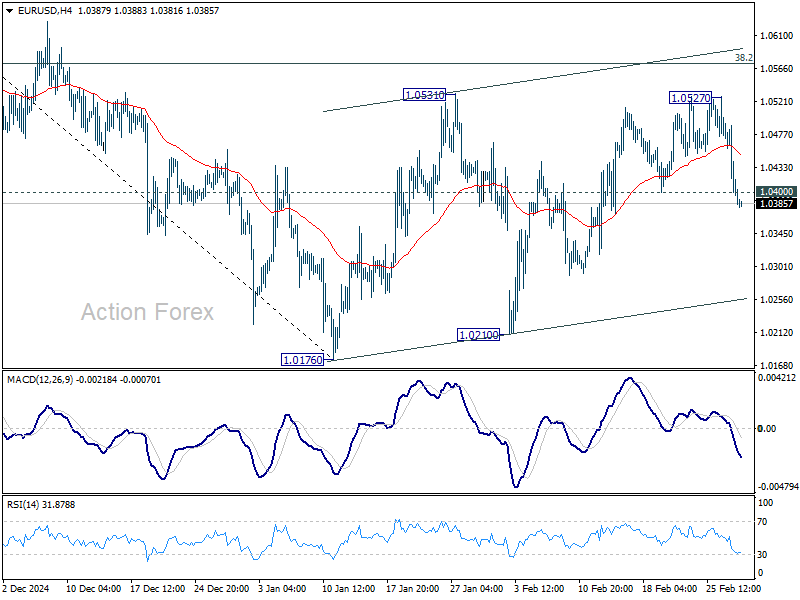
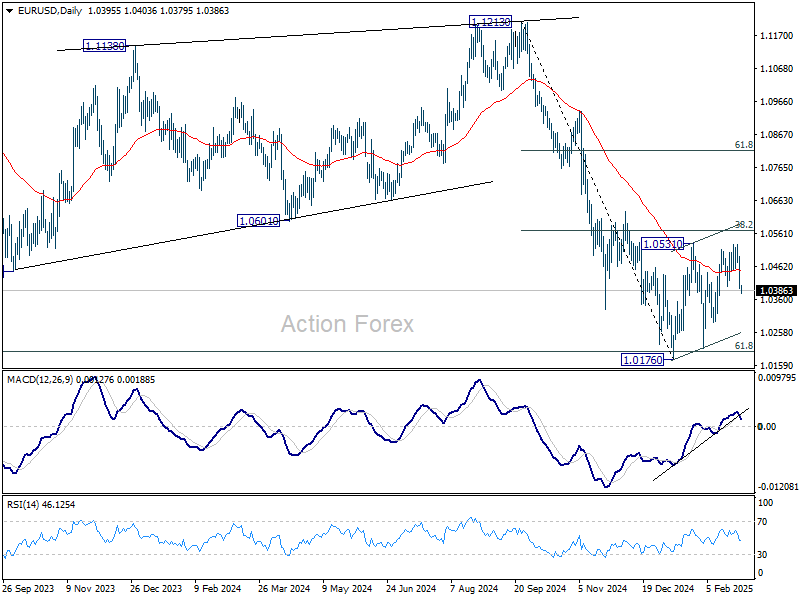
EUR/USD's break of 1.0400 support suggests that consolidation from 1.0176 has already completed at 1.0527, ahead of 38.2% retracement of 1.1213 to 1.0176 at 1.0572. Intraday bias is back on the downside for retesting 1.0176/0210 support zone. Firm break there will resume whole decline from 1.1213. For now, risk will stay on the downside as long as 1.0527 holds, in case of recovery.
In the bigger picture, immediate focus is on 61.8 retracement of 0.9534 (2022 low) to 1.1274 (2024 high) at 1.0199. Sustained break there will solidify the case of medium term bearish trend reversal, and pave the way back to 0.9534. However, reversal from 1.0199 will argue that price actions from 1.1274 are merely a corrective pattern, and has already completed.
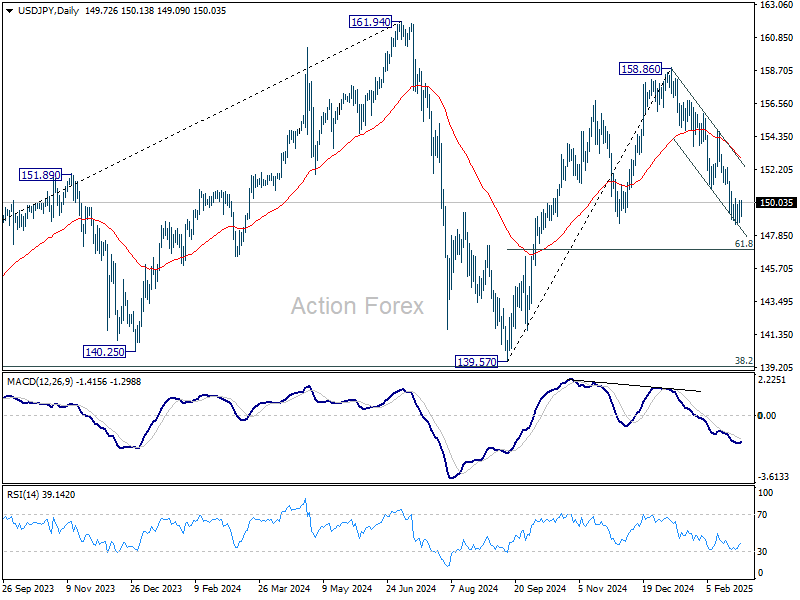
USD/JPY Daily Outlook
Daily Pivots: (S1) 148.98; (P) 149.57; (R1) 150.39; More....
Intraday bias in USD/JPY remains neutral and further decline is expected with 150.92 support turned resistance intact. Current fall from 158.86 is seen as the third leg of the pattern from 161.94 high. Below 148.55 will target 61.8% retracement of 139.57 to 158.86 at 146.32 next. On the upside, however, break of 150.92 will indicate short term bottoming and bring stronger rebound.
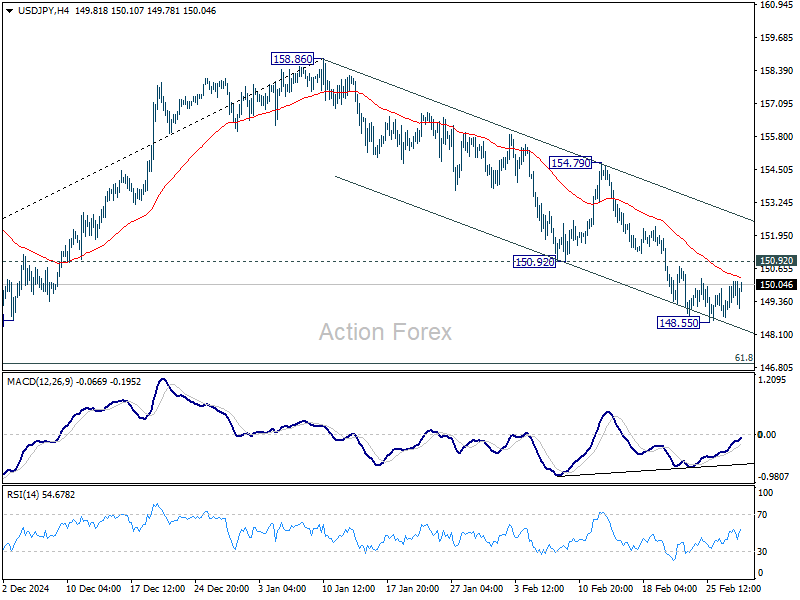
In the bigger picture, price actions from 161.94 are seen as a corrective pattern to rise from 102.58 (2021 low). In case of another fall, strong support should be seen from 38.2% retracement of 102.58 to 161.94 at 139.26 to bring rebound. However, sustained break of 139.26 would open up deeper medium term decline to 61.8% retracement at 125.25.
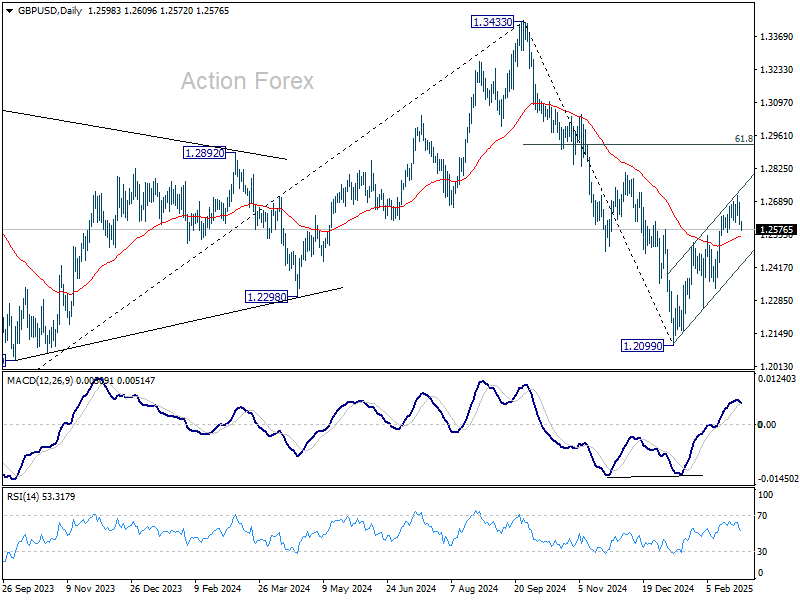
GBP/USD Daily Outlook
Daily Pivots: (S1) 1.2569; (P) 1.2630; (R1) 1.2663; More...
GBP/USD's break of 1.2602 support suggests that a short term top is already formed at 1.2715, on bearish divergence condition in 4H MACD. Intraday bias is back on the downside for near term channel support (now at 1.2424). Firm break there will argue that whole rebound from 1.2099 has completed as a correction. On the upside, though, break of 1.2715 will resume the rebound to 1.2810 resistance next.
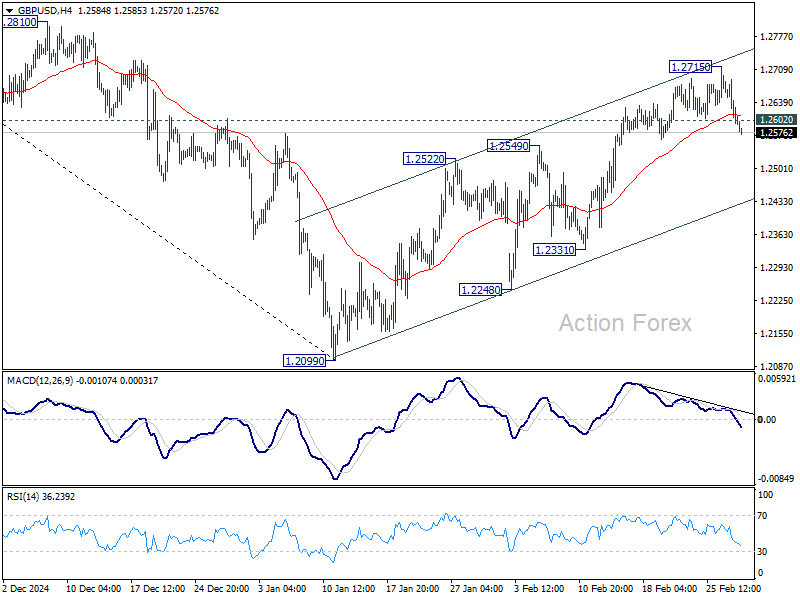
In the bigger picture, rise from 1.0351 (2022 low) should have already completed at 1.3433 (2024 high), and the trend has reversed. Further fall is now expected as long as 1.2810 resistance holds. Deeper decline should be seen to 61.8% retracement of 1.0351 to 1.3433 at 1.1528, even as a corrective move. However, firm break of 1.2810 will dampen this bearish view and bring retest of 1.3433 high instead.
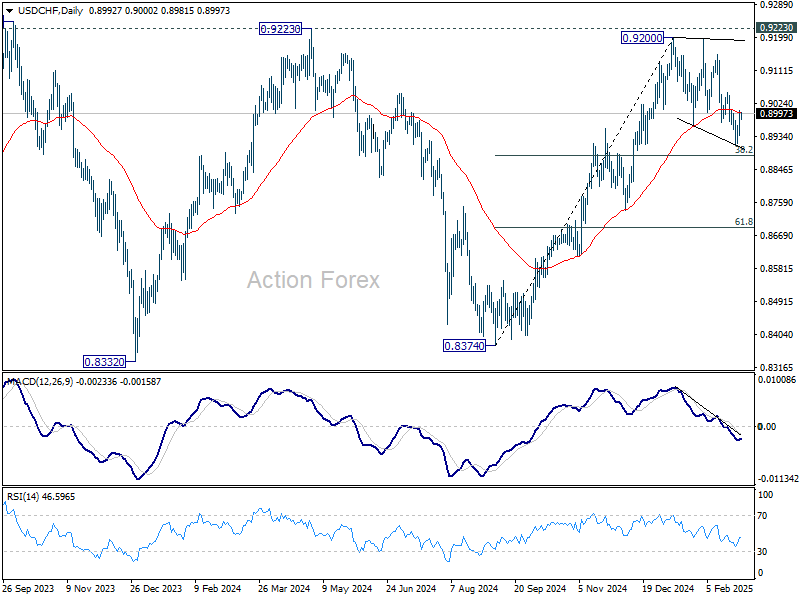
USD/CHF Daily Outlook
Daily Pivots: (S1) 0.8953; (P) 0.8980; (R1) 0.9023; More…
Intraday bias in USD/CHF remains neutral for the moment. On the upside, firm break of 0.9053 resistance will suggest that corrective pattern from 0.9200 has already completed. Further rally should then be seen to retest 0.9200 resistance. In case of another fall, downside should be contained by 38.2% retracement of 0.8374 to 0.9200 at 0.8884 to bring rebound.
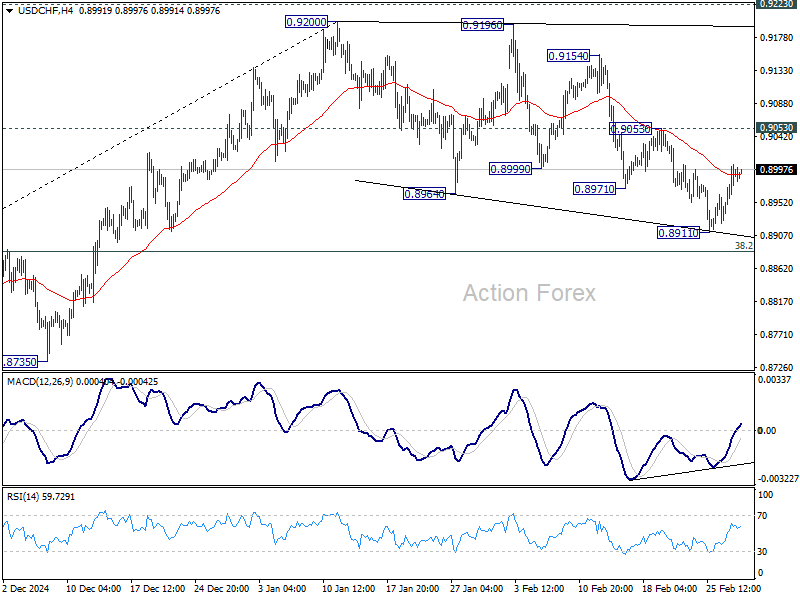
In the bigger picture, decisive break of 0.9223 resistance will argue that whole down trend from 1.0342 (2017 high) has completed with three waves down to 0.8332 (2023 low). Outlook will be turned bullish for 1.0146 resistance next. Nevertheless, rejection by 0.9223 will retain medium term bearishness for another decline through 0.8332 at a later stage.
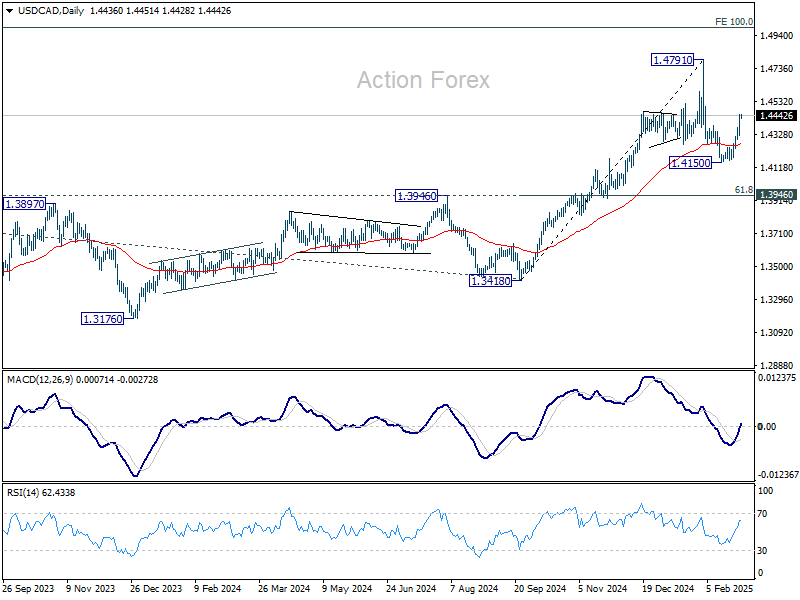
USD/CAD Daily Outlook
Daily Pivots: (S1) 1.4356; (P) 1.4402; (R1) 1.4483; More...
Intraday bias in USD/CAD remains on the upside for the moment. Corrective pullback from 1.4791 should have completed at 1.4150 already. Further rise should be seen to retest 1.4791. Firm break there will resume larger up trend. ON the downside, below 1.4298 minor support will turn intraday bias neutral and bring consolidations before staging another rally.
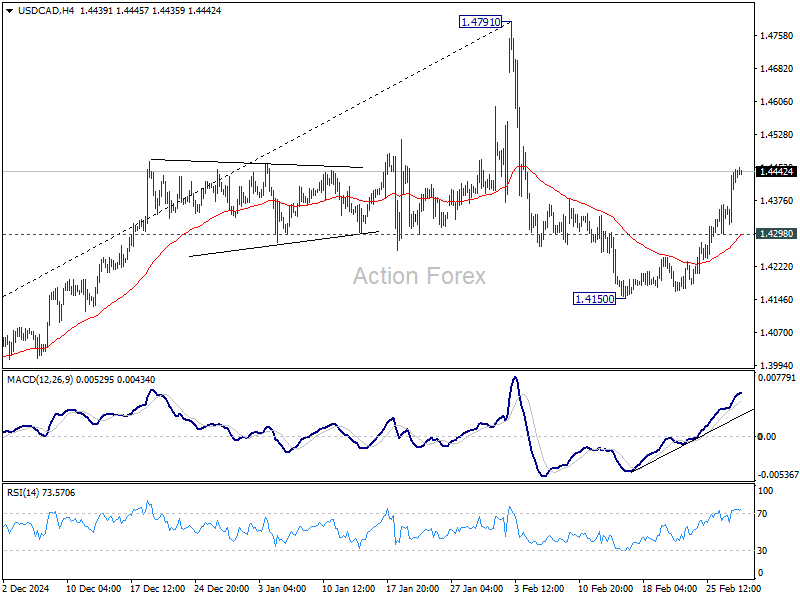
In the bigger picture, long term up trend is tentatively seen as resuming with prior breach of 1.4667/89 key resistance zone (2020/2015 highs). Next target is 100% projection of 1.2401 to 1.3976 from 1.3418 at 1.4993. This will remain the favored case as long as 1.3976 resistance turned support holds (2022 high), even in case of deep pullback.
Markets Reel Under Trade War Fears, Dollar Gains Traction, Gold Falls
Global stock markets are under heavy selling pressure as risk-off sentiment dominates the final trading day of February. The selloff intensified across major indices, with Japan’s Nikkei plunging -3% and Hong Kong’s Hang Seng Index down -2.8%, following the steep declines in US equities overnight. Investors are increasingly wary of escalating trade tensions, which could further weigh on the fragile global recovery.
Market sentiment took a sharp hit after confirmation that the 25% US tariffs on Mexico and Canada will take effect on March 4. The more consequential reciprocal tariffs, set for April 2, have also drawn attention, particularly with US President Donald Trump threatening to extend a 25% tariff on European Union imports.
NASDAQ was the hardest hit among US indices, tumbling -2.78%, with semiconductor giant Nvidia leading the declines with an -8.5% drop. Despite reporting strong quarterly earnings, the company is facing increased concerns that it won’t be immune to the broader trade war, particularly if Taiwan’s chip industry comes under new US tariff measures. Given Nvidia’s dominant role in the AI sector, any disruption in its supply chain could ripple through the entire tech sector.
In the currency markets, Dollar is now firmly leading the weekly performance rankings after its sharp rally overnight. Swiss Franc follows as the second-strongest, while Sterling also benefits from the broader selloff in Euro. Meanwhile, commodity-linked currencies are bearing the brunt of risk aversion, with New Zealand Dollar plunging the most, followed by Australian and Canadian Dollars. While Euro and Yen are positioned in the middle of the performance spectrum, the single currency is looking rather vulnerable.
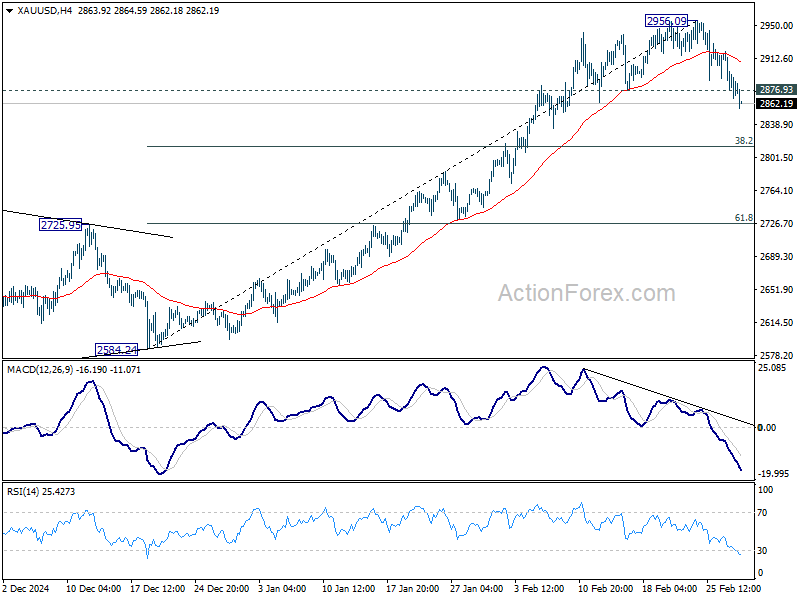
Technically, Gold’s extended decline is another confirmation of the Dollar’s underlying strength. The break of 2876.93 support confirms short-term topping at 2956.09, just below the key psychological 3000 level, with bearish divergence in 4H MACD.
Deeper correction should be seen to 38.2% retracement of 2584.24 to 2956.09 at 2814.04. Rebound from there indicate that it's just a near term correction, and keep the larger up trend intact. However, sustained break of 2814.04 will suggest that a larger scale correction is already unfolding.
In Asia, at the time of writing, Nikkei is down -2.97%. Hong Kong HSI is down -2.58%. China Shanghai SSE is down -1.11%. Singapore Strait Times is down -0.72%. Japan 10-year JGB yield is down -0.023 at 1.373. Overnight, DOW fell -0.45%. S&P 500 fell -1.59%. NASDAQ fell -2.78%. 10-year yield rose 0.036 to 4.285.
BoJ’s Uchida: Yield rise reflects market’s views on economic and global developments
Speaking in parliament today, BoJ Deputy Governor Shinichi Uchida said recent rise in JGB yields "reflects the market's view on the economic and price outlook, as well as overseas developments."
"There's no change to our stance on short-term policy rates and government bond operations," he emphasized, adding that the bond holdings "continue to exert a strong monetary easing effect" on the economy.
When asked whether the prospect of further rate hikes and tapering would continue to drive yields higher, Uchida responded that it is ultimately “up to markets to decide.”
Japan's Tokyo CPI slows to 2.2% yoy in Feb, industrial production down -1.1% mom in Jan
Tokyo’s core CPI (ex-food) slowed to 2.2% yoy in February, down from 2.5% yoy and below market expectations of 2.3% yoy. This marks the first decline in four months, largely due to the reintroduction of energy subsidies. Meanwhile, core-core CPI (ex-food and energy) held steady at 1.9% yoy. Headline CPI slowed from 3.4% yoy to 2.9% yoy.
In the industrial sector, production contracted by -1.1% mom in January, a sharper decline than the expected -0.9%. Manufacturers surveyed by Japan’s Ministry of Economy, Trade, and Industry anticipate a strong 5.0% mom rebound in February, followed by a -2.0% mom drop in March.
On the consumer front, retail sales grew 3.9% yoy in January, slightly missing the 4.0% yoy forecast, but still pointing to resilient domestic demand.
Fed’s Hammack signals cautious approach, stresses policy patience
Cleveland Fed President Beth Hammack said Fed has the "luxury of being patient" given the strength of the labor market and the uneven progress in reducing inflation.
In a speech overnight, she noted that while inflation has moderated, it remains above the 2% target, and policymakers are not yet confident that price pressures will fully subside. As a result, she expects the federal funds rate to stay steady "for some time".
Hammack acknowledged that the current policy stance has helped ease inflation, but she warned that risks remain. While Fed anticipates a gradual return to 2% inflation over the medium term, she stressed that this is "far from a certainty."
She suggested Fed will need to take a "patient approach" in monitoring how inflation and the labor market adjust before making any policy changes.
Fed's Harker says one inflation report shouldn't sway policy in either direction
Philadelphia Fed President Patrick Harker noted in a speech overnight that recent inflation data continues to show an uneven path toward the 2% target. He acknowledged that January’s consumer price data came in hotter than expected, marking the fastest increase in 18 months.
However, he stressed that policymakers should "not be moved to act, in either direction" based on a single month’s data.
Harker reaffirmed his stance that the Fed’s current policy rate remains sufficiently restrictive to keep inflation in check without undermining overall economic stability.
Despite inflation’s persistence, Harker remains optimistic about the economic outlook. He stated, “I am of a position that we let monetary policy continue to work.”
Looking ahead
Germany will release CPI flash, import prices, retail sales and unemployment in European session. Swiss will release KOF economic barometer.
Later in the day, Canada will publish GDP. Focus is also on US PCE inflation, goods trade balance and Chicago PMI.
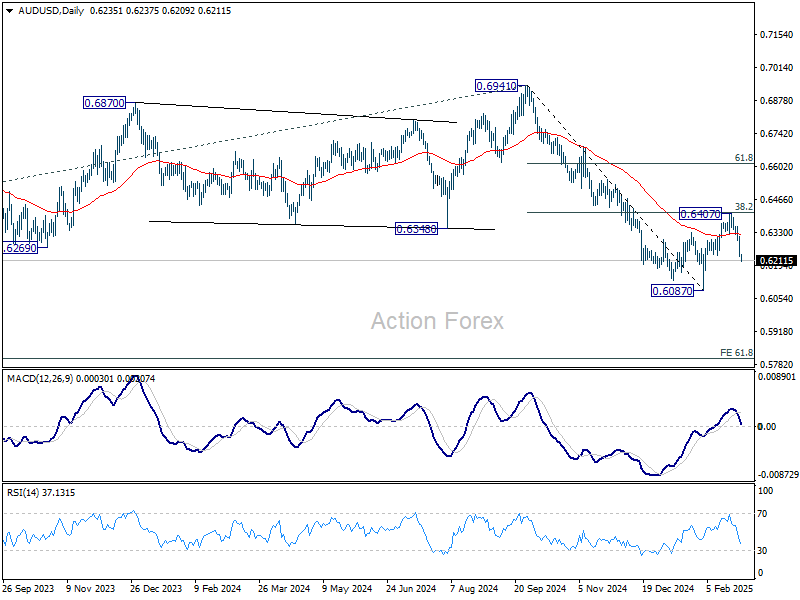
AUD/USD Daily Report
Daily Pivots: (S1) 0.6207; (P) 0.6261; (R1) 0.6291; More...
AUD/USD's fall from 0.6407 accelerated lower today and intraday bias stays on the downside for retesting 0.6087 low. Decisive break there will resume larger decline from 0.6941. On the upside, above 0.6284 minor resistance will turn intraday bias neutral first. But outlook will remain bearish as long as 38.2% retracement of 0.6941 to 0.6087 at 0.6413 holds, in case of recovery.
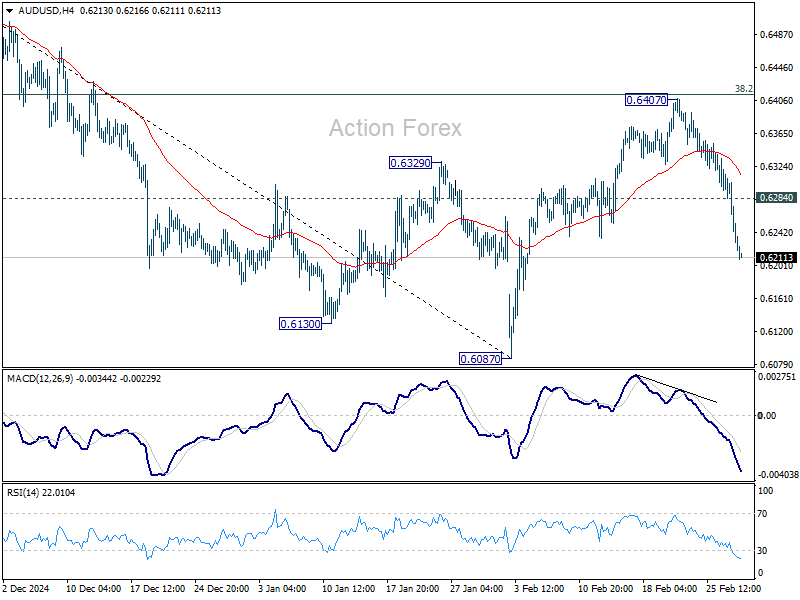
In the bigger picture, fall from 0.6941 (2024 high) is seen as part of the down trend from 0.8006 (2021 high). Next medium term target is 61.8% projection of 0.8006 to 0.6169 from 0.6941 at 0.5806. In any case, outlook will stay bearish as long as 55 W EMA (now at 0.6505) holds.