
Sample Category Title
Summary 3/3 – 3/7
Monday, Mar 3, 2025
| GMT | Ccy | Events | Consensus | Previous |
|---|---|---|---|---|
| 21:45 | NZD | Terms of Trade Index Q4 | 1.50% | 2.40% |
| 00:00 | AUD | TD-MI Inflation Gauge M/M Feb | 0.10% | |
| 00:30 | AUD | Company Gross Operating Profits Q/Q Q4 | 1.50% | -4.60% |
| 00:30 | JPY | Manufacturing PMI Feb F | 48.9 | 48.9 |
| 01:45 | CNY | Caixin Manufacturing PMI Feb | 50.3 | 50.1 |
| 08:30 | CHF | Manufacturing PMI Feb | 48.4 | 47.5 |
| 08:50 | EUR | France Manufacturing PMI Feb F | 45.5 | 45.5 |
| 08:55 | EUR | Germany Manufacturing PMI Feb F | 46.1 | 46.1 |
| 09:00 | EUR | Eurozone Manufacturing PMI Feb F | 47.3 | 47.3 |
| 09:30 | GBP | Manufacturing PMI Feb F | 46.4 | 46.4 |
| 09:30 | GBP | Mortgage Approvals Jan | 66K | 67K |
| 09:30 | GBP | M4 Money Supply M/M Jan | 0.10% | |
| 10:00 | EUR | Eurozone CPI Y/Y Feb P | 2.30% | 2.50% |
| 10:00 | EUR | Eurozone CPI Core Y/Y Feb P | 2.50% | 2.70% |
| 14:30 | CAD | Manufacturing PMI Feb | 51.6 | |
| 14:45 | USD | Manufacturing PMI Feb F | 51.6 | 51.6 |
| 15:00 | USD | ISM Manufacturing PMI Feb | 50.8 | 50.9 |
| 15:00 | USD | ISM Manufacturing Prices Paid Feb | 56.2 | 54.9 |
| 15:00 | USD | ISM Manufacturing Employment Feb | 50.3 | |
| 15:00 | USD | Construction Spending M/M Jan | -0.10% | 0.50% |
| 21:45 | NZD | Building Permits M/M Jan | -5.60% | |
| 23:30 | JPY | Unemployment Rate Jan | 2.40% | 2.40% |
| 23:50 | JPY | Capital Spending Q4 | 4.90% | 8.10% |
| 23:50 | JPY | Monetary Base Y/Y Feb | -1.80% | -2.50% |
| GMT | Ccy | Events | |
|---|---|---|---|
| 21:45 | NZD | Terms of Trade Index Q4 | |
| Forecast: 1.50% | Previous: 2.40% | ||
| 00:00 | AUD | TD-MI Inflation Gauge M/M Feb | |
| Forecast: | Previous: 0.10% | ||
| 00:30 | AUD | Company Gross Operating Profits Q/Q Q4 | |
| Forecast: 1.50% | Previous: -4.60% | ||
| 00:30 | JPY | Manufacturing PMI Feb F | |
| Forecast: 48.9 | Previous: 48.9 | ||
| 01:45 | CNY | Caixin Manufacturing PMI Feb | |
| Forecast: 50.3 | Previous: 50.1 | ||
| 08:30 | CHF | Manufacturing PMI Feb | |
| Forecast: 48.4 | Previous: 47.5 | ||
| 08:50 | EUR | France Manufacturing PMI Feb F | |
| Forecast: 45.5 | Previous: 45.5 | ||
| 08:55 | EUR | Germany Manufacturing PMI Feb F | |
| Forecast: 46.1 | Previous: 46.1 | ||
| 09:00 | EUR | Eurozone Manufacturing PMI Feb F | |
| Forecast: 47.3 | Previous: 47.3 | ||
| 09:30 | GBP | Manufacturing PMI Feb F | |
| Forecast: 46.4 | Previous: 46.4 | ||
| 09:30 | GBP | Mortgage Approvals Jan | |
| Forecast: 66K | Previous: 67K | ||
| 09:30 | GBP | M4 Money Supply M/M Jan | |
| Forecast: | Previous: 0.10% | ||
| 10:00 | EUR | Eurozone CPI Y/Y Feb P | |
| Forecast: 2.30% | Previous: 2.50% | ||
| 10:00 | EUR | Eurozone CPI Core Y/Y Feb P | |
| Forecast: 2.50% | Previous: 2.70% | ||
| 14:30 | CAD | Manufacturing PMI Feb | |
| Forecast: | Previous: 51.6 | ||
| 14:45 | USD | Manufacturing PMI Feb F | |
| Forecast: 51.6 | Previous: 51.6 | ||
| 15:00 | USD | ISM Manufacturing PMI Feb | |
| Forecast: 50.8 | Previous: 50.9 | ||
| 15:00 | USD | ISM Manufacturing Prices Paid Feb | |
| Forecast: 56.2 | Previous: 54.9 | ||
| 15:00 | USD | ISM Manufacturing Employment Feb | |
| Forecast: | Previous: 50.3 | ||
| 15:00 | USD | Construction Spending M/M Jan | |
| Forecast: -0.10% | Previous: 0.50% | ||
| 21:45 | NZD | Building Permits M/M Jan | |
| Forecast: | Previous: -5.60% | ||
| 23:30 | JPY | Unemployment Rate Jan | |
| Forecast: 2.40% | Previous: 2.40% | ||
| 23:50 | JPY | Capital Spending Q4 | |
| Forecast: 4.90% | Previous: 8.10% | ||
| 23:50 | JPY | Monetary Base Y/Y Feb | |
| Forecast: -1.80% | Previous: -2.50% | ||
Tuesday, Mar 4, 2025
| GMT | Ccy | Events | Consensus | Previous |
|---|---|---|---|---|
| 00:30 | AUD | RBA Meeting Minutes | ||
| 00:30 | AUD | Current Account (AUD) Q4 | -11.0B | -14.1B |
| 00:30 | AUD | Retail Sales M/M Jan | 0.30% | -0.10% |
| 05:00 | JPY | Consumer Confidence Index Feb | 35.7 | 35.2 |
| 10:00 | EUR | Eurozone Unemployment Rate Jan | 6.30% | 6.30% |
| GMT | Ccy | Events | |
|---|---|---|---|
| 00:30 | AUD | RBA Meeting Minutes | |
| Forecast: | Previous: | ||
| 00:30 | AUD | Current Account (AUD) Q4 | |
| Forecast: -11.0B | Previous: -14.1B | ||
| 00:30 | AUD | Retail Sales M/M Jan | |
| Forecast: 0.30% | Previous: -0.10% | ||
| 05:00 | JPY | Consumer Confidence Index Feb | |
| Forecast: 35.7 | Previous: 35.2 | ||
| 10:00 | EUR | Eurozone Unemployment Rate Jan | |
| Forecast: 6.30% | Previous: 6.30% | ||
Wednesday, Mar 5, 2025
| GMT | Ccy | Events | Consensus | Previous |
|---|---|---|---|---|
| 00:30 | AUD | GDP Q/Q Q4 | 0.50% | 0.30% |
| 00:30 | JPY | Services PMI Feb F | 53.1 | 53.1 |
| 01:45 | CNY | Caixin Services PMI Feb | 50.8 | 51 |
| 07:30 | CHF | CPI M/M Feb | 0.50% | -0.10% |
| 07:30 | CHF | CPI Y/Y Feb | 0.40% | |
| 08:50 | EUR | France Services PMI Feb F | 44.5 | 44.5 |
| 08:55 | EUR | Germany Services PMI Feb F | 52.2 | 52.2 |
| 09:00 | EUR | Eurozone Services PMI Feb F | 50.7 | 50.7 |
| 09:30 | GBP | Services PMI Feb F | 51.1 | 51.1 |
| 10:00 | EUR | Eurozone PPI M/M Jan | 0.30% | 0.40% |
| 10:00 | EUR | Eurozone PPI Y/Y Jan | 0% | |
| 13:15 | USD | ADP Employment Change Feb | 140K | 183K |
| 13:30 | CAD | Labor Productivity Q/Q Q4 | 0.30% | -0.40% |
| 14:45 | USD | Services PMI Feb F | 49.7 | 49.7 |
| 15:00 | USD | ISM Services PMI Feb | 53 | 52.8 |
| 15:00 | USD | Factory Orders M/M Jan | 1.50% | -0.90% |
| 15:30 | USD | Crude Oil Inventories | -2.3M | |
| 19:00 | USD | Fed's Beige Book |
| GMT | Ccy | Events | |
|---|---|---|---|
| 00:30 | AUD | GDP Q/Q Q4 | |
| Forecast: 0.50% | Previous: 0.30% | ||
| 00:30 | JPY | Services PMI Feb F | |
| Forecast: 53.1 | Previous: 53.1 | ||
| 01:45 | CNY | Caixin Services PMI Feb | |
| Forecast: 50.8 | Previous: 51 | ||
| 07:30 | CHF | CPI M/M Feb | |
| Forecast: 0.50% | Previous: -0.10% | ||
| 07:30 | CHF | CPI Y/Y Feb | |
| Forecast: | Previous: 0.40% | ||
| 08:50 | EUR | France Services PMI Feb F | |
| Forecast: 44.5 | Previous: 44.5 | ||
| 08:55 | EUR | Germany Services PMI Feb F | |
| Forecast: 52.2 | Previous: 52.2 | ||
| 09:00 | EUR | Eurozone Services PMI Feb F | |
| Forecast: 50.7 | Previous: 50.7 | ||
| 09:30 | GBP | Services PMI Feb F | |
| Forecast: 51.1 | Previous: 51.1 | ||
| 10:00 | EUR | Eurozone PPI M/M Jan | |
| Forecast: 0.30% | Previous: 0.40% | ||
| 10:00 | EUR | Eurozone PPI Y/Y Jan | |
| Forecast: | Previous: 0% | ||
| 13:15 | USD | ADP Employment Change Feb | |
| Forecast: 140K | Previous: 183K | ||
| 13:30 | CAD | Labor Productivity Q/Q Q4 | |
| Forecast: 0.30% | Previous: -0.40% | ||
| 14:45 | USD | Services PMI Feb F | |
| Forecast: 49.7 | Previous: 49.7 | ||
| 15:00 | USD | ISM Services PMI Feb | |
| Forecast: 53 | Previous: 52.8 | ||
| 15:00 | USD | Factory Orders M/M Jan | |
| Forecast: 1.50% | Previous: -0.90% | ||
| 15:30 | USD | Crude Oil Inventories | |
| Forecast: | Previous: -2.3M | ||
| 19:00 | USD | Fed's Beige Book | |
| Forecast: | Previous: | ||
Thursday, Mar 6, 2025
| GMT | Ccy | Events | Consensus | Previous |
|---|---|---|---|---|
| 00:30 | AUD | Building Permits M/M Jan | -0.10% | 0.70% |
| 00:30 | AUD | Trade Balance (AUD) Jan | 5.68B | 5.09B |
| 06:45 | CHF | Unemployment Rate Feb | 2.70% | 2.70% |
| 09:30 | GBP | Construction PMI Feb | 49.8 | 48.1 |
| 10:00 | EUR | Eurozone Retail Sales M/M Jan | 0.10% | -0.20% |
| 12:30 | USD | Challenger Job Cuts Y/Y Feb | -39.50% | |
| 13:15 | EUR | ECB Deposit Rate | 2.50% | 2.75% |
| 13:15 | EUR | ECB Main Refinancing Rate | 2.65% | 2.90% |
| 13:30 | CAD | Trade Balance (CAD) Jan | 1.4B | 0.7B |
| 13:30 | USD | Initial Jobless Claims (Feb 28) | 236K | 242K |
| 13:30 | USD | Trade Balance (USD) Jan | -93.1B | -98.4B |
| 13:30 | USD | Nonfarm Productivity Q4 | 1.20% | 1.20% |
| 13:30 | USD | Unit Labor Costs Q4 | 3% | 3% |
| 13:45 | EUR | ECB Press Conference | ||
| 15:00 | USD | Wholesale Inventories Jan F | 0.70% | 0.70% |
| 15:00 | CAD | Ivey PMI Feb | 50.6 | 47.1 |
| 15:30 | USD | Natural Gas Storage | -261B |
| GMT | Ccy | Events | |
|---|---|---|---|
| 00:30 | AUD | Building Permits M/M Jan | |
| Forecast: -0.10% | Previous: 0.70% | ||
| 00:30 | AUD | Trade Balance (AUD) Jan | |
| Forecast: 5.68B | Previous: 5.09B | ||
| 06:45 | CHF | Unemployment Rate Feb | |
| Forecast: 2.70% | Previous: 2.70% | ||
| 09:30 | GBP | Construction PMI Feb | |
| Forecast: 49.8 | Previous: 48.1 | ||
| 10:00 | EUR | Eurozone Retail Sales M/M Jan | |
| Forecast: 0.10% | Previous: -0.20% | ||
| 12:30 | USD | Challenger Job Cuts Y/Y Feb | |
| Forecast: | Previous: -39.50% | ||
| 13:15 | EUR | ECB Deposit Rate | |
| Forecast: 2.50% | Previous: 2.75% | ||
| 13:15 | EUR | ECB Main Refinancing Rate | |
| Forecast: 2.65% | Previous: 2.90% | ||
| 13:30 | CAD | Trade Balance (CAD) Jan | |
| Forecast: 1.4B | Previous: 0.7B | ||
| 13:30 | USD | Initial Jobless Claims (Feb 28) | |
| Forecast: 236K | Previous: 242K | ||
| 13:30 | USD | Trade Balance (USD) Jan | |
| Forecast: -93.1B | Previous: -98.4B | ||
| 13:30 | USD | Nonfarm Productivity Q4 | |
| Forecast: 1.20% | Previous: 1.20% | ||
| 13:30 | USD | Unit Labor Costs Q4 | |
| Forecast: 3% | Previous: 3% | ||
| 13:45 | EUR | ECB Press Conference | |
| Forecast: | Previous: | ||
| 15:00 | USD | Wholesale Inventories Jan F | |
| Forecast: 0.70% | Previous: 0.70% | ||
| 15:00 | CAD | Ivey PMI Feb | |
| Forecast: 50.6 | Previous: 47.1 | ||
| 15:30 | USD | Natural Gas Storage | |
| Forecast: | Previous: -261B | ||
Friday, Mar 7, 2025
| GMT | Ccy | Events | Consensus | Previous |
|---|---|---|---|---|
| CNY | Trade Balance (USD) Feb | 104.8B | ||
| 07:00 | EUR | Germany Factory Orders M/M Jan | -2.40% | 6.90% |
| 07:45 | EUR | France Trade Balance (EUR) Jan | -4.1B | -3.9B |
| 08:00 | CHF | Foreign Currency Reserves (CHF) Feb | 736B | |
| 10:00 | EUR | Eurozone GDP Q/Q Q4 | 0.10% | 0.10% |
| 13:30 | CAD | Net Change in Employment Feb | 17.8K | 76K |
| 13:30 | CAD | Unemployment Rate Feb | 6.70% | 6.60% |
| 13:30 | CAD | Capacity Utilization Q4 | 79.00% | 79.30% |
| 13:30 | USD | Nonfarm Payrolls Feb | 156K | 143K |
| 13:30 | USD | Unemployment Rate Feb | 4% | 4% |
| 13:30 | USD | Average Hourly Earnings M/M Feb | 0.30% | 0.50% |
| GMT | Ccy | Events | |
|---|---|---|---|
| CNY | Trade Balance (USD) Feb | ||
| Forecast: | Previous: 104.8B | ||
| 07:00 | EUR | Germany Factory Orders M/M Jan | |
| Forecast: -2.40% | Previous: 6.90% | ||
| 07:45 | EUR | France Trade Balance (EUR) Jan | |
| Forecast: -4.1B | Previous: -3.9B | ||
| 08:00 | CHF | Foreign Currency Reserves (CHF) Feb | |
| Forecast: | Previous: 736B | ||
| 10:00 | EUR | Eurozone GDP Q/Q Q4 | |
| Forecast: 0.10% | Previous: 0.10% | ||
| 13:30 | CAD | Net Change in Employment Feb | |
| Forecast: 17.8K | Previous: 76K | ||
| 13:30 | CAD | Unemployment Rate Feb | |
| Forecast: 6.70% | Previous: 6.60% | ||
| 13:30 | CAD | Capacity Utilization Q4 | |
| Forecast: 79.00% | Previous: 79.30% | ||
| 13:30 | USD | Nonfarm Payrolls Feb | |
| Forecast: 156K | Previous: 143K | ||
| 13:30 | USD | Unemployment Rate Feb | |
| Forecast: 4% | Previous: 4% | ||
| 13:30 | USD | Average Hourly Earnings M/M Feb | |
| Forecast: 0.30% | Previous: 0.50% | ||
Markets Weekly Outlook – Tariffs, NFP and ECB Meeting on the Agenda
- Tariffs have been the primary driver of market volatility.
- US economic data shows signs of a potential stall, with consumer spending down and inflation remaining high.
- The S&P 500 and Nasdaq 100 are struggling, and the Fear and Greed index is in fear territory.
- Next week’s focus includes potential US tariffs, China’s Two Sessions meeting, and the ECB’s interest rate decision.
Week in Review: Tariff Chatter Continues to Drive Market Moves
Markets have been through another week where tariffs have been the driving force behind market moves. The PCE data which I had thought would be the major event for the week failed to stoke any real volatility and that is testament to what we have seen in 2025 thus far.
Markets are more occupied with the moves of the Trump administration than they are about the data.
US data this week showed signs that the economy may be stalling while overall market sentiment has been dented by tariff chatter and inflationary concerns. This was reflected in the CB consumer confidence data which showed a significant uptick in the 12 month interest rate expectations by consumers.
U.S. consumer spending dropped in January for the first time in almost two years, and the goods trade gap hit a record high as businesses sped up imports to avoid tariffs. This points to weak economic growth or even a possible contraction this quarter.
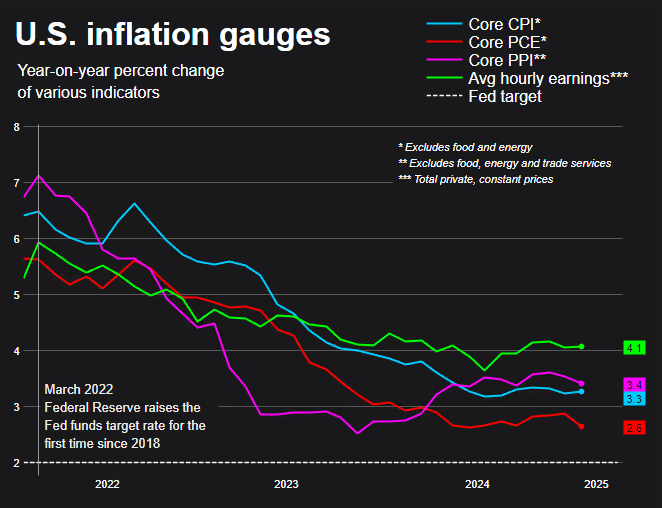
Data from the Commerce Department also showed that while inflation slowed down yearly, prices remain stubbornly high with steady monthly increases. Meanwhile, the Trump administration is increasing tariffs, which economists warn will lead to higher prices as businesses pass costs to consumers.
Sources: LSEG Datastream (click to enlarge)
Inflation expectations among consumers rose sharply in February. The Atlanta Federal Reserve cut its first-quarter GDP forecast, now predicting the economy will shrink by 1.5% annually instead of growing at the earlier estimate of 2.3%.
The S&P 500 and Nasdaq 100 struggles continued this week which is no surprise given the current market dynamics. The Fear and Greed index is now in fear territory as tariff chatter ramps up and economic data continues to underwhelm.
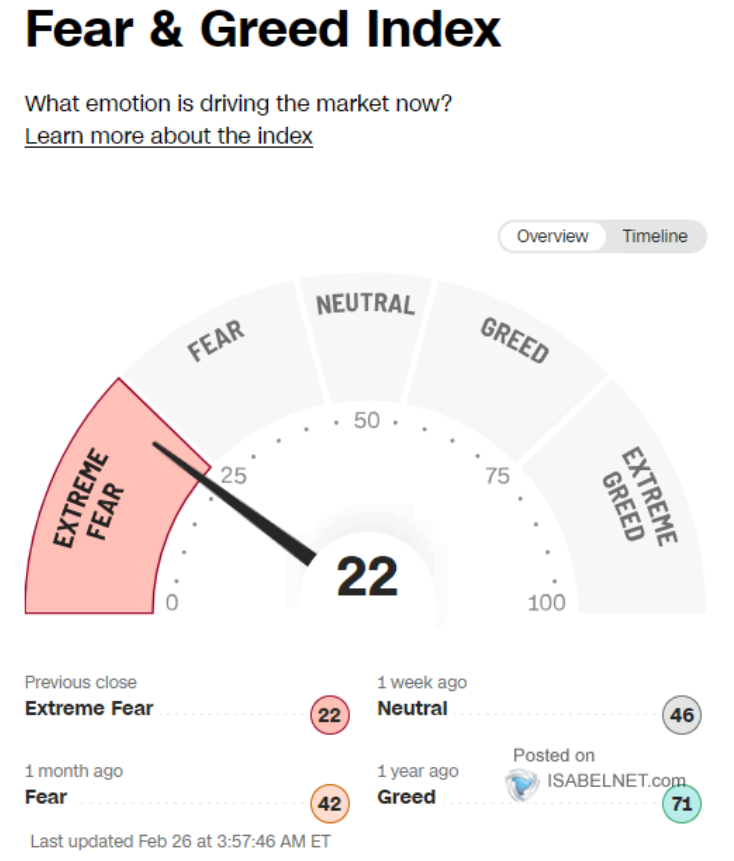
Source: Isabelnet (click to enlarge)
On the FX front,the Dollar returned to its king status this week weighing on US dollar denominated pairs with the Euro losing ground and retreating from the psychological 1.0500 handle.
Gold is the biggest loser this week and I was taken aback by the selloff. Mostly down to the fact that tariffs have until now been a positive for safe haven demand. The only explanation I can see is potential profit taking and gold traders concerned by the rise in inflation expectations.
Oil prices also struggled this week on growing concerns about global growth and Oil demand. A disagreement by OPEC + members on an output increase from April provided a brief respite on Thursday but was followed by another bearish day to end the week.
Crypto markets are also feeling the pinch with Bitcoin on course for its biggest weekly drop since the collapse of FTX in 2022.
The Week Ahead: Tariffs at the Forefront. Will Trump Follow Through?
Asia Pacific Markets
The main focus this week in the Asia Pacific region for me is China’s Two Sessions meeting.
Markets are closely watching China’s Government Work Report, which Premier Li Qiang will deliver on March 5. It will reveal the country’s 2025 growth target and outline key policies. China is expected to keep its growth goal at “around 5.0%,” the same as in 2024, while giving more details about fiscal and monetary plans.
This Saturday morning, China will release its official February purchasing managers’ index (PMI), with a slight growth at 50.1 expected. The Caixin PMI will follow on Monday. On Friday, China Customs will provide the first trade data for the first two months of 2025.
Europe + UK + US
In developed markets, the US PCE data released last week failed to shake markets as expected but the Trump administrations continue to throw curveballs for Global Market participants to navigate.
Next week is important for the US, with trade tariffs on imports from China, Mexico, and Canada possibly starting on March 4, along with key economic data, like the February jobs report.
President Trump argues that foreign countries will bear the cost due to a stronger dollar, but consumer prices may rise, similar to past tariffs. Consumer confidence is already shaky due to spending concerns and austerity measures, and more tariff news could worsen the outlook and dent overall market sentiment.
Economic data, including the ISM reports, is expected to show slow growth. Manufacturing and services surveys suggest a weaker outlook, and corporate caution over changing trade policies may lead to only a small rise in payrolls. Federal job cuts may take months to show a clear impact.
Next week, the European Central Bank will decide on interest rates after reviewing a new inflation report. A 0.25% rate cut is expected, though inflation might rise in February before easing. With more hawkish voices in the ECB, debates on the final rate for the eurozone are growing more important.
Unemployment is also in focus. Despite businesses cutting jobs recently, the unemployment rate remains at a record low of 6.3%. Any shift in the labor market could impact how far the ECB can lower rates.
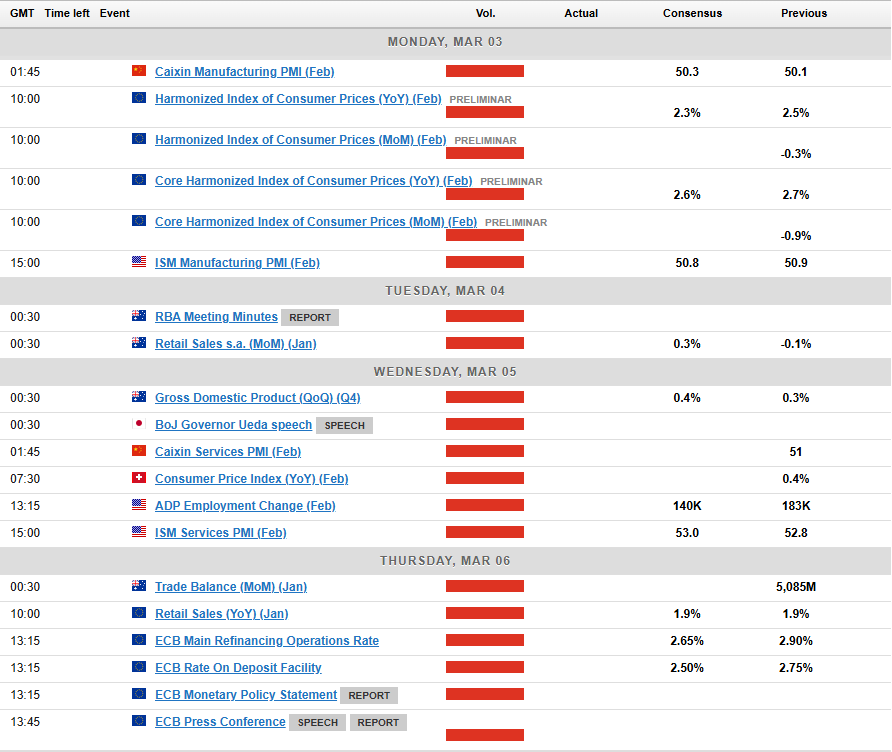
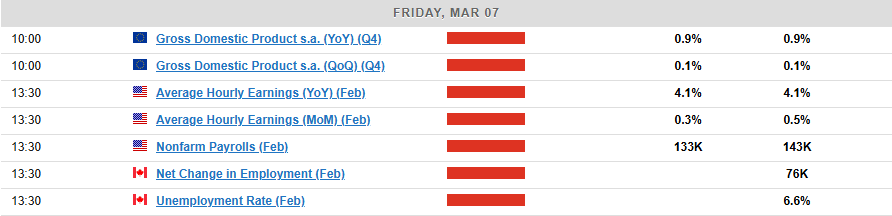
Chart of the Week
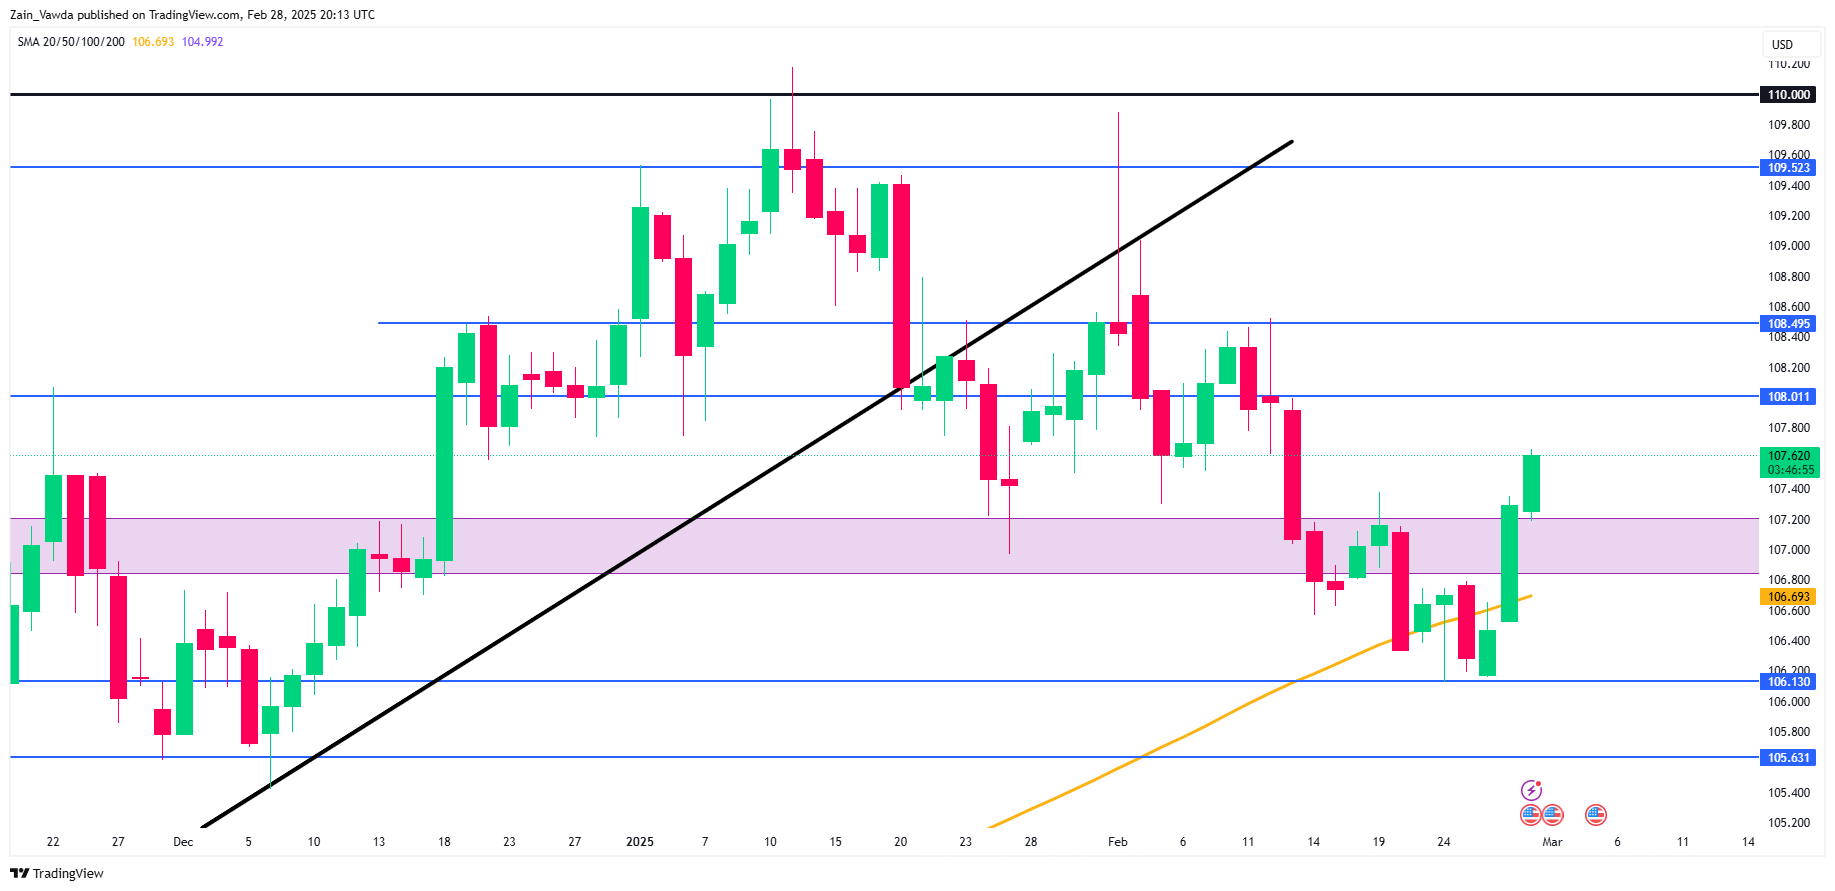
This week’s focus is on the US Dollar Index (DXY) after a solid recovery this week which has propelled the DXY back above the 107.00 handle.
A lot of the move was down to the tariff chatter which arose toward the backend of the week and that is likely to carry over into next week.
Currently the DXY is supported by the 107.00 handle with the 100-day MA resting at 106.700 also likely to provide support.
Immediate resistance rests at 108.00 before the 108.49 handle comes into focus.
US Dollar Index Daily Chart – February 28, 2025
Source:TradingView.Com (click to enlarge)
Key Levels to Consider:
Support
- 107.00
- 106.13
- 105.63
Resistance
- 108.00
- 108.49
- 109.52
The Weekly Bottom Line: Deadline 2.0
Canadian Highlights
- President Trump signalled that broad-based tariffs on Canadian exports will come into effect on March 4th. The wait is on to see if they are indeed implemented.
- If enacted, these tariffs would hit just when the economy is on the mend. Canada’s economy advanced at a healthy 2.6% annualized rate in Q4, bolstered by consumer spending.
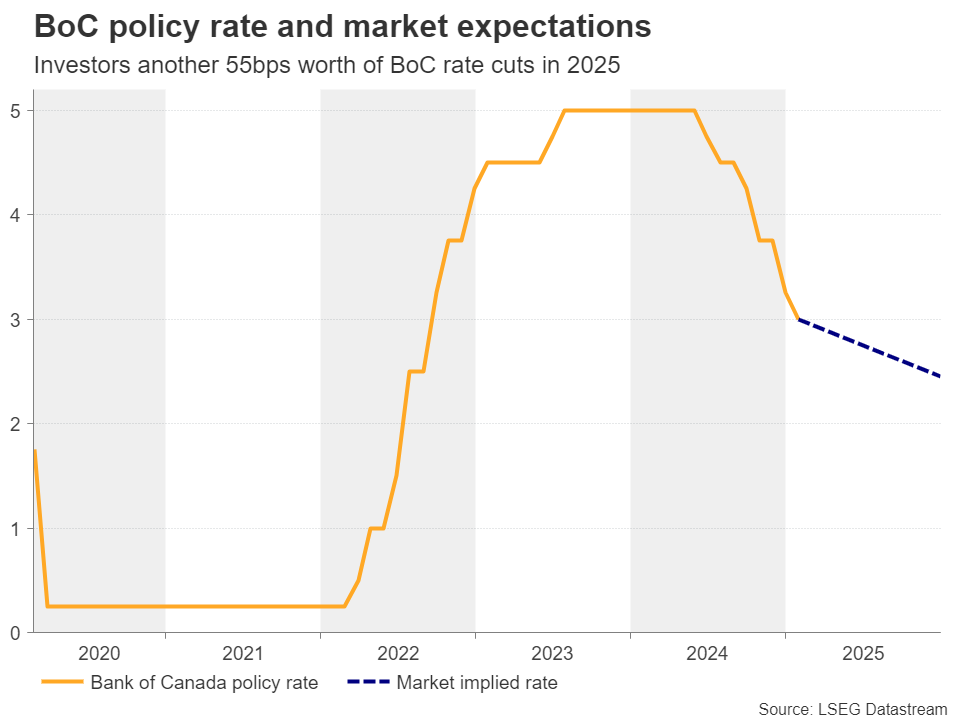
- Although markets currently judge it as a near 50/50 proposition, we think the Bank of Canada will cut their policy rate on March 12th.
U.S. Highlights
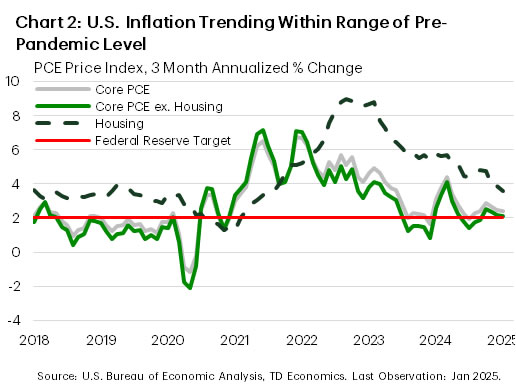
- The Fed’s preferred inflation metric, core PCE, rose 2.6% year-on-year in January, in-line with expectations and continuing to converge with the Fed’s 2% target.
- The Conference Board’s Consumer Confidence Index showed a material decline in February, as tariffs weighed on sentiment and boosted inflation expectations.
- The President announced an additional 10% tariff on China set to take effect on March 4th, in concert with the previously announced 25% tariffs against Canada and Mexico.
Canada – Deadline 2.0
Markets were in a dour mood this week, directly related to President Trump’s repeated threat of broad-based tariffs to begin next Tuesday, March 4th. There was a bit of “will he, won’t he”, with respect to these threats. The signal from the Oval Office on Monday appeared to indicate that they’ll proceed. This message got muddied on Wednesday during a U.S. cabinet meeting, where it seemed as though they could be punted for another month. Unfortunately, Canadians got concerning clarification from President Trump on Thursday that they are indeed set to be enacted next week. The Canadian dollar was down over one cent USD in the week (as of writing). Meanwhile, the Canadian 10-year yield was lower by around 20 bps to 3%.
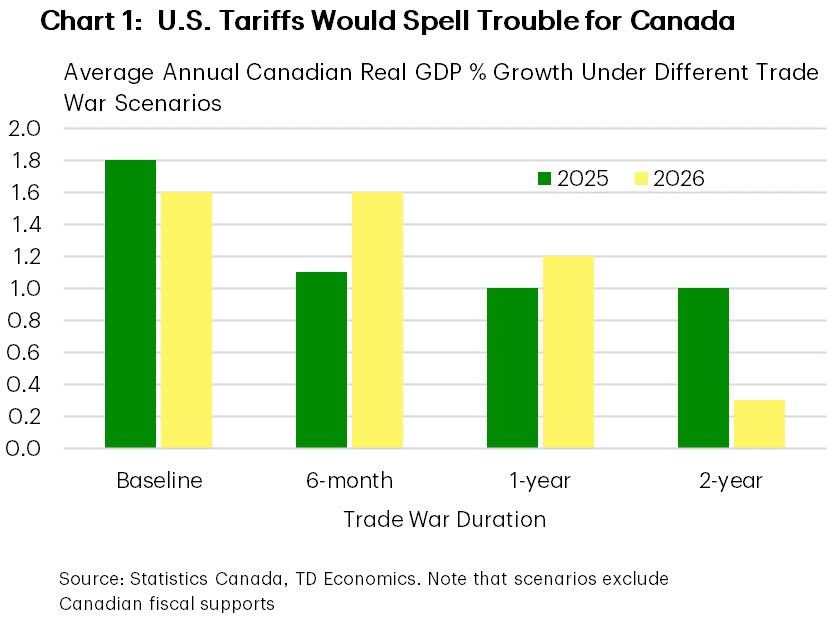
Of course, we’ve done this dance before. Just a few weeks ago, U.S. tariffs were paused at the 11th hour after negotiations between President Trump and Prime Minister Trudeau. So, it remains to be seen if March 4th will mark the beginning of a harmful trade war, or if cooler heads will prevail again. When forecasting the potential damage to the Canadian economy, the one unknown is how long punitive 25% tariffs would be in effect. Our latest Q&A presents economic growth outcomes that could unfold depending on how long U.S. tariffs (and reciprocal ones from Canada), are in place. A two-year trade war would hamper growth well into 2026, whereas as a six-month duration could see growth rebounding smartly next year, although both scenarios would see deteriorating conditions in 2025 (Chart 1).
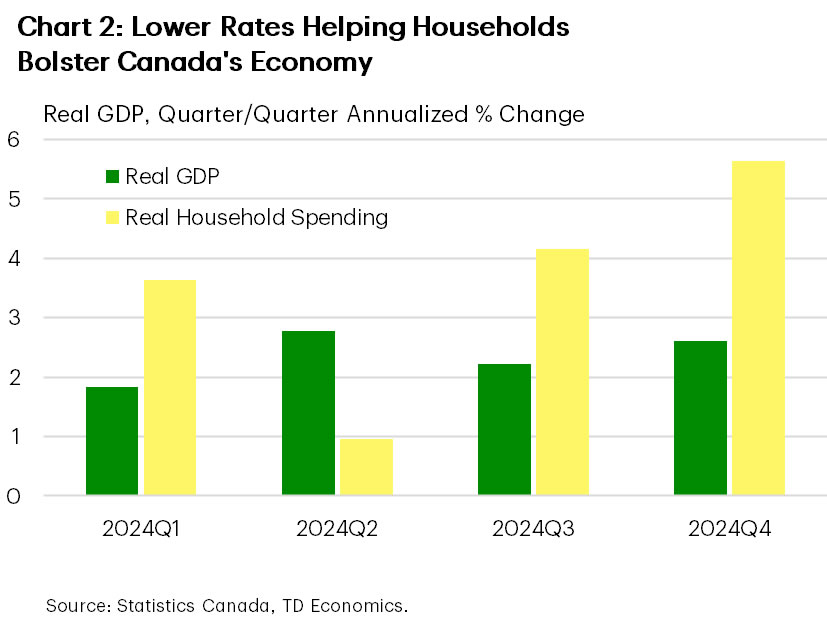
Although there’s never an ideal time for a trade war, high tariffs would thump the Canadian economy just as it’s on the mend. Indeed, job growth has been robust for three straight months in the Labour Force Survey (LFS), and even this week’s payroll jobs report (which had been lagging it’s LFS counterpart) showed an increase in employment in December. What’s more, investment intentions in the capital and repair expenditures survey pointed to an above-trend 6% gain in non-residential spending by Canadian companies and governments in 2025 (see commentary). However, this result comes with the huge caveat that it only partially captured tariff threats, which really ramped up after the survey’s cut-off date. And, in the marquee release of the week, Canadian real GDP jumped 2.6% annualized in the fourth quarter. Details of the report were favourable as well, with lower interest rates, government stimulus measures, and decent income growth propelling a huge gain in consumer spending (Chart 2).
In the wake of the robust GDP data, markets pared back their expectations of a rate cut by the Bank of Canada on March 12th. However, markets are still placing about a 50% chance that a cut will take place. We think the Bank will cut their policy rate next month, even with what is a solidly improving current economic backdrop. In our view, it’s prudent from a risk-management perspective to insulate against downside growth risks by cutting the policy rate again. Of course, if a Canada-U.S. trade war does start next week, this would virtually lock in another cut next month. And now, we wait.
U.S. – Angst Builds with Tariff Threats
The final week of February included an update on the health of the American consumer, and the Federal Reserve’s preferred inflation metric. Meanwhile, financial markets remained cautious as the prospect for broad-based tariffs to go into effect next week against the nation’s three largest trading partners kept sentiment subdued. As of the time of writing, the S&P 500 was down 2.3% on the week, while the 10-year Treasury yield fell nearly 20 basis-points to 4.24%.
The impact of tariff threats on consumer confidence has partially contributed to the negative sentiment in financial markets over the past week. Last Friday, the University of Michigan consumer sentiment index fell to its lowest level in 15 months, and this was followed by the Conference Board Consumer Confidence Index dropping sharply this week to an eight-month low. The Conference Board’s survey also noted that mentions of trade and tariffs had risen to a level last seen in 2019. While we saw real personal consumption expenditures fall 0.5% month-on-month in January in data released this week, severe weather undoubtedly played a role.
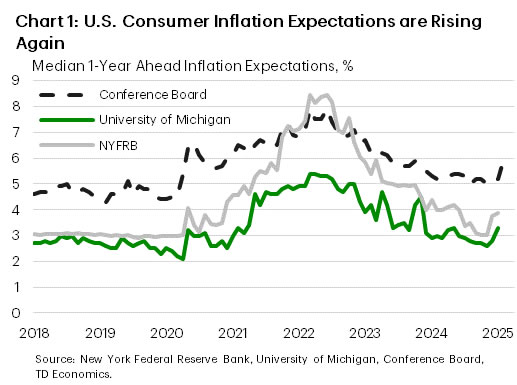
At the same time, consumer surveys have also begun to show signs of rising inflation expectations (Chart 1), which could present a risk for the Federal Reserve’s mission to return inflation to their 2% target. Core PCE inflation, the Fed’s preferred metric, rose 2.6% year-on-year in January. Looking at the three-month annualized percentage change, momentum has continued to trend favorably (Chart 2) with both the housing and excluding housing subcategories within range of pre-pandemic levels. However, these metrics remain slightly elevated on aggregate, which supports the Federal Reserve’s holding pattern. This, combined with rising inflation expectations, is also likely why several of the Federal Reserve officials we heard from this week favored a patient approach to future monetary policy adjustments, particularly amid elevated uncertainty. Market pricing has the Fed returning to rate cuts in June, with one additional rate cut before year end – in line with the median FOMC official projection from December.
Looking ahead to next week, there will be plenty to keep markets on their toes. First up will be the potential for the 25% tariffs on Canada and Mexico, plus the new additional 10% tariff on China announced this week, to be implemented next Tuesday. If an eleventh-hour resolution cannot be achieved again, then significant trade disruptions would likely follow. President Trump will also be delivering his State of the Union address on Tuesday, which may include new policy considerations. Lastly, we’ll round out the week with the employment report for February on Friday, which will be the last employment report released prior to the Fed’s next meeting in mid-March. Consensus expectations currently call for 158k new jobs to have been created this month, which would likely be viewed positively by the Federal Reserve. All-in-all, there will be plenty of information released next week to guide expectations in the months ahead.
Weekly Economic & Financial Commentary: Fed Speak Points to Extended Pause Amid Rising Uncertainty
Summary
United States: Consumer Hibernation
- After a solid finish to 2024, the U.S. consumer rested up in January. Spending fell 0.2% despite solid income growth. The Fed's preferred measure of inflation showed price growth easing a bit further on trend, but confidence data out this week show consumers anxious about future inflation as talk of higher tariffs continues to dominate headlines.
- Next week: ISM Manufacturing & Services (Mon. & Wed.), Trade Balance (Thu.), Employment (Fri.)
International: Global GDP Growth Data Galore
- This week saw the release of a variety of GDP growth data from global economies. Canada reported very solid fourth quarter GDP figures, in our view, affirming our forecast for a Bank of Canada rate pause in March. India's economy improved in the fourth quarter, Sweden's economy grew by more than expected and Switzerland's economy grew generally as expected.
- Next week: China PMIs (Sat.), European Central Bank Policy Rate (Thu.), Mexico CPI (Fri.)
Interest Rate Watch: Fed Speak Points to Extended Pause Amid Rising Uncertainty
- The Federal Reserve communication channel was full this week. Generally, officials expressed the desire to hold rates steady on account of stalled inflation and increased uncertainty. All told, recent Fed speak supports our view that mounting upside inflation risks will keep the FOMC on hold over the next several meetings.
Credit Market Insights: Student Loans Showing Signs of Borrower Struggle
- Student loan debt continued to rise through the fourth quarter, according to the New York Fed’s Q4-2024 Household Debt and Credit Report released earlier this month. Evidence is now emerging that delinquent student loan payments are starting to weigh on some consumers' credit reports.
Topic of the Week: How Will Shrinking the Federal Workforce Impact the Labor Market?
- Amid the flurry of actions taken by the Trump administration in its first month in office has been an effort to shrink the federal workforce. To what extent will these efforts weigh on payroll growth in the months ahead?
North American Labour Markets Take Center Stage as Tariff Concerns Loom
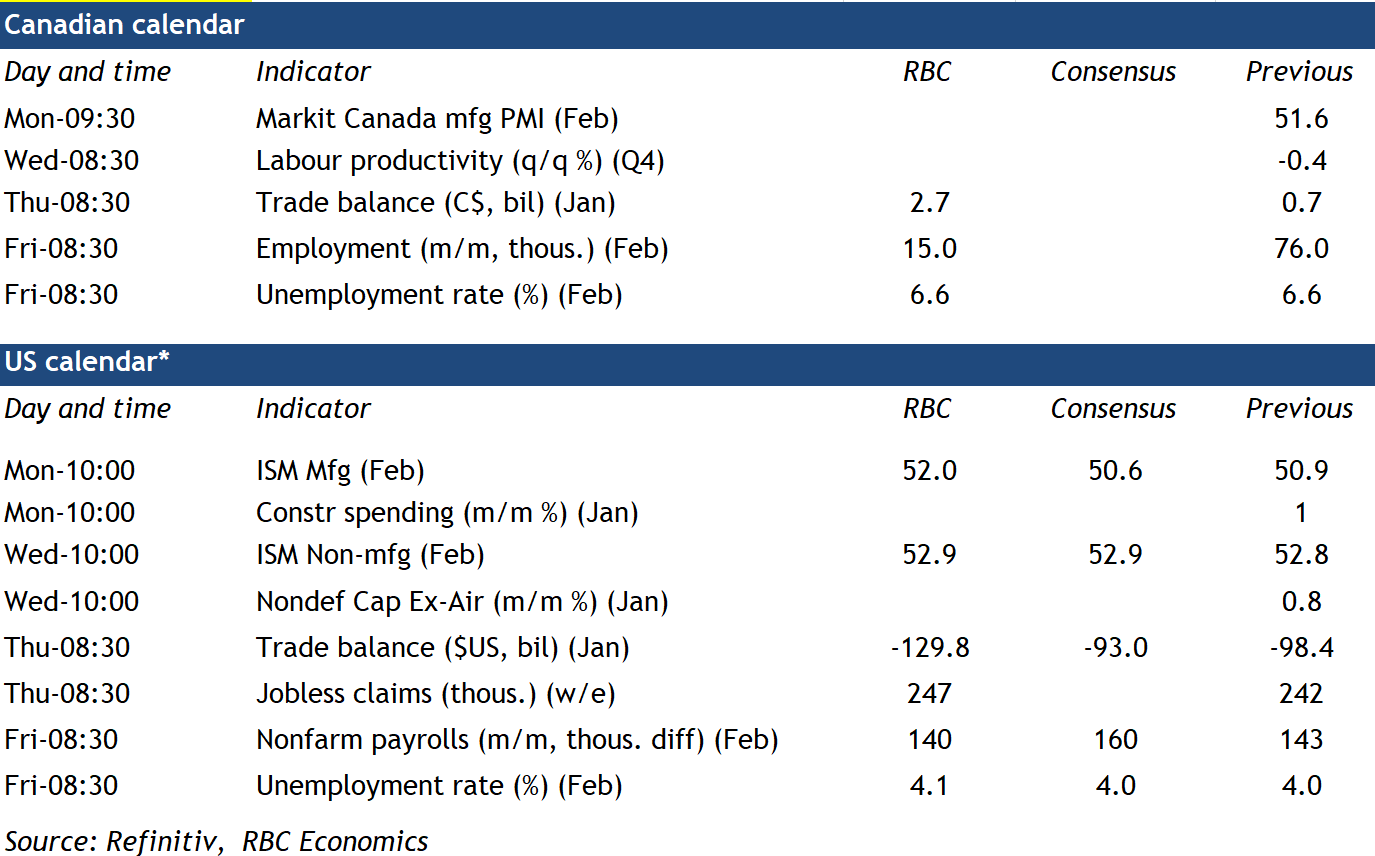
The week ahead brings important labour market reports from both sides of the border. For Canada, it will be the final major data release before the Bank of Canada’s March 12 decision on interest rates.
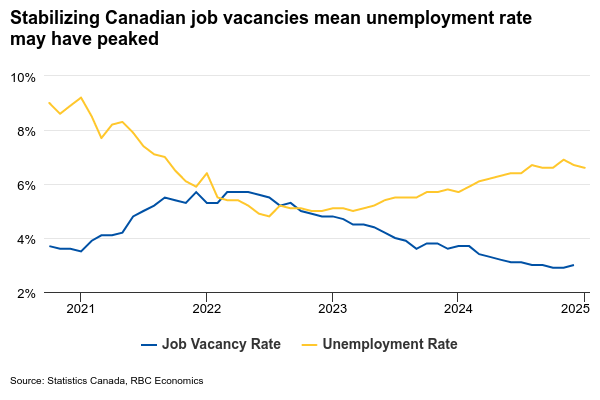
We expect 15,000 jobs were added in February, a deceleration from January’s robust 76,000 gain. This modest growth should keep the unemployment rate steady at 6.6%, unchanged from January.
The Canadian labour market has shown improvement in early 2025 with January posting solid employment gains and a second consecutive monthly drop in the unemployment rate after hitting 6.9% in November.
But, while recent data have been more encouraging, the unemployment rate remains nearly 1 percentage point higher than a year ago. Uncertainty tied to potential U.S. tariffs rose significantly in late January and early February with both business and consumer confidence measures declining.
Tariff uncertainty alone (without actual tariff hikes implemented) won’t be enough to fuel layoffs, but it could slow hiring. Job postings on indeed.com edged lower in February after rising in December and January. And, not all estimates of recent job growth in Canada have been as strong as the labour force survey numbers. Separately reported job counts from Canada’s Survey of Employment, Payrolls and Hours have been lower in recent months, including an outright decline (-5,000) in December, excluding a bounce-back in the transportation sector tied to the end of the Canada Post strike.
In U.S., however, labour market conditions are firmer. For February, payroll employment likely rose by 140,000, little changed from last month. We expect the unemployment rate to drift higher from 4% to 4.1%. The U.S. labour market remains strong with February’s forecast. Robust consumer spending also continued to support growth. We continue to expect the U.S. Federal Reserve will keep rates unchanged at 4.25% to 4.5% throughout 2025.
Week ahead data watch
We expect the Canadian trade balance to widen again in January with exports that grew 2% and imports declining 0.8%. Oil prices were up almost 8% during the month, pushing the energy trade balance higher.
U.S. trade deficits likely widened in January, to $129.8 billion. According to the advance economic indicators report, the goods deficits grew by $31.2 billion month-over-month, driven by higher imports (+11.9%) that significantly outpaced the 2% growth in exports.
Trump 2.0 & Rising Restrictive Global Trade Policy
Summary
Over the past 15 years, trade policies implemented by countries around the world have led to economic fragmentation and deglobalization. Tariffs come to mind as the instrument disrupting trade integration the most; however, evidence suggests changes to tariff policies may have actually supported global trade cohesion, at least since the Global Financial Crisis in 2008-2009. Regardless, Trump 2.0 trade policy proposals could flip that narrative in a significant way, leading to a more deglobalized world and trade fragmentation. But while the impact on the real economy could be severe, global financial markets seem to be more comfortable digesting tariff headlines and more harmful trade policies.
Trump 2.0 & Rising Restrictive Global Trade Policy
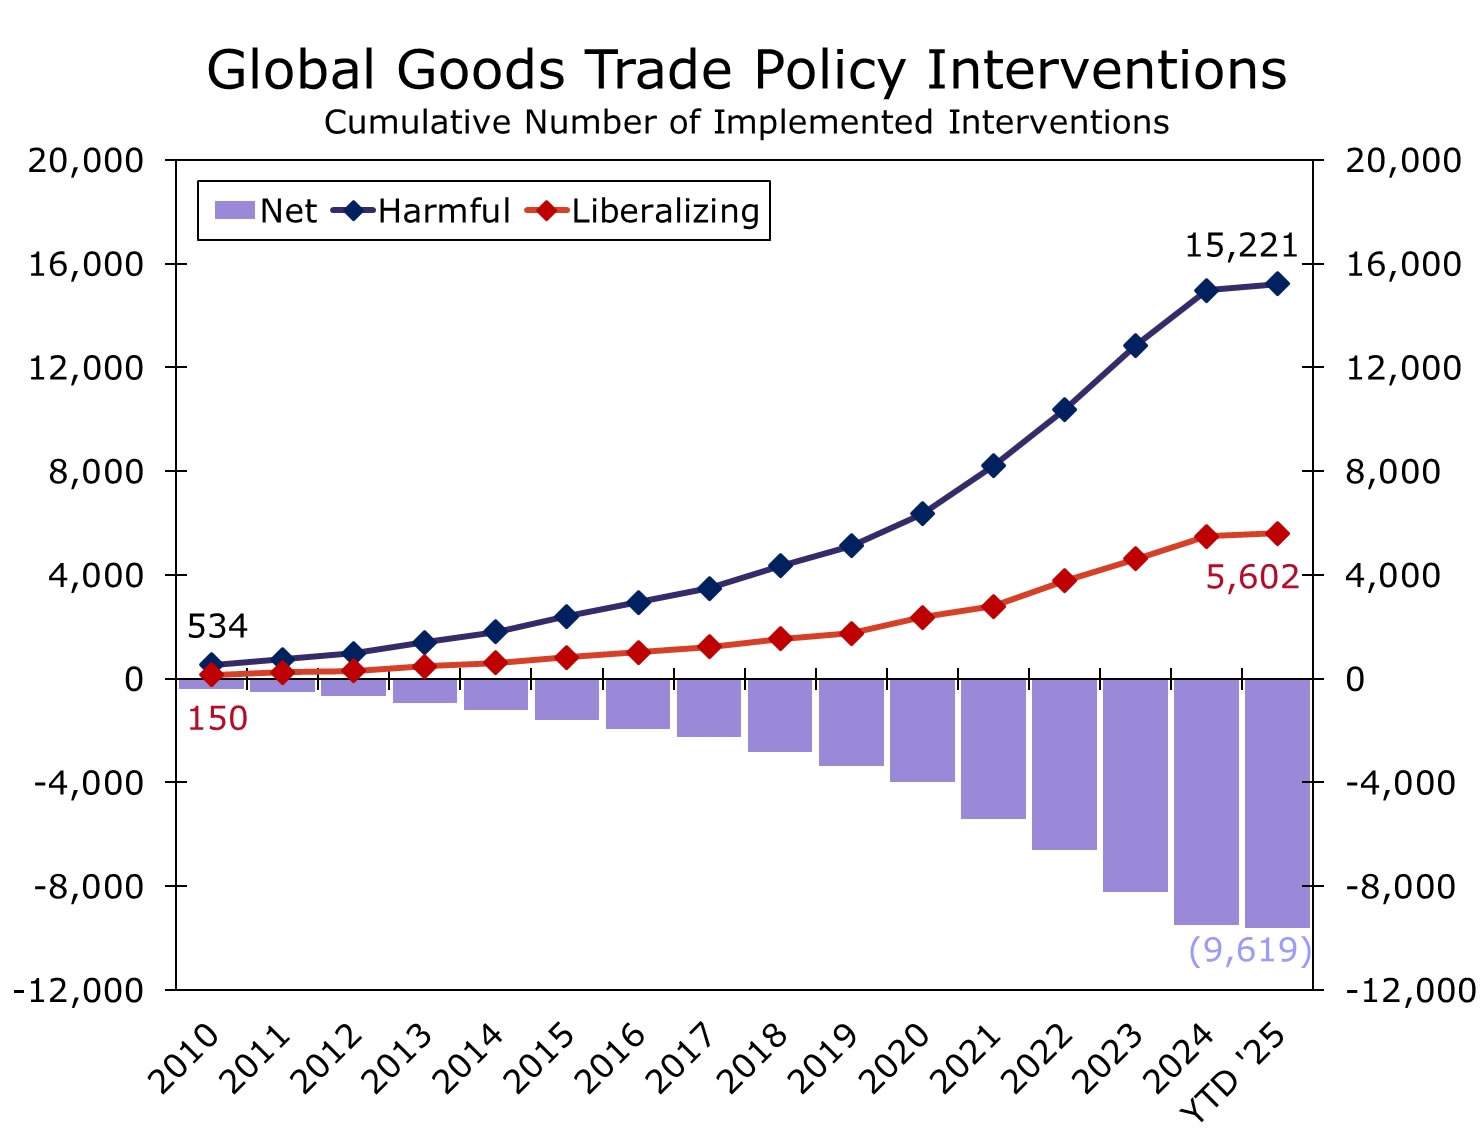
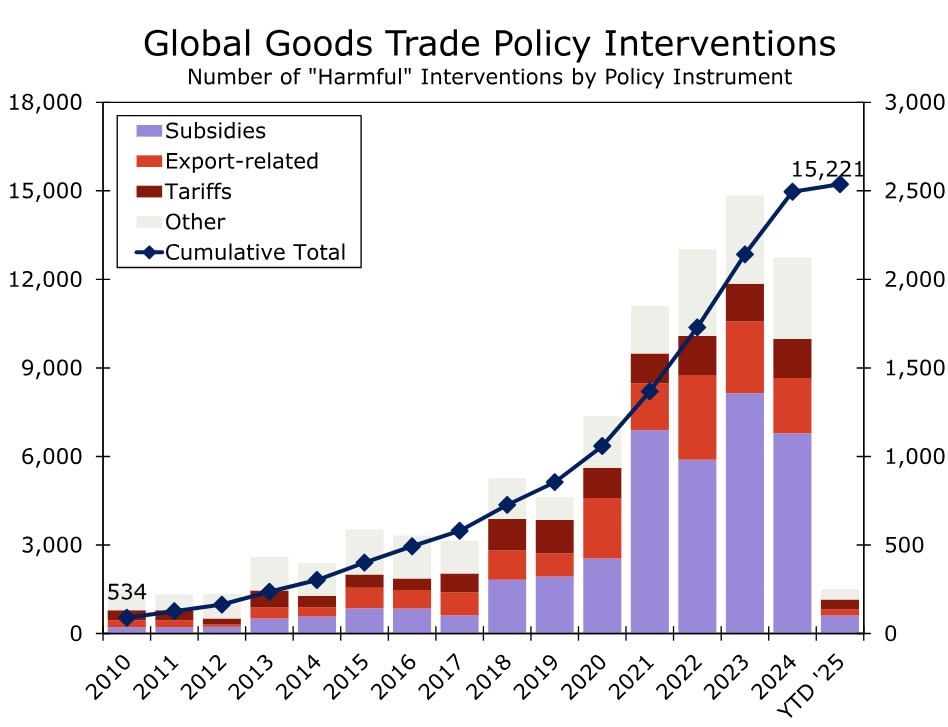
We have noted in multiple previous reports how the global economy is in a state of deglobalization. Meaning, the global economy is less interconnected today than it was 15 or so years ago. Reduced global inter-connectivity and a fragmenting global economy is arguably one of the most interesting long-term trends and seems to be a topic that is continuously unfolding. While the Global Financial Crisis of 2008-2009 (GFC) started the second era of deglobalization, the rise in trade protectionism around the world post-GFC exacerbated this deglobalization trend. The years immediately following the GFC saw a rise in protectionist trade policies; however, inward-looking trade policies picked up pace in 2016 with Brexit and the policies pursued by the first Trump administration. Protectionist trade policies gathered momentum over the course of Trump 1.0 and COVID, but also as a result of nearshoring and attempts to remove China from global supply chains, as well as military conflicts in Europe and the Middle East. According to Global Trade Alert, governments around the world responded to each of these developments by implementing more inward-looking and “harmful” trade policies (i.e., policies that reduce global trade cooperation) rather than policies that liberalize trade (i.e., more integrative global trade policies). In fact, over the past 15 years, harmful trade policy interventions have significantly outpaced interventions to liberalize trade. Since 2010, authorities around the world have imposed over 15,200 cumulative harmful trade restrictions as opposed to just over 5,600 cumulative policies designed to promote cross-border trade (Figure 1). Through the early months of 2025, data suggest that global trade policy is currently the most restrictive and protectionist it has been in the post-Global Financial Crisis era as harmful trade policies continue to be implemented at a more rapid pace relative to free trade types of policies.
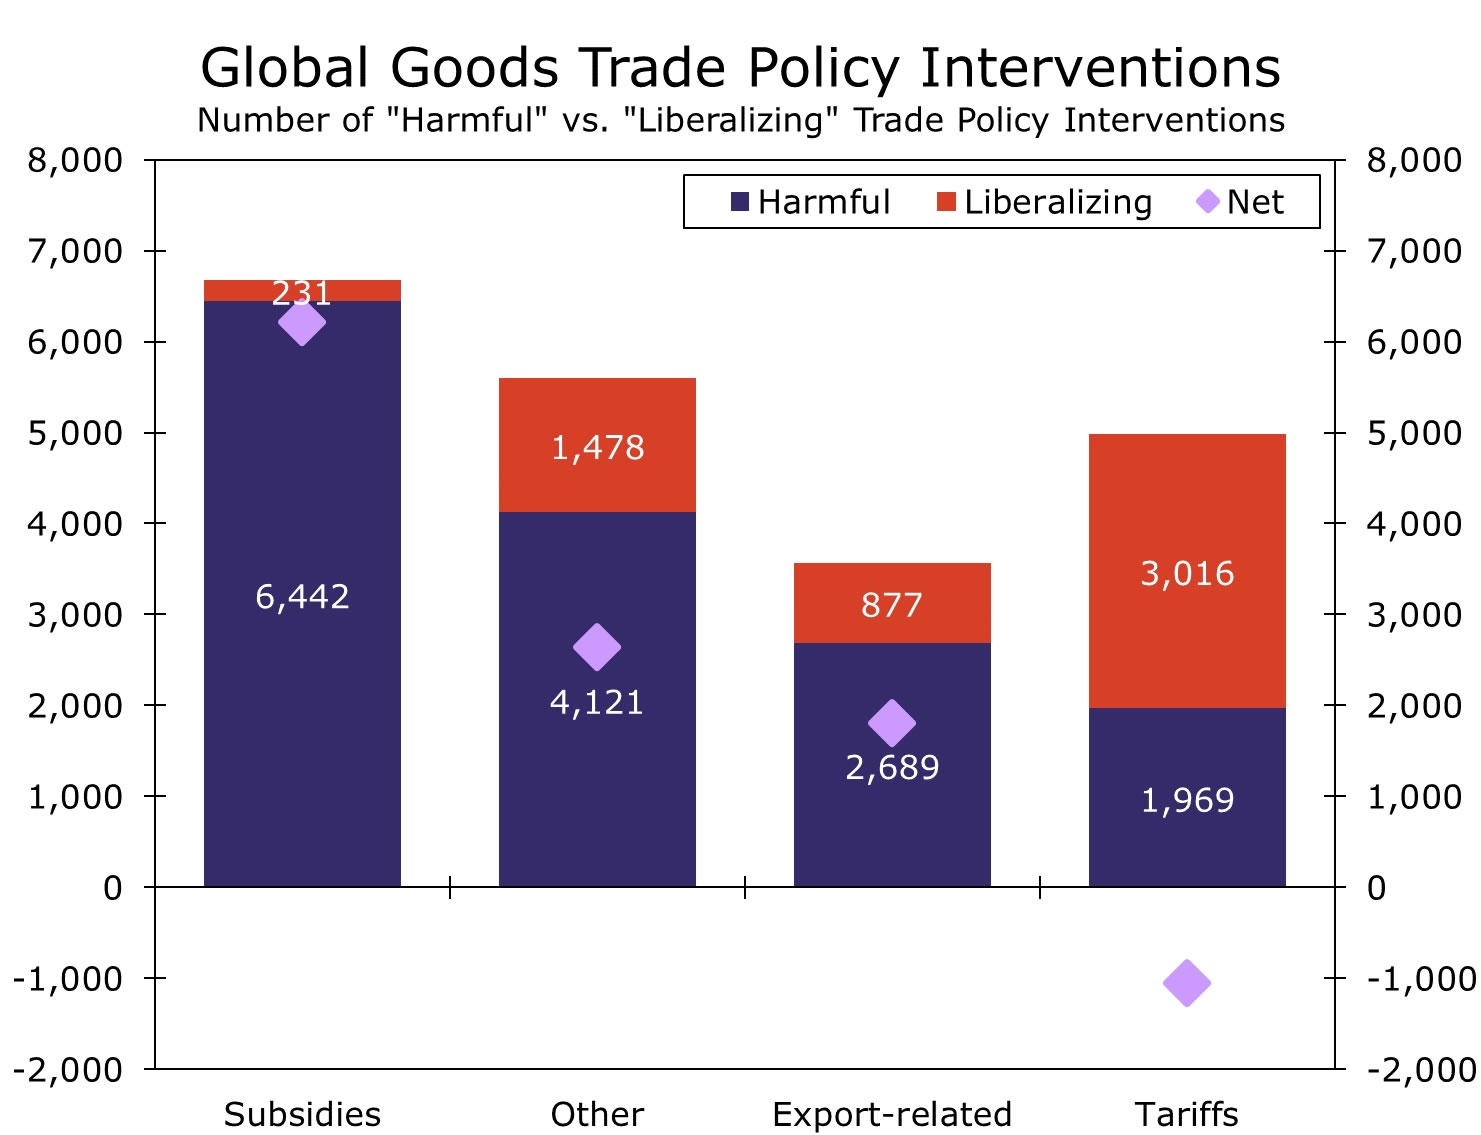
As far as the instruments used to implement more restrictive trade policies, tariffs typically come top of mind, especially when trade policy is discussed in the context of the Trump administration. And while tariffs have become a more widely used tool for protectionism, government subsidies, and to a lesser extent export restrictions, have been used more frequently to restrict trade cooperation, not tariffs (Figure 2). In fact, an argument exists that tariff policy changes, at a global level and on balance, have actually been supportive of global trade integration since the Global Financial Crisis. To that point, governments have offered more subsidies, while export restrictions and other trade policies—such as enhanced border inspections—have tightened. Tariff policy, as counterintuitive as this may sound, has been the exception. Over the past 15 years, governments around the world have opted to remove more tariff policies than impose new tariff restrictions. Global Trade Alert data indicate that governments have imposed ~2,000 tariff-related instruments that hurt global trade. At the same time, authorities have adjusted over 3,000 tariff policies to liberalize trade and promote closer trade ties (Figure 3). Which means, on a net basis, global tariff policy has eased since the GFC and evidence would suggest changes to tariff policy have been a re-globalization force.
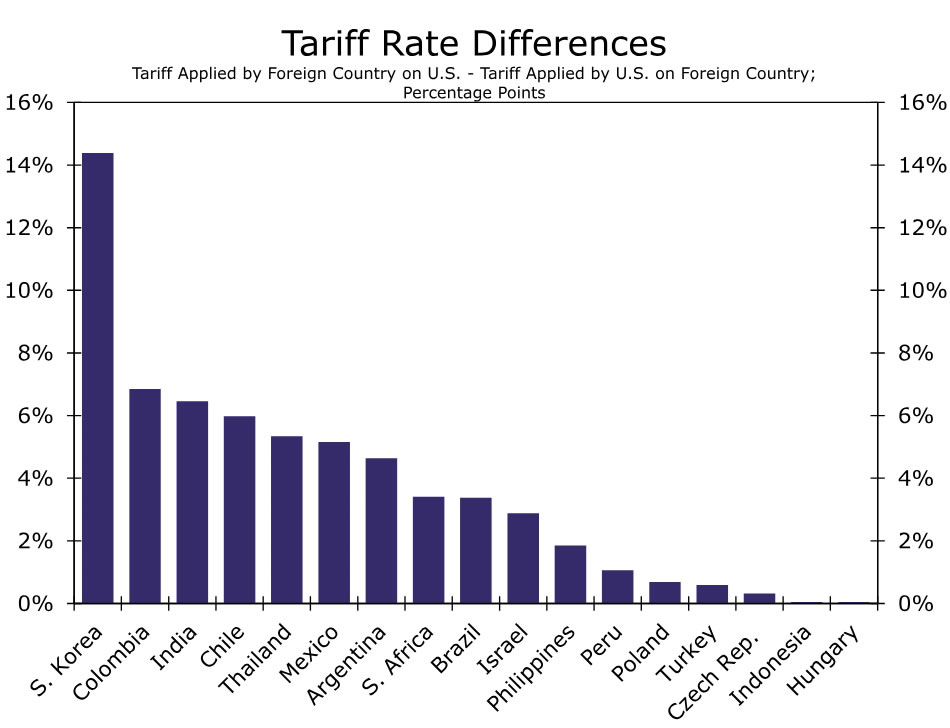
With that said, the Trump 2.0 administration has proposed very meaningful changes to U.S. trade and tariff policy, and not the kind of adjustments that would promote global trade cooperation. Trump has already implemented new tariffs, and rhetoric from the administration would suggest additional tariffs are forthcoming. Just this week, President Trump communicated a possible 25% tariff on goods from the European Union, reiterated his commitment to impose a 25% tariff on Canada and Mexico, and also raise the tariff rate imposed on China by an additional 10%. Trump has also communicated that reciprocal tariffs on select U.S. trading partners may be imposed in April, which would affect a wide range of countries across regions and countries not necessarily in the tariff bullseye during Trump's first term (Figure 4). New tariffs on Canada, Mexico and China combined with reciprocal tariffs are a deglobalization force that will, by design, reduce trade connectivity. Taking Trump's proposed tariffs a step further, retaliation from any country—or all countries—would also be considered policy interventions that would contribute to further trade fragmentation and deglobalization. In our view, China is likely to retaliate with matching tariffs similar to the reaction put in motion during the original trade war. Canada and Mexico have also tentatively signaled a willingness to impose retaliatory tariffs, and the EU would also likely respond with targeted or matching tariffs of their own. Over the past 15 years, tariff policy changes may have been a net positive for global trade integration, and while time will tell how the new trade war plays out, the trajectory of trade rhetoric suggests tariff policy will be a net negative for global trade cooperation.
We noted in the same prior reports how deglobalization is a negative development for global economic growth. In a scenario where global trade fragmentation fully materializes, the global economy could lose over 6% of overall output purely from diminished trade flows. The total hit to global growth would likely be more severe as the cross-border flow of investment and resources would compound the impact. But as the old saying goes, what happens in the real economy does not necessarily translate to what happens in financial markets. Real global economic growth should be disrupted from the imposition of U.S. tariffs and likely retaliation. To that point, we forecast below-trend global GDP growth of 2.7% as harmful trade policy interventions pick up pace. However, despite the contentious direction of global trade policy, we believe financial markets have become more comfortable digesting tariff headlines and future deglobalization-style trade policy changes. In our February International Economic Outlook, we expressed our view that market participants may be experiencing a degree of tariff fatigue. That is, despite trade policy uncertainty spiking, financial markets are worn out from being warned about tariffs. “Been there, done that,” financial markets might be saying, as gauges of volatility across FX, equities and rates continue to grind lower. Investors may also feel tariffs will be avoided, given Trump's transactional approach to policy intervention and his search for the next “deal” that benefits America. We adjusted our long-term view on the U.S. dollar to reflect tariff fatigue, and while we still believe the dollar can strengthen against most foreign currencies, the peak is now likely to be lower as safe-haven support is somewhat removed. Time will tell on whether markets are indeed apathetic toward tariffs, or if investors are too complacent, but for now we believe market participants lean toward tariff apathy.
Week Ahead – NFP and ECB to Steal the Show
- NFP take center stage amid DOGE layoffs.
- ECB decides monetary policy after CPI data.
- Canada jobs report and RBA minutes also on tap.
Will DOGE layoffs weigh on NFP?
The dollar traded on the back foot against some key major counterparts during the first half of the week, as investors have turned more dovish than the Fed itself for the first time since the December FOMC decision. That said, renewed tariff rhetoric by US President Trump encouraged a strong rebound on Thursday.
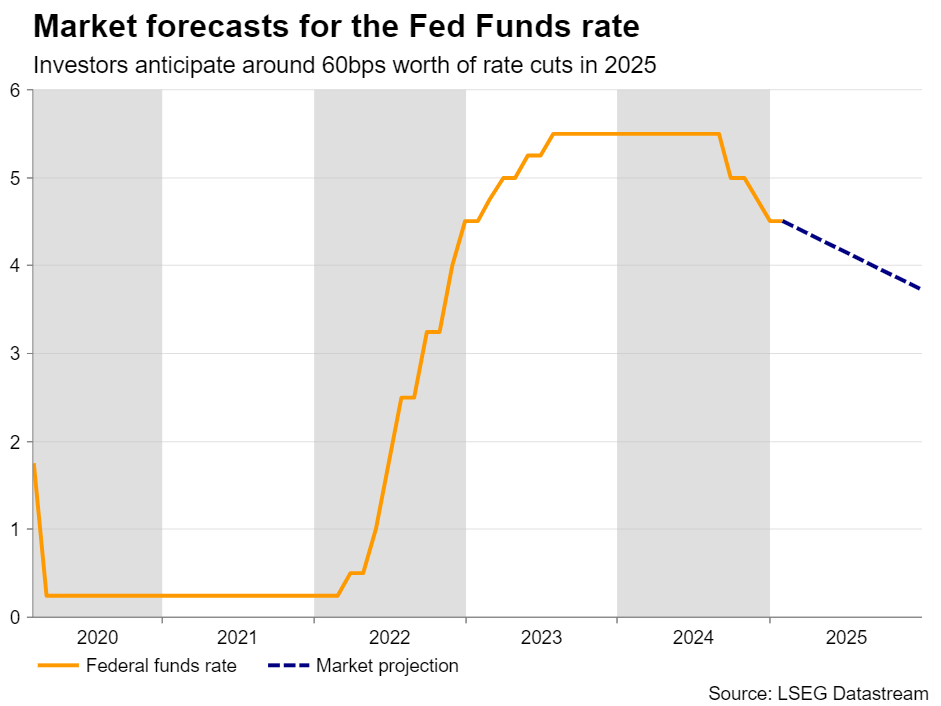
Following the weakness in last week’s preliminary US S&P Global PMIs for February, as well as the drop in the University of Michigan consumer sentiment index for the month, investors are now penciling in around 60bps worth of reductions this year. This is more basis points worth of reductions than the 50 projected in the December dot plot.
However, with US President Trump ramping up his tariff threats against the US’s main trading partners, such as China, Canada and Mexico, it is hard to envision a clear road map as the imposition of tariffs is a major upside risk to already sticky inflation. After all, most FOMC officials who have expressed their view lately seem to be favoring a wait-and-see approach.
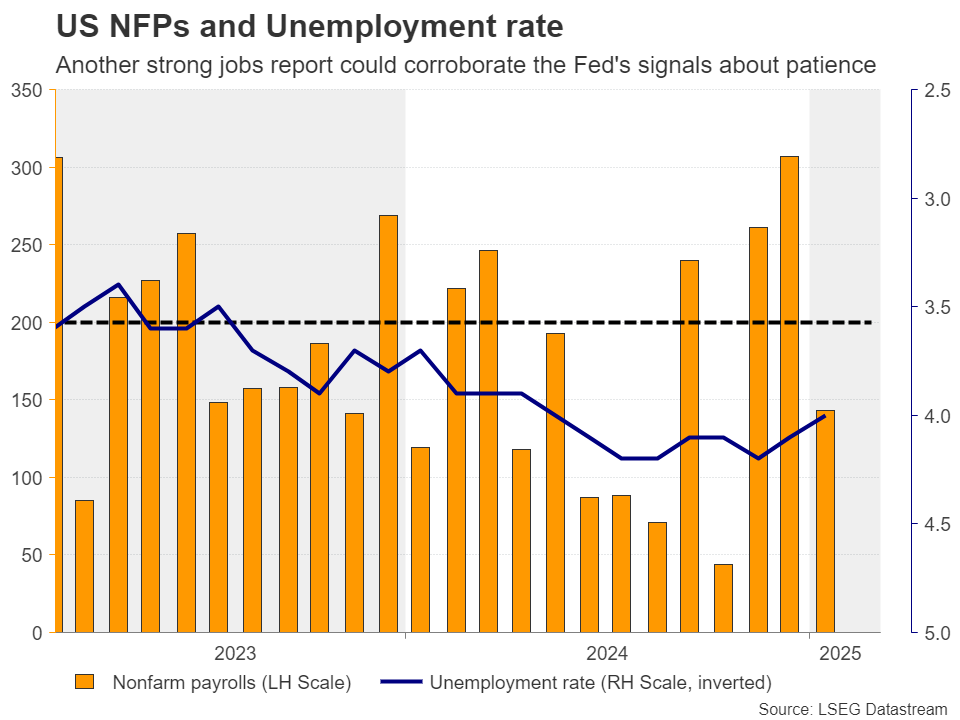
With all that in mind, apart from any new tariff headlines next week, dollar traders are likely to also lock their gaze at the ISM manufacturing and non-manufacturing PMIs on Monday and Wednesday, respectively, but the highlight is likely to be Friday’s NFP data. The January report revealed lower-than-expected jobs growth, but this was due to temporary factors, such as the wildfires in California and the cold weather across the country. Overall, the decline in the unemployment rate, the upward revision in the December print, and the sticker-than-expected wage growth suggest that the labor market remains strong.
As Elon Musk’s Department of Government Efficiency (DOGE) continues to cut federal jobs, February’s NFP print may also come in on the soft side. However, the subcomponents of the report include government payrolls and any weakness there would not come as a surprise. Should the other sectors point to a reacceleration in employment growth, it could be an indication that the private sector was strong enough to absorb the employees who lost their jobs and thus, the dollar could benefit.
Investors may start betting on fewer rate cuts again for 2025, especially if the ISM prints earlier in the week do not corroborate the weakness in business activity revealed by the S&P Global prints. The opposite may be true if any potential weakness in the labor market is more widespread, rather than concentrated in government jobs only.
Will the ECB maintain data dependency?
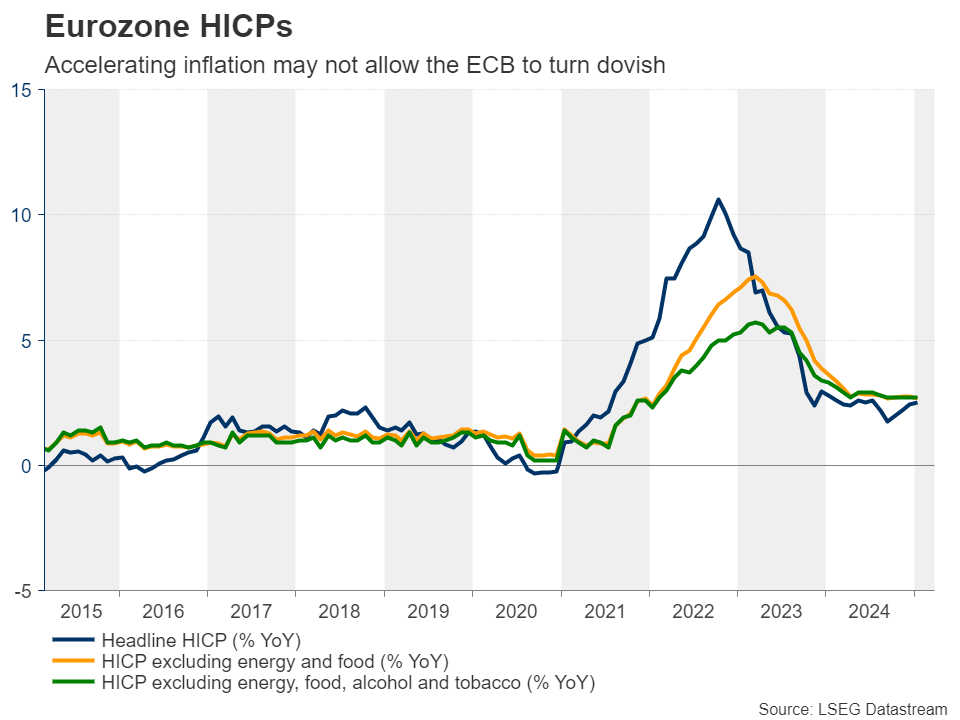
In the Eurozone, the preliminary CPI inflation numbers will be released on Monday, while on Thursday, the ECB is scheduled to hold its monetary policy decision.
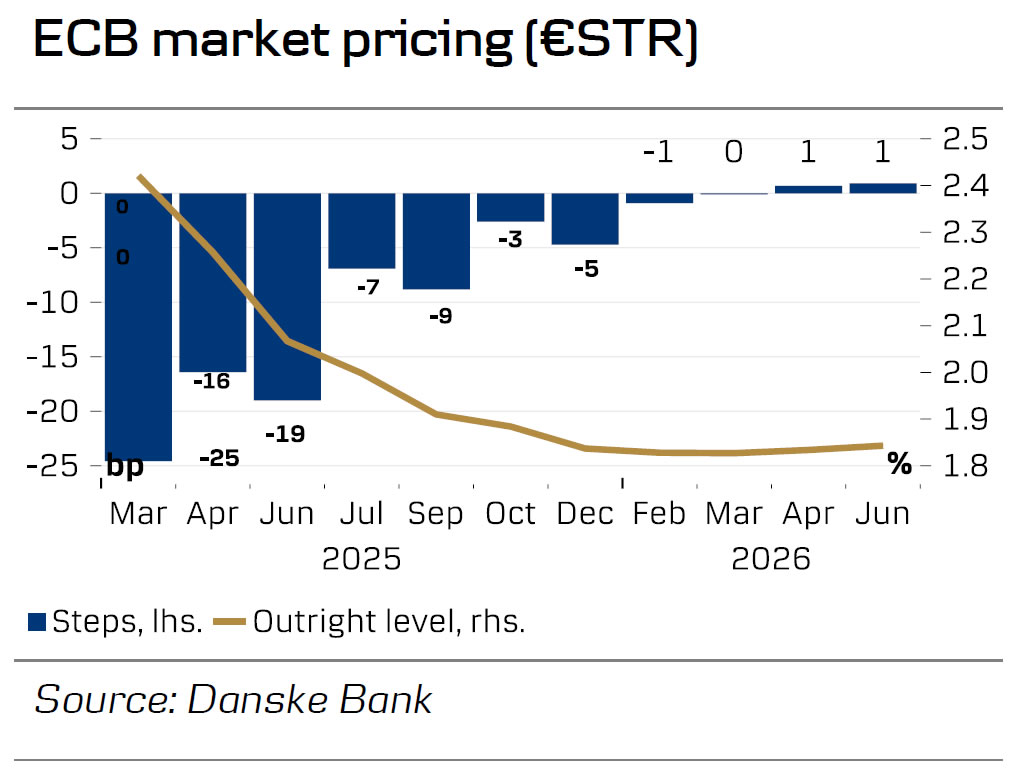
At its latest gathering, the ECB cut interest rates by 25bps but gave no clear signals about the future pace of easing, allowing investors to continue penciling in around 88bps worth of additional reductions by the end of the year.
Another month of accelerating inflation and another guidance that points to a meeting-by-meeting approach could help the euro move higher, even if the ECB cuts rates by another 25bps. After all, this is already priced in.
Having said all that though, any ECB related gains are likely to remain limited as tariff uncertainty is still facing the European Union. Just this Wednesday, US President Trump said that he is planning to impose 25% duties on European cars and other goods. Delays in the efforts by German conservatives to form a coalition after their election victory could also weigh on the common currency, while attention could also fall on the special summit on March 6, where European leaders will meet to discuss additional support for Ukraine and security guaranties.
Canada’s employment report also in focus
At the time when the US employment data are scheduled to be released, Canada will publish its own jobs numbers. Following the better-than-expected jobs report for January and the stickier-than-expected core CPI numbers for the same month, traders are assigning a 50% chance that the BoC will take the sidelines at its upcoming gathering on March 12.
Another strong employment report could reinforce investors’ bets on Canadian policymakers taking the sidelines, but Trump’s renewed tariff threats toward Canada are unlikely to allow loonie traders to celebrate for long. After all, despite the loonie’s strength in the aftermath of the tariff delay Trump announced at the beginning of the month, the renewed threats this week have resulted in new setbacks, with the currency turning south again.
Aussie traders await RBA minutes and GDP data
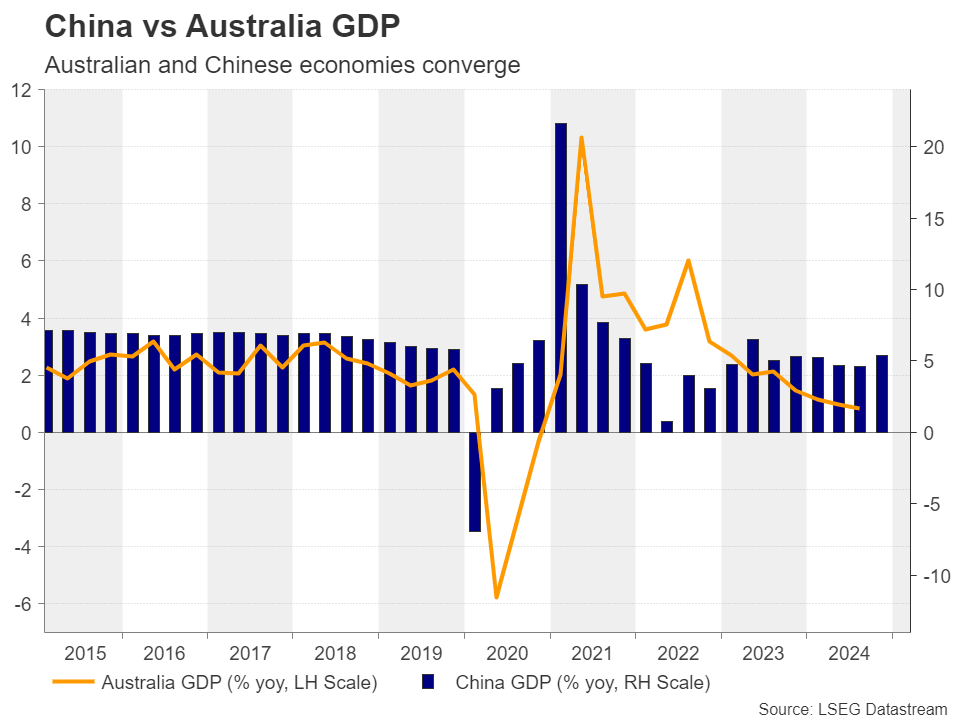
Aussie traders will also have to digest a series of data releases. On Tuesday, during the Asian session, the RBA will release the minutes of its latest monetary policy decision, while at the same time, the preliminary retail sales for January will be published. On Wednesday, the GDP for Q4 will be released.
On February 18, the RBA began its own easing cycle by delivering a 25bps rate cut as was broadly anticipated. However, it sounded more cautious about future rate cuts. Combined with the fact that inflation held steady at 2.5% y/y in January, this prompted investors to assign an 80% chance of a pause at the upcoming gathering on April 1. They are also penciling in only two additional quarter-point reductions by the end of the year.
The minutes of the decision may provide additional information on how willing officials are to return to the sidelines. So should this be the minutes’ message and should the data come in strong, investors could become even more convinced about an April pause. The aussie could gain but the concerns surrounding China’s economic activity and the prospect of additional tariffs by the US on the world’s second-largest economy and Australia’s main trading partner may limit those gains.
Speaking of China, the nation’s trade data will be released on Friday.
Weekly Focus – Tariff Fears are Back on the Agenda
Signs of weaker economic growth in the US have hit a nerve in markets, and the constant political uncertainty is certainly not providing any help. US equities fell and energy prices declined with Brent now trading around USD73/bbl. - the lowest level since late December. European equities continued to outperform after the German elections despite Trump threatening the EU with broad-based 25% tariffs.
While the timing of the EU measures remains still uncertain, Trump surprised markets on Thursday by signalling that the 25% tariffs on Canada and Mexico will be enacted when the one-month delay runs out next Tuesday. Just two days earlier he said that the hikes would be delayed by another month until 2 April. Trump also upped the ante on China by announcing another 10-percentage point tariff increase, mirroring the first hike that took place earlier in February. While we have anticipated Trump gradually increasing the tariffs against China all the way to 40% by mid-2026, he has been moving ahead faster than we expected, as the average rate could reach 32% already next week.
Of course we cannot rule out another last-minute 'deal' to delay at least part of the measures, as White House sources have flagged that discussions between the parties are still 'ongoing' (see Reuters). But if fully enacted, the measures could increase the effective trade-weighted tariff rate on all US imports close to 11%, which would be the highest level since WW2. The Tax Foundation has estimated that the direct negative impact on the US economy could be around 0.3% even excluding possible tariffs on the EU and any potential countermeasures that could follow.
Bond yields have generally declined amid shaky risk sentiment. Yield spread between the US and Germany tightened, as markets are preparing for increased bond issuance and potential loosening of the German debt brake to finance growing needs for defence investments. Read our quick take in German election - A positive outcome for markets and the economy, 24 February. On the geopolitical front, we will closely follow Zelenskyi's trip to Washington to sign the preliminary mineral deal between the US and Ukraine today.
And while the 'growth-negative' aspects of Trump's policy agenda seem to take effect much faster than the 'growth-positive' ones, overall US fiscal policy stance still looks set to remain expansionary over the coming years also. This week, the US House of Representatives managed to advance a proposal for the upcoming budget reconciliation bill, which instructs for a cumulative USD 2800bn of new deficit spending over 2026-2034. Read our take in our Reading the Markets USD - Gradual easing still in sight, 25 February.
Next week, we expect the ECB to cut rates by 25bp, which is fully priced in by markets. We think the cuts will continue below current market pricing until the deposit rate reaches 1.50% next September, see our full ECB Preview - A cut is the easy part, 28 February. Euro area flash HICP for February will be released ahead of the meeting on Monday, and we forecast 2.2% y/y for headline (Jan. 2.5%) and 2.4% y/y for core (Jan. 2.7%). From the US ISM manufacturing and services, and finally the February Jobs Report are due for release. We expect NFP growth to slow down to +120k (Jan. +143k) due to negative seasonality, federal layoffs and slowing immigration constraining the growth of labour supply.
ECB Preview: A Cut is the Easy Part
- The ECB meeting next week is expected to end with yet another 25bp rate cut, bringing the policy rate to 2.5%, 150bp lower than the peak last year. While the cut decision is relatively straightforward, divergences in the ECB GC members’ assessment of the policy stance is starting to show, thus a key question will be whether the ECB will start now to soften its assessment on monetary policy restrictiveness.
- We continue to expect the three-tiered reaction function to prevail (inflation outlook, underlying inflation and strength of monetary policy transmission) and the data dependency to be reiterated. We expect the new staff projections to show higher inflation this year (2.3% y/y, December projection: 2.1% y/y) due to higher energy prices, while core inflation, more importantly, is likely to be revised down to 2.2% y/y for 2025 from its 2.3% level in December. We expect no changes to the growth forecast except a small downward revision to 1.0% y/y for 2025 due to a lower growth overhang from 2024.
- Markets are pricing another 59bp worth of rate cuts this year, following next week’s 25bp rate cut. We expect ECB to cut more than this to end with a terminal rate of 1.5% in H2 this year, albeit risks are slightly skewed to the upside.
Diverging views
The ECB GC members have started to position themselves more vocally ahead of the upcoming ECB meetings, and at least two camps have emerged. These differences do not seem significant enough to affect the policy decision of a rate cut that we and markets expect in March, but there appears to be a significant difference of opinion on the risks emerging as the easing cycle is maturing. The views may converge once more data comes in, but with the difference in views, we can expect front-end volatility to be higher than it would be otherwise.
We identify the hawkish camp, with comments from Schnabel and Wunsch, against the dovish camp, with comments from Panetta and Stournaras. The difference of views emerges from the degree of restrictiveness that we currently have. Last week, Schnabel said that she is ‘no longer sure whether it is still restrictive’, while the dovish camp was of the view from the ECB assessed in January that ‘financing conditions continue to be tight, also because monetary policy remains restrictive’. To nuance this discussion, one first has to agree on what levels of interest rate are actually restrictive, neutral and accommodative, and here we also expect to see a diverging set of views, which we discussed in our previous ECB preview ahead of the January meeting. In the end, we expect the ECB to guide that the past policy rate cuts are starting to transmit to the economy and it is warranted to assess the required level of monetary policy restrictiveness on an ongoing basis, thus using a more vague language on the exact restrictiveness level. We believe this is a compromise that both the doves and the hawks can subscribe to.
To guide for a halt or pause?
The ECB’s influential GC member Schnabel last week suggested that it may be time to discuss when to pause or halt the rate cuts that commenced in summer last year. We find this discussion too early to give a conclusion on whether there should be a pause or a halt now, but it is naturally something that eventually will come. At the current juncture, no one gains from committing to either outcome for the April meeting, and that means more volatility in front end pricing can be expected.
Staff projections to show higher headline inflation but lower core and growth
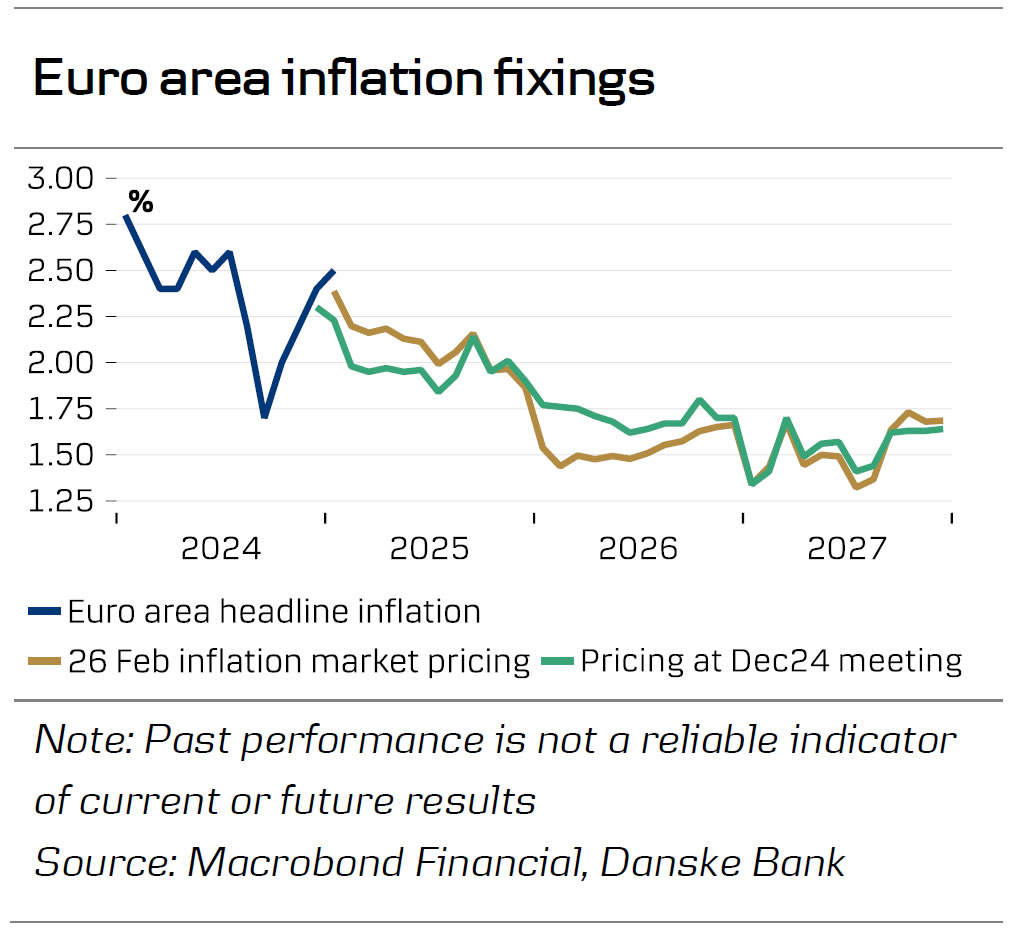
Inflation rose to 2.5% y/y in January mainly due to energy inflation. While energy prices have generally come down following talks of a potential end to the war in Ukraine, there is considerable uncertainty on the headline inflation estimate for this year due to the cut-off date for the technical assumptions which is likely to be on 12 February. At that point in time the gas price and futures were 19% higher compared to the December cut-off date, while it was about 5% higher for oil. We thus expect the staff projections to revise up the headline inflation forecast to 2.2% y/y for this year from 2.1% y/y. More importantly, we expect a small lowering of the core inflation forecast to 2.2% y/y (from 2.3%) due to lower wage growth and weaker than expected core inflation in January. The December staff projections estimated Q1 25 core inflation at 2.7% y/y, which seems unlikely as an average given the 2.7% print in January and as base effects in services inflation are set to pull it significantly lower in February and March (the February number is expected to be released on Monday 3 March).
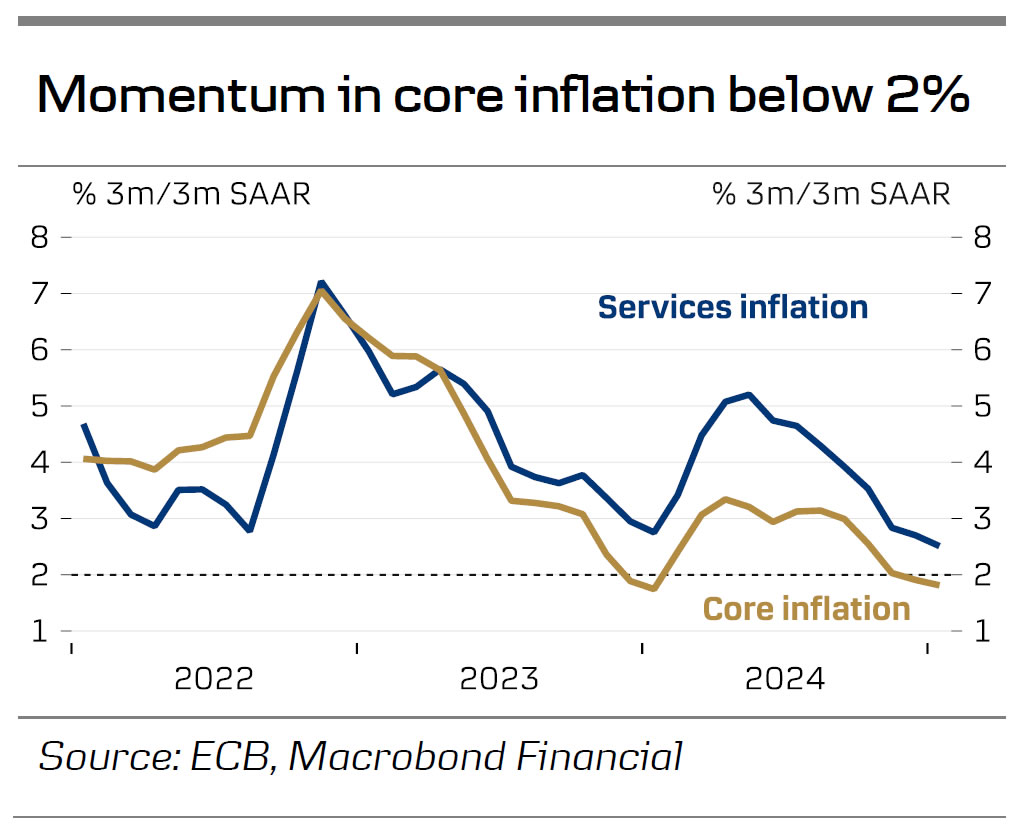
So, while the headline inflation forecast is expected to be revised up, we do not expect that to change the ECB’s view on inflation, as the cooling momentum in core inflation continues. Lagarde will likely receive questions in the case of a revision, which she can use as an opportunity to highlight the risks to the inflation profile from energy prices, but at the same time stress the falling momentum in core, anchored inflation expectations, and that inflation is expected close to target in 2026 and 2027.
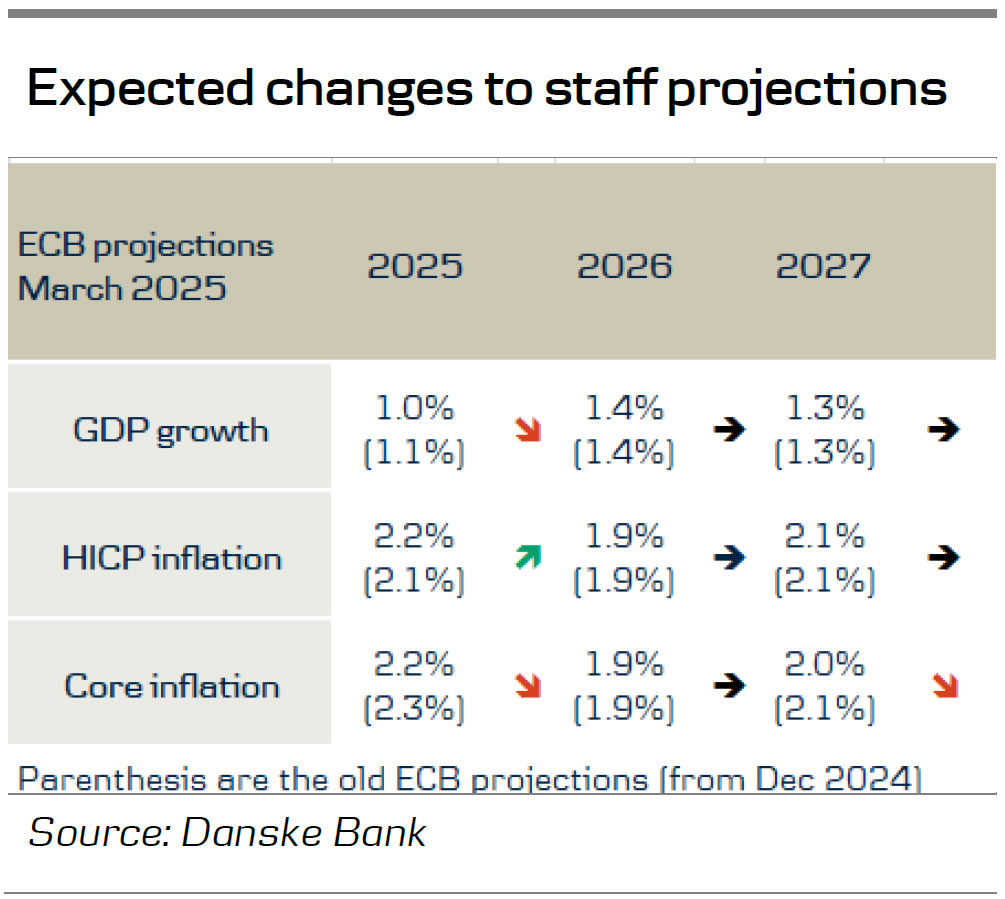
Growth in the final quarter of 2024 turned out to be weaker than projected by the ECB. The December staff projections saw GDP rising by 0.2% q/q while the actual number was just 0.05% q/q due to a contraction in Germany while Spain grew 0.8% q/q. Momentum has since increased a bit as indicated by the PMIs that recorded 50.2 in both January and February, following an average of 49.3 in Q4, due to a rise in the manufacturing PMIs. The labour market has also remained resilient with employment rising 0.1% q/q in the final quarter of 2025 and the unemployment rate recording 6.3% in December. Hence, the new projections will likely continue to show 0.3% q/q growth in all of 2025, but the yearly growth figure is expected to be revised down to 1.0% y/y from 1.1% y/y due to a smaller overhang from Q4 24. For 2026 and 2027 we do not expect any changes to the projections
Another well-telegraphed meeting should have limited market impact
Despite several non-traditional drivers influencing EUR/USD – including the German election, developments around a potential Ukraine ceasefire, and ongoing US economic policy uncertainty – the pair has stabilised around 1.05 in recent weeks. In this context, the March ECB meeting provides clarity for markets, as another rate cut is fully priced in. A data-dependent, meeting-by-meeting approach with no pre-commitment to a specific rate path is likely to be maintained, limiting market impact. With the next cut not fully priced until June, the forward rate path will be the key focus.
A central question is whether the ECB will drop its ‘restrictive’ policy label, a move that would signal a hawkish stance and pose upside risk for EUR/USD. While some policymakers, including Schnabel, have called for a discussion on this, the statement is unlikely to make such a shift just yet, as the ECB seeks to avoid unintended hawkish signals. However, post-meeting commentary may provide insights into when such an adjustment could occur.
For EUR/USD, the February US jobs report, released the day after the ECB meeting, is likely to be more pivotal. The recent USD depreciation has narrowed the rate differential gap, and our short-term model suggests EUR/USD is now trading closer to fundamentals, as the tariff risk premium has eased. In the near term, we expect the pair to remain range-bound around 1.05. However, if softer US data momentum persists, risks are skewed toward some tactical upside. On a strategic basis, our outlook for stronger relative structural growth in the US keeps us bearish on EUR/USD, with a move toward parity expected over the next 12 months.
Sunset Market Commentary
Markets
President Trump seriously shook up a growth-focused market with some renewed tariffs threats. A nasty equity sell-off, compounded by tech heavyweight Nvidia, ended up in declines of almost 3% on Wall Street yesterday. It resulted in a break lower that worsened the technical picture. Sentiment deteriorated in European after-market hours, meaning stocks on the continent had to catch up somewhat today. The EuroStoxx50 pared opening losses of 1%+ to 0.5% currently. US investors show little appetite to buy the dip so far. Stocks open mixed despite in-line January PCE deflators marginally raising bets for Fed easing this year. Both the headline (0.3% m/m and 2.5% y/y) and core (0.3% m/m, 2.6%) eased from December. They go against the message delivered by the CPIs released earlier this month. Several Fed members (including Waller) already said they didn’t expect PCE to be as alarming. US yields decline up to 2 bps with sentiment having grown more vulnerable into the first minutes of the US session. Other eco data included a sharp rise in personal income (0.9% m/m vs 0.4% expected), which was counterbalanced by an unexpected drop in spending, both nominally and real. German net daily rate changes vary between -1 and -2 bps. A small uptick in the wake of slightly higher-than-expected German inflation was overturned quickly. Prices rose 0.6% m/m and 2.8% y/y, a 0.1 ppt beat vs consensus in both measures. A miss in the French CPI (flat on a monthly basis, 0.9% y/y) will have offset the German impact in next week’s European print anyway. US growth concerns eventually dominated over the weak sentiment in the dollar FX market. EUR/USD ekes out a slight gain to north of 1.04. DXY hovers near yesterday’s closing level.
Next week offers new chances to crosscheck the market’s changed reaction function with the US ISMs, ADP job report and payrolls. After the European CPI on Monday, special attention shifts to March 6, when European leaders hold a special summit dedicated in finding ways to fund a huge defense investment need. The ECB meets that day as well. A 25 bps rate cut to 2.5% is all but certain. Question is how loud the hawks (Schnabel in particular) will have shout at the current point in the easing cycle. Amongst others, we suspect the ECB will no longer label policy as “restrictive” in the statement.
News & Views
Czech Q4 GDP was upwardly revised from 0.5% to 0.7% Q/Q and the economy grew by 1% for the whole of 2024. Czech consumption grew by 1.5% Q/Q and by more than 3% Y/Y at the end of the year, while investment (-1.5% Q/Q and -2.4% Y/Y) and foreign trade (real exports down by 1.5% and imports down by 1.9% Q/Q) continued to fall significantly. While today's advanced GDP numbers could theoretically lead to a slight upward revision of GDP for 2025 in aggregate, we are not doing so. We perceive quite significant risks to investment - in particular, given rising uncertainties associated with global trade - and therefore continue to forecast growth near 2% this year (with risks skewed to the downside). From a CNB perspective, the revised GDP number is a slightly positive surprise - overall GDP is growing 0.4 %pts faster than the latest staff forecast suggested. Underlying details give both hawkish and dovish voices in the Bank Board arguments. The mood at the CNB Board will be determined in coming weeks mainly by more industry figures, January inflation, wage growth and possible geopolitical shocks (25% tariffs on exports).
Both Canadian and Swedish Q4 GDP was stronger than expected than well. The Swedish economy accelerated from an upwardly revised 0.6% Q/Q pace in Q3 to 0.8% in Q4 (2.4% Y/Y). Details showed consumption adding 0.7%, gross fixed capital formation rising by 1.8% and net exports contributing to growth with exports rising by 0.7% and imports falling by 0.5%. Households real disposable income increased by 3.5% Y/Y. Together with higher CPI readings earlier this month, these activity figures strengthen the Riksbank’s case of ending the rate cut cycle at the current level of 2.25%. Canadian GDP accelerated from 0.5% to 0.6% Q/Q with household spending increasing by the most in over two years (1.4% Q/Q), residential construction increasing at the fastest pace in over one year (+3.9%), export growth (1.8%) outpacing import (1.3%) growth and business investment up.