
Sample Category Title
Bitcoin Tumbles Below 80K on Risk Aversion Wave
Bitcoin was the top loser on Friday following over 6% drop during Asian and early European trading.
The biggest crypto currency remains under increased pressure, mainly due to broader risk aversion, driven by the US tariff policies which continue to fuel uncertainty and prompt investors’ migration into safety.
The sentiment also soured by lack of expected overhaul of US crypto market regulations that was promised by President Trump.
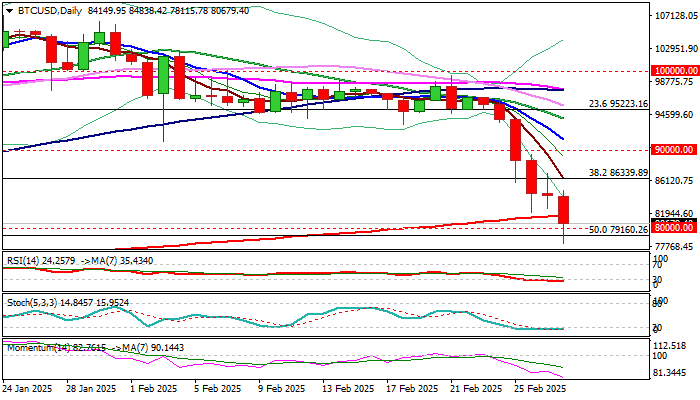
Bitcoin price dipped below psychological 80K support and cracked important Fibo level at $79160 (50% retracement of $48738/$109582), trading at these levels for the first time since early November.
It is also on track for weekly loss of 16% and a record monthly drop in February, which so far retraced more than a half of strong gains in Nov/Jan, driven by euphoria after Trump’s election victory.
Technical picture on daily chart is bearish and supportive for further losses, but oversold conditions and significance of $80K zone (100DMA / psychological / Fibo 50%) suggest that bears may take a breather.
Profit taking at the end of the week and month is also expected to contribute to corrective action.
Session high ($84838) and broken Fibo 38.2% ($86339) reverted to resistances, guarding key barrier at $90K (former key support) which should cap extended upticks and keep bears in play.
Res: 81582; 82556; 84838; 86339
Sup: 90000; 79160; 78115; 75801
U.S. Consumer Spending Starts the Year on a Weak Footing, While Income Growth Picks Up
Personal income rose strongly in January, increasing by 0.9% month-over-month.
Meanwhile, consumer spending took a breather. Following a streak of strong gains in a prior four months, nominal spending edged lower by 0.2% m/m.
The volume of spending (which excludes the impact of inflation) pulled back more strongly, declining by 0.5% m/m. The volume of spending on goods declined 1.7%, with lower spending on both durable and non-durable goods. Spending on services was little changed, edging up by 0.1% m/m.
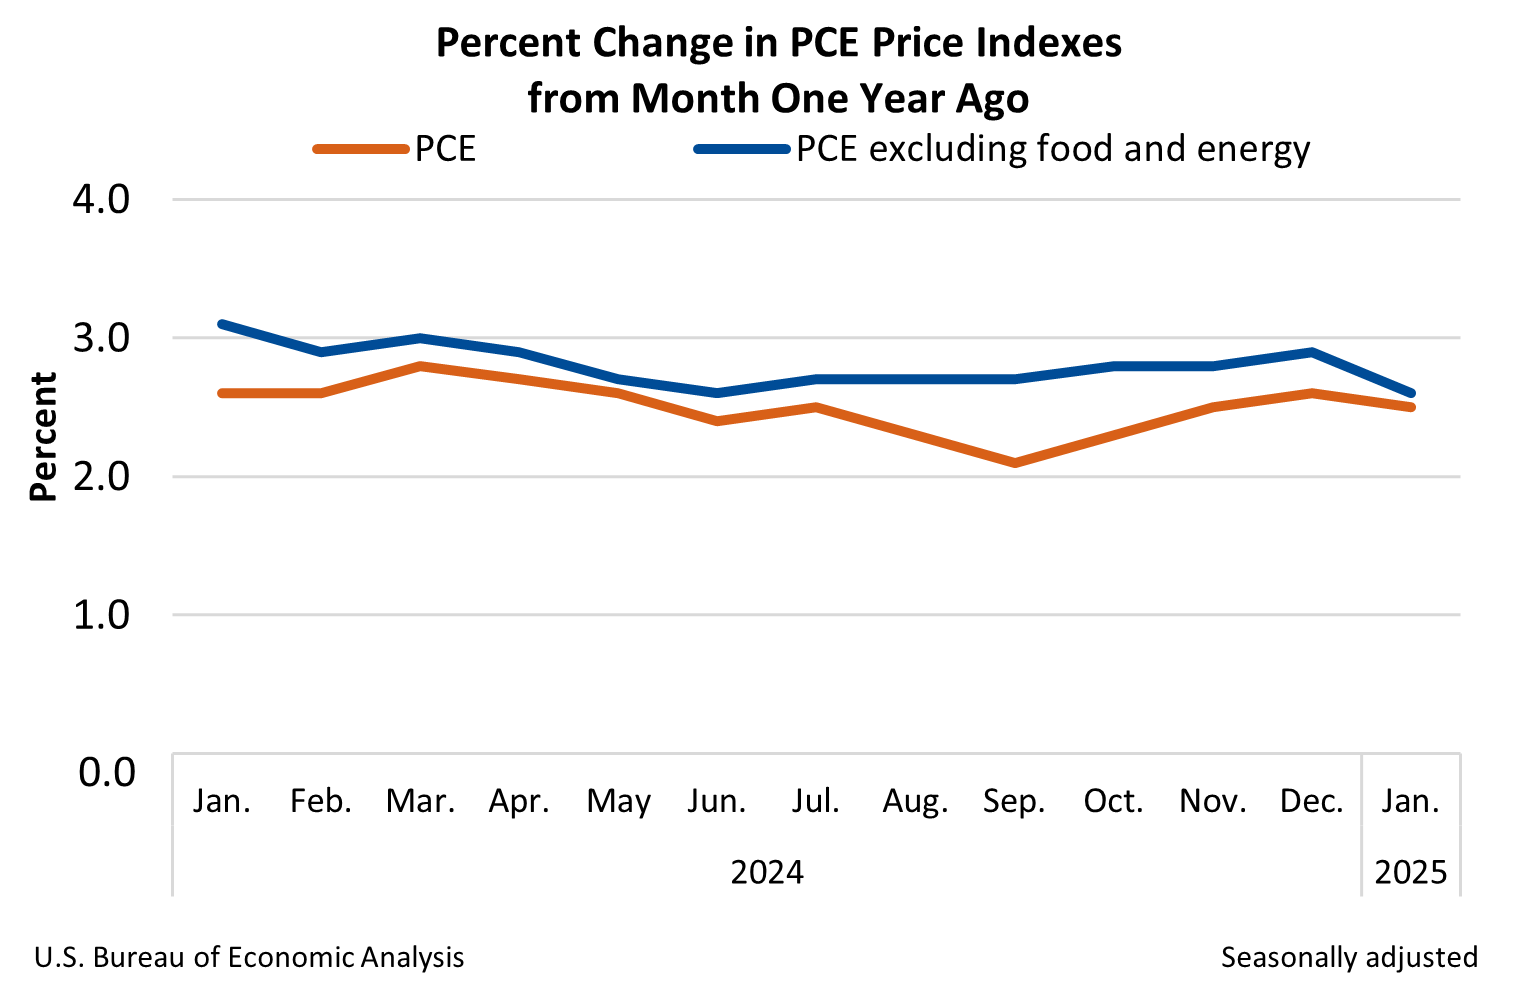
The Fed's preferred inflation metric, the core PCE price deflator, rose 0.3% m/m, up slightly from the 0.2% increase seen in December. In year-over-year terms, core PCE inflation fell to 2.6% from 2.9% in the prior month thanks to favourable base-year effects.
Strong income gains alongside soft spending pushed the savings rate up to 4.6% from 3.5% in the prior month. It is notable that the same large increase in the saving rate happened in January of 2024, followed by a continuous decline throughout the year.
Key Implications
Given the drop in retail sales in January, the soft print on consumer spending in today’s report comes as no surprise. As we mentioned previously, one-off factors, such as the wildfires in California and inclement weather, may have contributed to the slower pace of spending at the start of the year. This suggests a potential bounce-back in spending in the coming months. Still, the slower start to the year indicates that growth in real consumer spending in Q1 is likely to come in around to 2.0-2.5% (annualized), down from our prior estimate of 3.0%.
Broadly speaking, U.S. households remain in good financial shape, supported by a still healthy labor market and a significant wealth cushion. As long as this remains the case, we expect real consumer spending to stay resilient this year, with growth moderating to around 2%. However, given the rapid policy changes, the outlook remains fraught with risks. Consumer sentiment has weakened noticeably in recent months, weighed down by policy uncertainty. Consumers also remain highly sensitive to inflation, and concerns over the impact of tariffs have caused a significant increase in year-ahead inflation expectations in the latest consumer confidence surveys.
USD/JPY Mid-Day Outlook
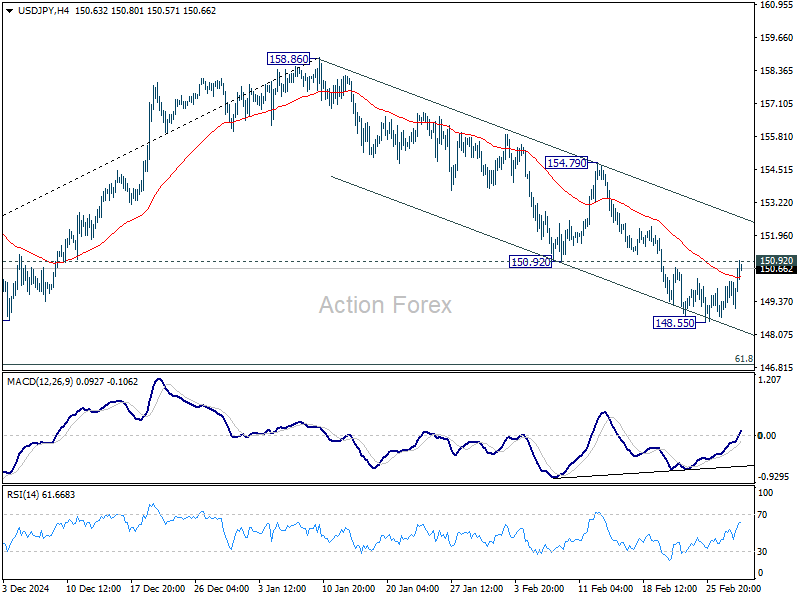
Daily Pivots: (S1) 148.98; (P) 149.57; (R1) 150.39; More...
Intraday bias in USD/JPY remains neutral first. Further decline is expected with 150.92 support turned resistance intact. Current fall from 158.86 is seen as the third leg of the pattern from 161.94 high. Below 148.55 will target 61.8% retracement of 139.57 to 158.86 at 146.32 next. On the upside, however, break of 150.92 will indicate short term bottoming and bring stronger rebound.
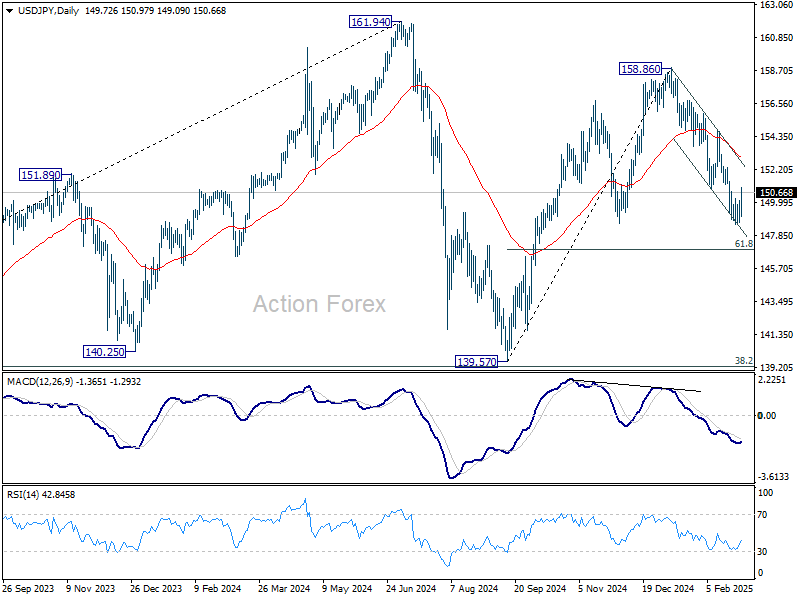
In the bigger picture, price actions from 161.94 are seen as a corrective pattern to rise from 102.58 (2021 low). In case of another fall, strong support should be seen from 38.2% retracement of 102.58 to 161.94 at 139.26 to bring rebound. However, sustained break of 139.26 would open up deeper medium term decline to 61.8% retracement at 125.25.
GBP/USD Mid-Day Outlook
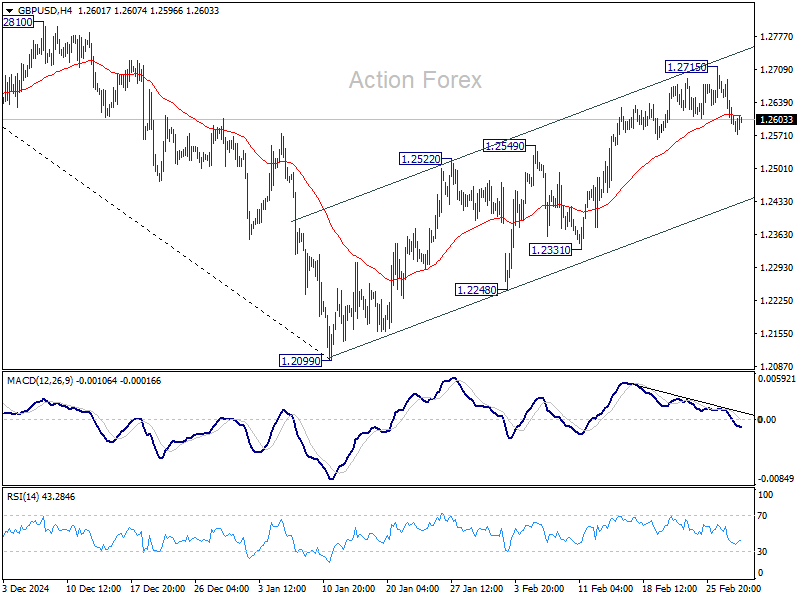
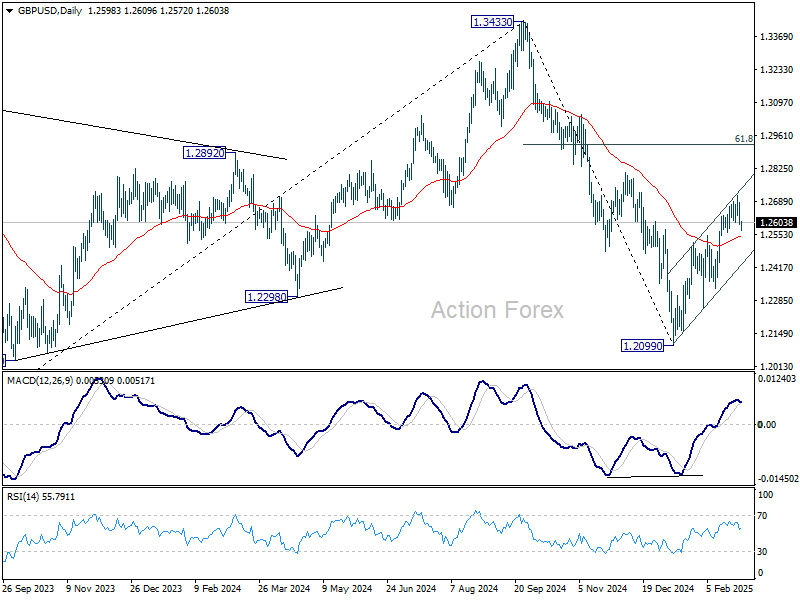
Daily Pivots: (S1) 1.2569; (P) 1.2630; (R1) 1.2663; More...
Intraday bias in GBP/USD stays mildly on the downside for the moment. Fall from 1.2715 short term top would target near term channel support (now at 1.2438). Firm break there will argue that whole rebound from 1.2099 has completed as a correction. On the upside, though, break of 1.2715 will resume the rebound to 1.2810 resistance next.
In the bigger picture, rise from 1.0351 (2022 low) should have already completed at 1.3433 (2024 high), and the trend has reversed. Further fall is now expected as long as 1.2810 resistance holds. Deeper decline should be seen to 61.8% retracement of 1.0351 to 1.3433 at 1.1528, even as a corrective move. However, firm break of 1.2810 will dampen this bearish view and bring retest of 1.3433 high instead.
Canada’s GDP Surged to End 2024
The Canadian economy topped expectations in the fourth quarter of last year, advancing 2.6% quarter/quarter annualized (q/q, AR). The third quarter was also revised higher (+2.2% q/q from +1.0 q/q). Stripping out external factors, final domestic demand came in at a very strong 2.4% q/q. The flash estimate for January showed a very strong 0.3% monthly increase.
Consumer spending was a major contributor in the quarter (+5.6% q/q from 4.2% q/q in Q3). Spending was concentrated on durable items (+14.2% q/q) like trucks, vans, and SUVs, as well as telecommunication and financial services (+5.8% q/q).
Residential investment shot higher (+16.7% q/q), with greater resale activity and increases in new construction/renovations all driving the gain. Non-residential investment was also strong (+8.1% q/q), as aircraft shipments in the quarter provided a one-time boost.
Exports gained 7.4% q/q, while imports were up by 5.4% q/q. The difference added 0.6 percentage points to overall GDP. High demand for precious metals, energy, and cars led the export gain, with most of this coming in December, when tariffs started flooding news headlines.
Key Implications
The Canadian economy flexed its muscles in the back half of 2024. Consumers were once again the driving force, as lower interest rates and the GST/HST tax break spurred spending on luxuries like autos and dining out. There was also evidence of businesses front-running tariffs, with exports to the U.S. surging in December. Elsewhere, non-residential business investment may have been strong in Q4, but we don't expect that to persist given the souring of business sentiment in Canada. All told, it was a strong quarter for Canadian growth. And while some of this momentum appears to have carried forward into 2025, with tariffs potentially on deck next week, today's report seems to be telling a story of what could have been for the Canadian economy.
Today's GDP release isn't going to sway the BoC. Yes, the report was strong. But Governor Macklem is more concerned about the risks on the horizon rather than what happened last year. The bank's own research shows huge downside risks to the economy should tariffs come to pass. Market pricing is still effectively a coin flip for the BoC's meeting on March 12th. This feels right, as the BoC could go either way. No one would complain if the BoC took out more insurance against the downside risks with another 25 bp cut, while a hold could also be justified should the bank prefer to take a wait-and-see approach.
EUR/USD Mid-Day Outlook
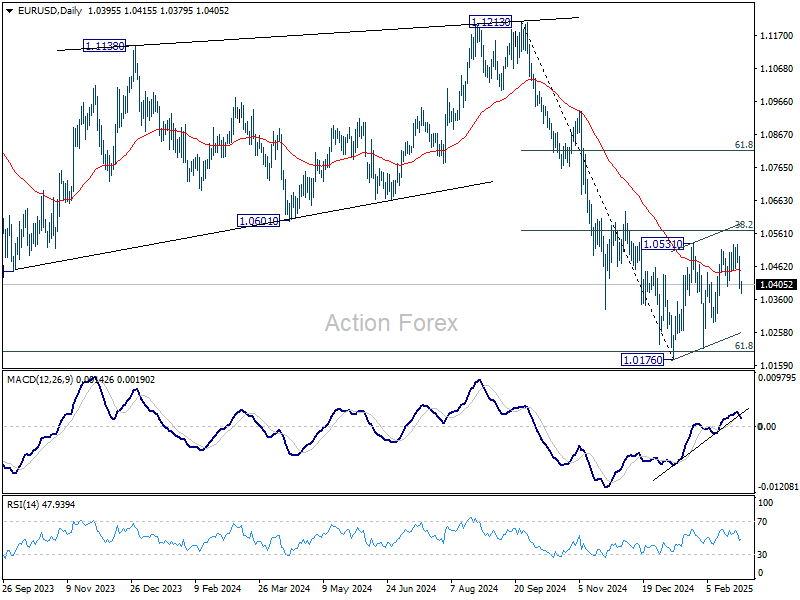
Daily Pivots: (S1) 1.0365; (P) 1.0430; (R1) 1.0462; More...
Intraday bias in EUR/USD stays on the downside at this point. Consolidations from 1.0176 should have completed with three waves up to 1.0527. Deeper fall should be seen to retest 1.0176/0210 support zone. Firm break there will resume whole decline from 1.1213. For now, risk will stay on the downside as long as 1.0527 holds, in case of recovery.
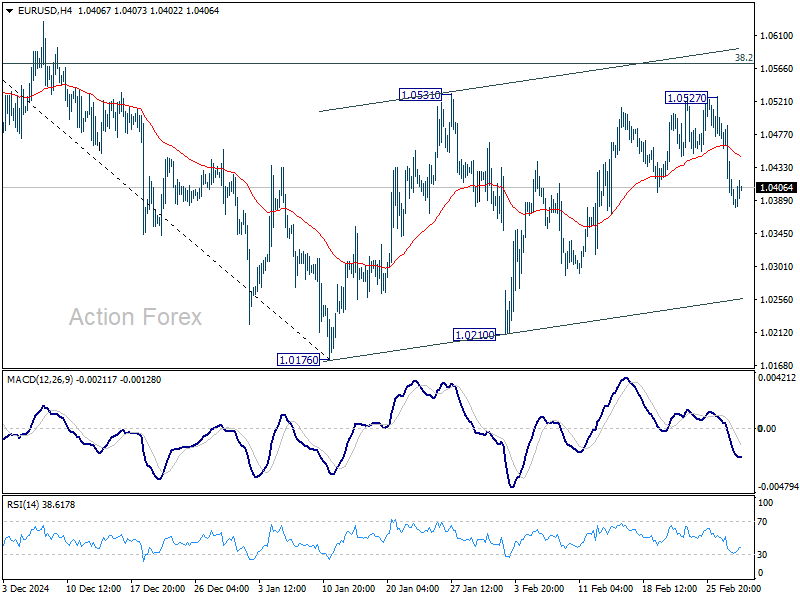
In the bigger picture, immediate focus is on 61.8 retracement of 0.9534 (2022 low) to 1.1274 (2024 high) at 1.0199. Sustained break there will solidify the case of medium term bearish trend reversal, and pave the way back to 0.9534. However, reversal from 1.0199 will argue that price actions from 1.1274 are merely a corrective pattern, and has already completed.
Sentiment Lifted by In-Line PCE Data, But Tariffs Could Limit Optimism
Risk sentiment received a boost in early US trading as January’s PCE inflation data came in line with expectations, lifting hopes that Fed may have room to cut rates in the first half of the year. Both headline and core PCE inflation slowed, adding to expectations that disinflation remains on track. Fed fund futures now indicate a roughly 70% chance of a 25bps rate cut in June, up from around 63% just a week ago.
However, it remains to be seen whether the bounce in equities, as suggested by higher futures, can hold. Market sentiment remains fragile, particularly with ongoing uncertainty surrounding US tariff policies. Investors are cautious about the economic fallout from trade measures, which could overshadow any optimism from cooling inflation data.
In the currency markets, Dollar is on track to close the week as the best performer, followed by Sterling and Swiss Franc. Meanwhile, Kiwi remains the weakest, followed by Aussie and Loonie, with little sign of a reversal. Euro and Yen are positioning in the middle.
In Europe, at the time of writing, FTSE is up 0.36%. DAX is down -0.57%. CAC is down -0.55%. UK 10-year yield is down -0.024 at 4.490. Germany 10-year yield is down -0.026 at 2.394. Earlier in Asia, Nikkei fell -2.88% Hong Kong HSI fell -3.28%. China Shanghai SSE fell -1.98%. Singapore Strait Times fell -0.65%. Japan 10-year JGB yield fell -0.02 to 1.376.
US PCE inflation slows as expected, personal income surges but spending contracts
The latest US PCE inflation data showed price pressures moderating slightly in January. Both headline and core PCE (excluding food and energy) price indices rose 0.3% month-over-month, aligning with market expectations.
On an annual basis, headline PCE inflation slowed to 2.5% yoy from 2.6% yoy, while core PCE eased to 2.6% yoy from 2.9% yoy, reinforcing the view that disinflation remains on track despite persistent price pressures in some sectors.
However, the consumer sector showed signs of strain. Personal income surged 0.9% mom, far exceeding expectations of 0.3%, but personal spending unexpectedly declined by -0.2%, missing the anticipated 0.2% gain.
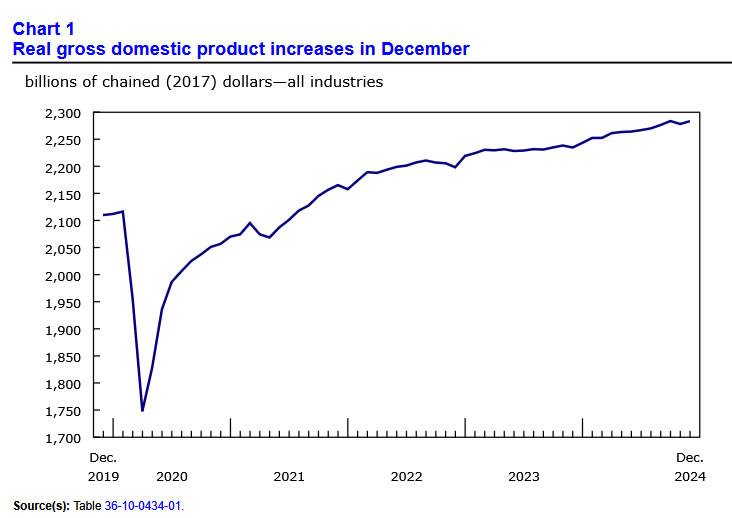
Canada's GDP grows 0.2% mom in Dec, misses expectations
Canada's GDP expanded by 0.2% mom in December, falling short of the expected 0.3% growth. Both services-producing (+0.2%) and goods-producing industries (+0.3%) contributed to the increase, marking the fifth gain in the past six months. A total of 11 out of 20 industrial sectors posted growth.
Looking ahead, preliminary data suggests GDP grew by 0.3% mom in January, with gains led by mining, quarrying, oil and gas extraction, wholesale trade, and transportation. However, retail trade remained a weak spot, partially offsetting the overall growth.
BoE’s Ramsden sees inflation risks two-sided
BoE Deputy Governor Dave Ramsden indicated a shift in his inflation outlook, stating that he no longer views risks to achieving the 2% target as skewed to the downside. Instead, he now sees inflation risks as "two-sided," acknowledging the potential for "more inflationary as well as disinflationary scenarios".
Ramsden also raised concerns about the UK's sluggish economic growth, highlighting the possibility that the economy's supply capacity might be "even weaker" than previously assessed by BoE.
If this proves true, the UK’s "speed limit" for growth would be lower, leading to prolonged tightness in the labor market and sustained wage pressures. That would result in "greater persistence in domestic inflationary pressures."
Swiss KOF falls to 101.7, manufacturing and services under pressure
Switzerland's KOF Economic Barometer declined from 103.0 to 101.7 in February, missing expectations of 102.1.
The data suggests weakening momentum in the economy, with most production-side sectors facing increasing pressure. According to KOF, manufacturing and services sectors saw the most notable deterioration.
However, the report also pointed to some stabilizing factors, as foreign demand and private consumption showed resilience, helping to offset some of the negative trends.
BoJ’s Uchida: Yield rise reflects market’s views on economic and global developments
Speaking in parliament today, BoJ Deputy Governor Shinichi Uchida said recent rise in JGB yields "reflects the market's view on the economic and price outlook, as well as overseas developments."
"There's no change to our stance on short-term policy rates and government bond operations," he emphasized, adding that the bond holdings "continue to exert a strong monetary easing effect" on the economy.
When asked whether the prospect of further rate hikes and tapering would continue to drive yields higher, Uchida responded that it is ultimately “up to markets to decide.”
Japan's Tokyo CPI slows to 2.2% yoy in Feb, industrial production down -1.1% mom in Jan
Tokyo’s core CPI (ex-food) slowed to 2.2% yoy in February, down from 2.5% yoy and below market expectations of 2.3% yoy. This marks the first decline in four months, largely due to the reintroduction of energy subsidies. Meanwhile, core-core CPI (ex-food and energy) held steady at 1.9% yoy. Headline CPI slowed from 3.4% yoy to 2.9% yoy.
In the industrial sector, production contracted by -1.1% mom in January, a sharper decline than the expected -0.9%. Manufacturers surveyed by Japan’s Ministry of Economy, Trade, and Industry anticipate a strong 5.0% mom rebound in February, followed by a -2.0% mom drop in March.
On the consumer front, retail sales grew 3.9% yoy in January, slightly missing the 4.0% yoy forecast, but still pointing to resilient domestic demand.
EUR/USD Mid-Day Outlook
Daily Pivots: (S1) 1.0365; (P) 1.0430; (R1) 1.0462; More...
Intraday bias in EUR/USD stays on the downside at this point. Consolidations from 1.0176 should have completed with three waves up to 1.0527. Deeper fall should be seen to retest 1.0176/0210 support zone. Firm break there will resume whole decline from 1.1213. For now, risk will stay on the downside as long as 1.0527 holds, in case of recovery.
In the bigger picture, immediate focus is on 61.8 retracement of 0.9534 (2022 low) to 1.1274 (2024 high) at 1.0199. Sustained break there will solidify the case of medium term bearish trend reversal, and pave the way back to 0.9534. However, reversal from 1.0199 will argue that price actions from 1.1274 are merely a corrective pattern, and has already completed.
US PCE inflation slows as expected, personal income surges but spending contracts
The latest US PCE inflation data showed price pressures moderating slightly in January. Both headline and core PCE (excluding food and energy) price indices rose 0.3% month-over-month, aligning with market expectations.
On an annual basis, headline PCE inflation slowed to 2.5% yoy from 2.6% yoy, while core PCE eased to 2.6% yoy from 2.9% yoy, reinforcing the view that disinflation remains on track despite persistent price pressures in some sectors.
However, the consumer sector showed signs of strain. Personal income surged 0.9% mom, far exceeding expectations of 0.3%, but personal spending unexpectedly declined by -0.2%, missing the anticipated 0.2% gain.
Canada’s GDP grows 0.2% mom in Dec, misses expectations
Canada's GDP expanded by 0.2% mom in December, falling short of the expected 0.3% growth. Both services-producing (+0.2%) and goods-producing industries (+0.3%) contributed to the increase, marking the fifth gain in the past six months. A total of 11 out of 20 industrial sectors posted growth.
Looking ahead, preliminary data suggests GDP grew by 0.3% mom in January, with gains led by mining, quarrying, oil and gas extraction, wholesale trade, and transportation. However, retail trade remained a weak spot, partially offsetting the overall growth.
Canadian Dollar Eyes Canada’s GDP
The Canadian dollar is calm in the European session, trading at 1.4438, up 0.02% on the day. Later today, Canada releases GDP and the US publishes the Core PCE Price Index. USD/CAD has rallied for five straight trading days, gaining 1.8% during that time and hitting a three-week high.
Canada’s GDP expected to rebound in January
Canada’s economy is projected to have gained 0.3% m/m in December, following a 0.2% decline in November. Canada will also release GDP for fourth-quarter 2024, which is expected at 1.8% y/y, up from 1% in the third quarter. The forecast for an improvement in GDP is based on a busy December shopping season, as consumers took advantage of a sales tax holiday which started on December 15.
The Bank of Canada has also projected at 1.8% gain in GDP for Q4 2024 but remains concerned about the damage from potential US tariffs on Canadian products. The Trump administration has sent mixed messages as to whether the tariffs will take effect on March 4, leaving Canadian officials in the dark. The US imposed and then revoked 25% tariffs on Canada on Feb. 4 and suspended the tariffs for 30 days.
The BoC has said that a trade war with the US would inflict “permanent” damage on Canada’s GDP and raise inflation. Canada sends about 75% of its exports to the US and is extremely vulnerable to US tariffs. The BoC lowered rates by a quarter-point at the January 29 meeting but if the US reinstates tariffs against Canada next week, it would complicate any plans to continue lowering rates. The BoC meets next on March 12.
The US delivers core PCE inflation, the Fed’s preferred inflation gauge, later today. The market estimates for January stand at 2.6% y/y (vs. 2.8% in December) and 0.2% m/m (vs. 0.3% in December). This would indicate that inflation remains sticky and is above the Federal Reserve’s target of 2%. The Fed is in no rush to cut rates, unless inflation drops more than expected or the labor market, which has been cooling slowly, suddenly deteriorates.