Sample Category Title
GBP/USD Weekly Outlook
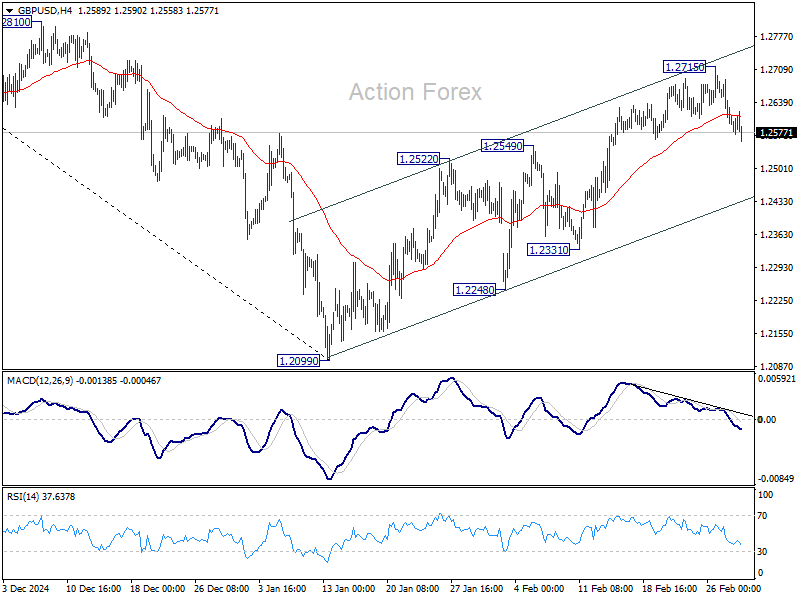
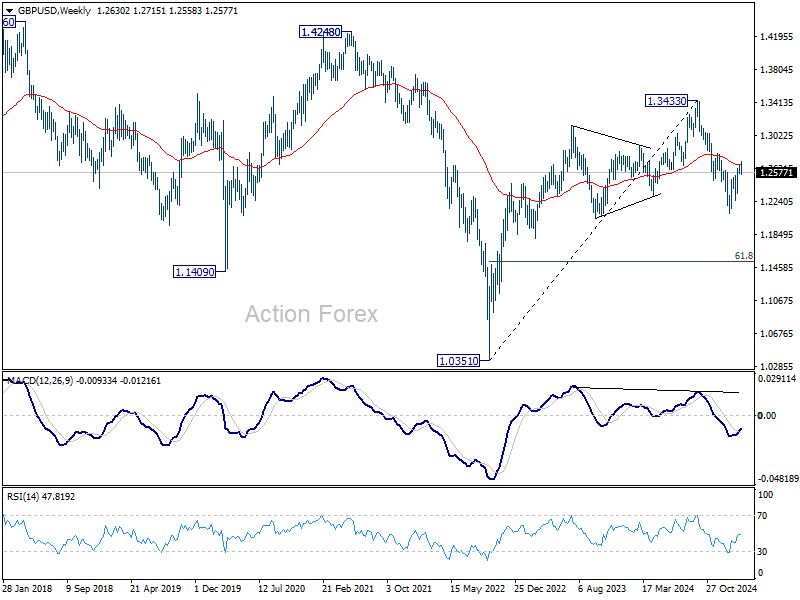
GBP/USD edged higher to 1.2715 last week but subsequent retreat suggests short term topping, on bearish divergence condition in 4H MACD. Initial bias remains mildly on the downside this week for near term rising channel support (now at 1.2427). Sustained break there will indicate that corrective rebound from 1.2099 has already completed. Nevertheless, above 1.2715 will resume the rebound to 1.2810 resistance next.
In the bigger picture, rise from 1.0351 (2022 low) should have already completed at 1.3433 (2024 high), and the trend has reversed. Further fall is now expected as long as 1.2810 resistance holds. Deeper decline should be seen to 61.8% retracement of 1.0351 to 1.3433 at 1.1528, even as a corrective move. However, firm break of 1.2810 will dampen this bearish view and bring retest of 1.3433 high instead.
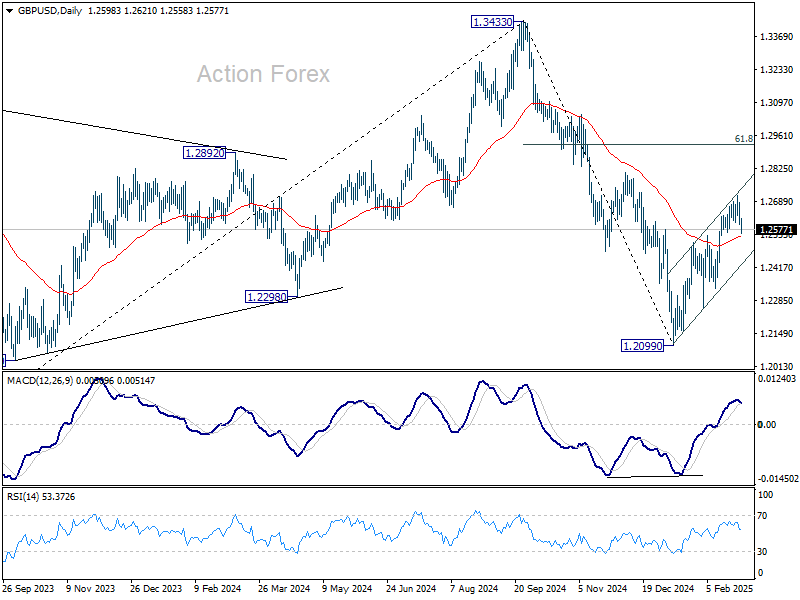
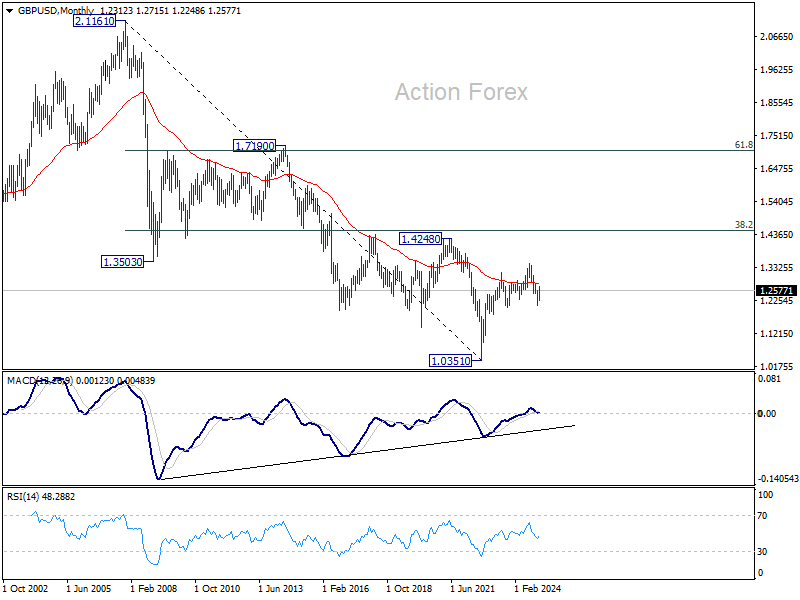
In the long term picture, price actions from 1.0351 (2022 low) are seen as a corrective pattern to the long term down trend from 2.1161 (2007 high) only. Outlook will be neutral at best as long as 1.4248 structural resistance holds, even in case of strong rebound.
USD/CHF Weekly Outlook
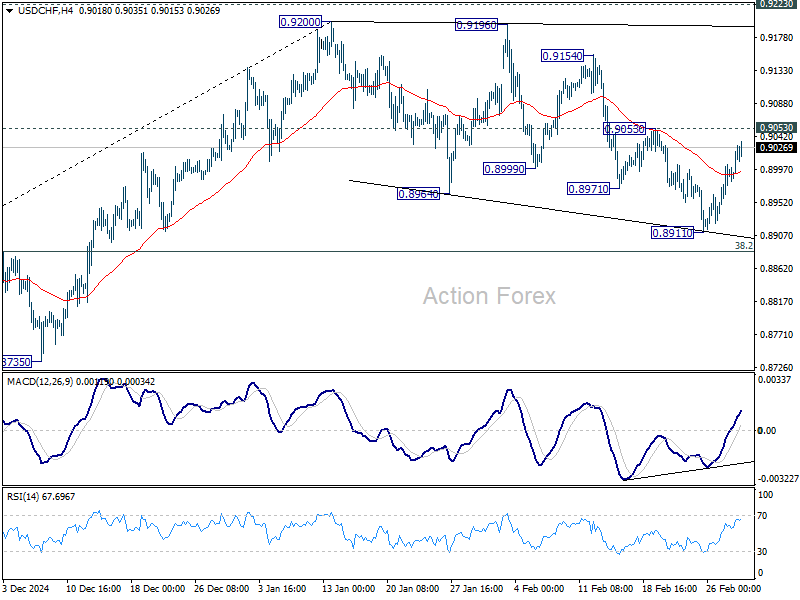
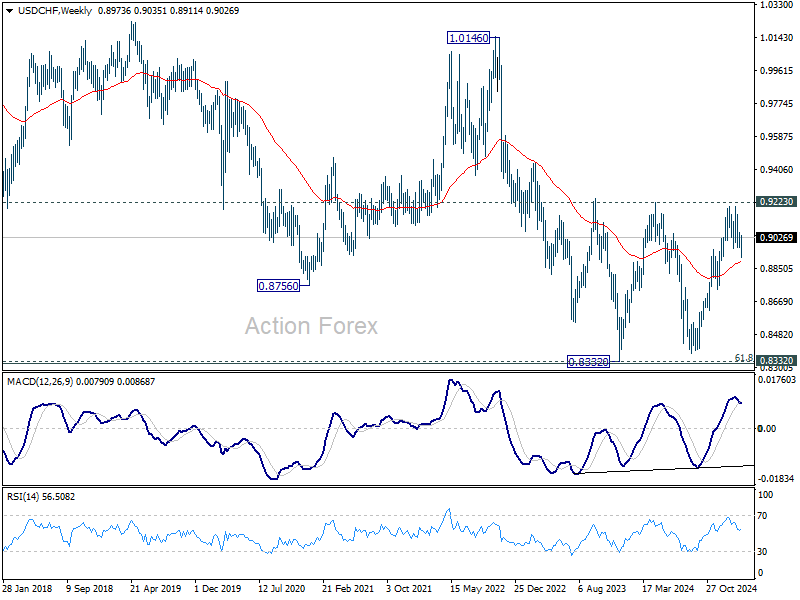
USD/CHF rebounded strongly last week but upside is capped below 0.9053 resistance. Initial bias stays neutral this week first. On the upside, firm break of 0.9053 will suggest that corrective pattern from 0.9200 has already completed at 0.8911. Further rally should then be seen to retest 0.9200 resistance. In case of another fall, downside should be contained by 38.2% retracement of 0.8374 to 0.9200 at 0.8884 to bring rebound.
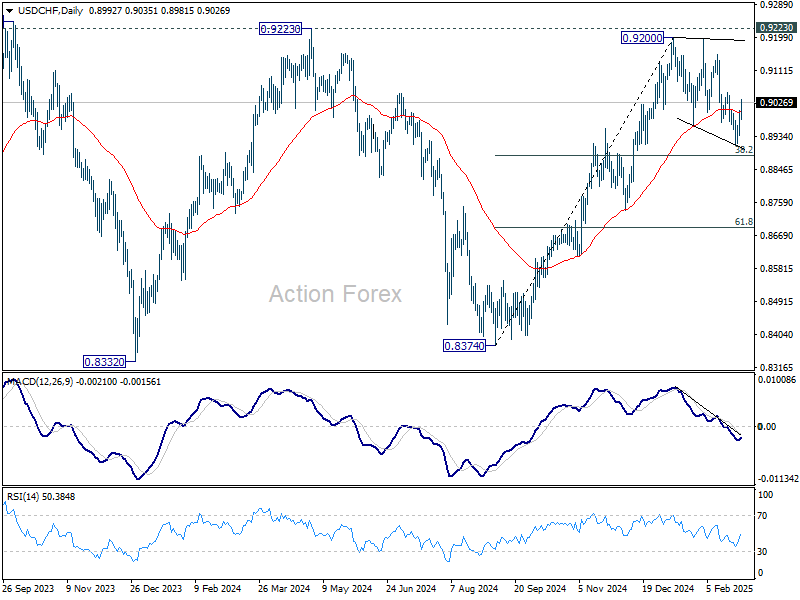
In the bigger picture, decisive break of 0.9223 resistance will argue that whole down trend from 1.0342 (2017 high) has completed with three waves down to 0.8332 (2023 low). Outlook will be turned bullish for 1.0146 resistance next. Nevertheless, rejection by 0.9223 will retain medium term bearishness for another decline through 0.8332 at a later stage.
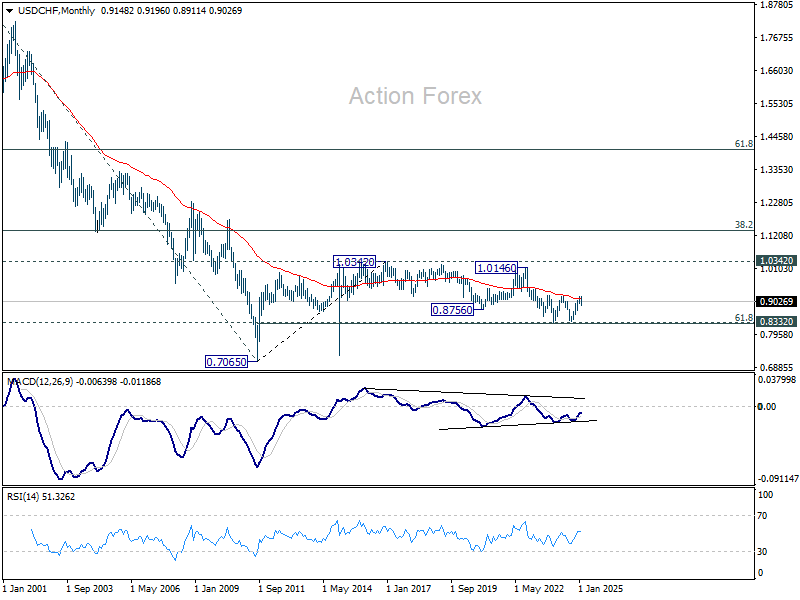
In the long term picture, price action from 0.7065 (2011 low ) are seen as a corrective pattern to the multi-decade down trend from 1.8305 (2000 high). Fall from 1.0342 (2016 high) is seen as the second leg. Sustained break of 55 M EMA (now at 0.9131) will indicate that the third leg has already started. However, rejection by 55 M EMA again, followed by break of 61.8% retracement of 0.7065 to 1.0342 at 0.8317, will pave the way back to 0.7065.
AUD/USD Weekly Report
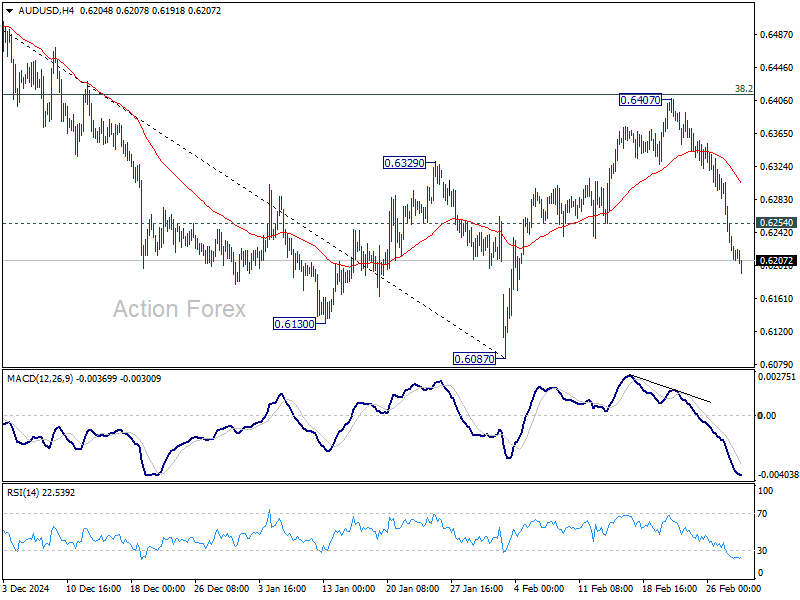
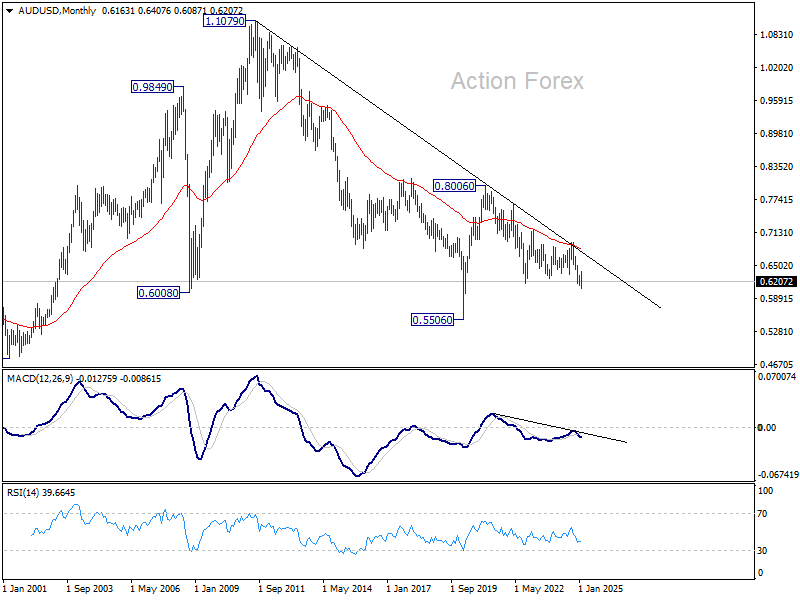
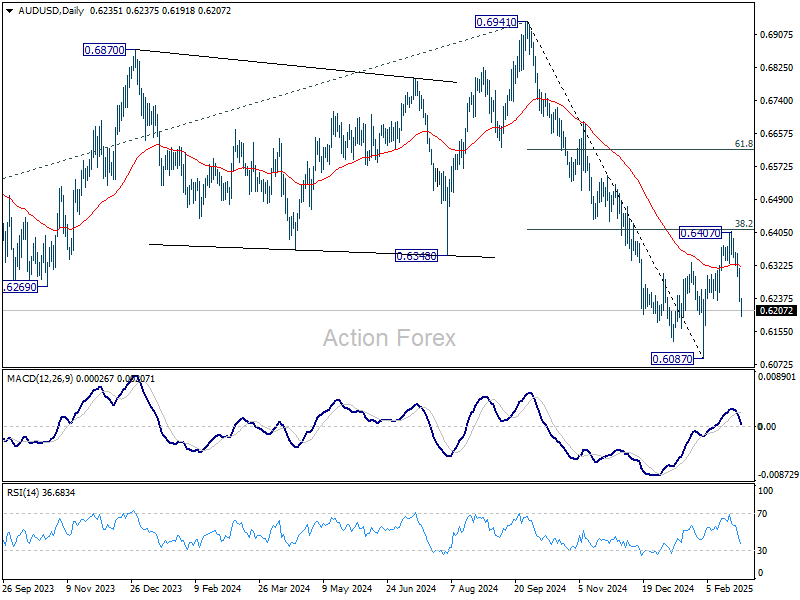
AUD/USD's extended fall last week suggests that corrective rebound from 0.6087 has completed at 0.6407, ahead of 38.2% retracement of 0.6941 to 0.6087 at 0.6413. Initial bias stays on the downside this week for retesting 0.6087 low. Firm break there will resume whole decline from 0.6941. On the upside, above 0.6254 minor resistance will turn intraday bias neutral first.
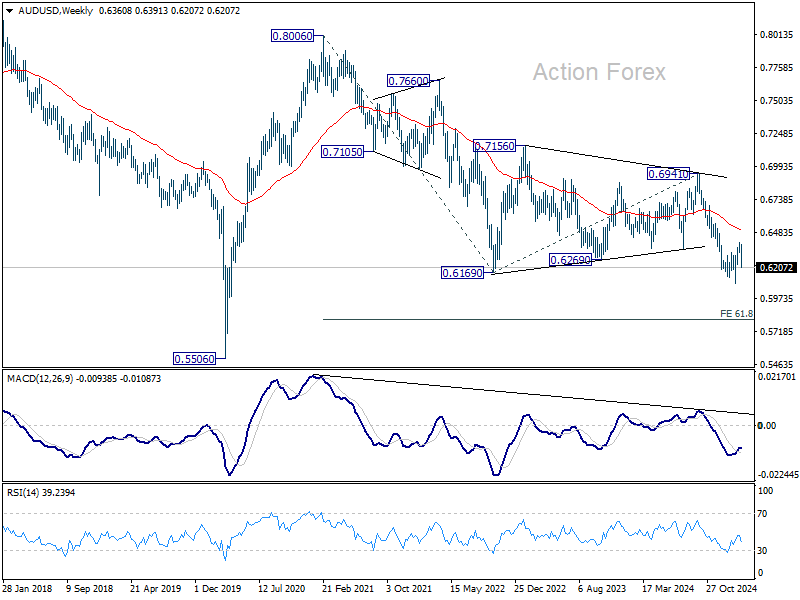
In the bigger picture, fall from 0.6941 (2024 high) is seen as part of the down trend from 0.8006 (2021 high). Next medium term target is 61.8% projection of 0.8006 to 0.6169 from 0.6941 at 0.5806. In any case, outlook will stay bearish as long as 55 W EMA (now at 0.6494) holds.
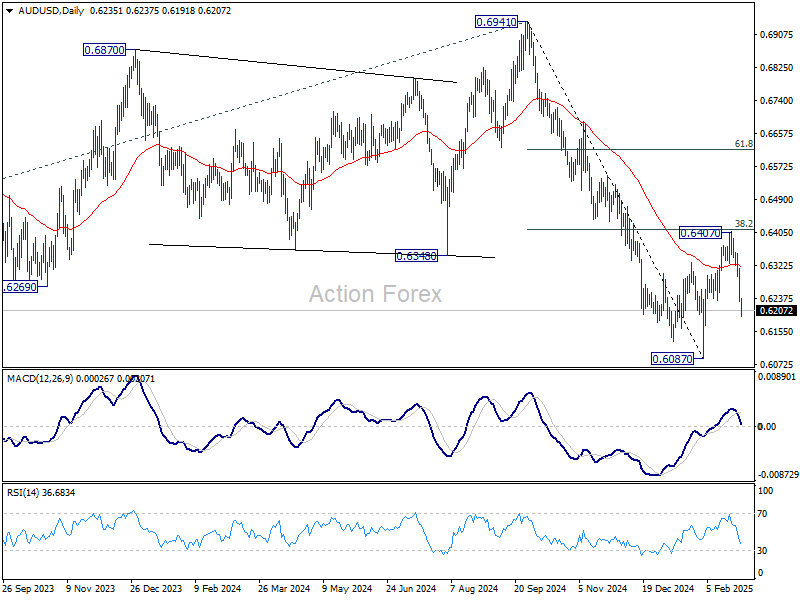
In the long term picture, prior rejection by 55 M EMA (now at 0.6823) is taken as a bearish signal. But for now, fall from 0.8006 is still seen as the second leg of the corrective pattern from 0.5506 long term bottom (2020 low). Hence, in case of deeper fall, strong support should emerge above 0.5506 to contain downside to bring reversal. However, this view is subject to adjustment if current decline accelerates further.

USD/CAD Weekly Outlook
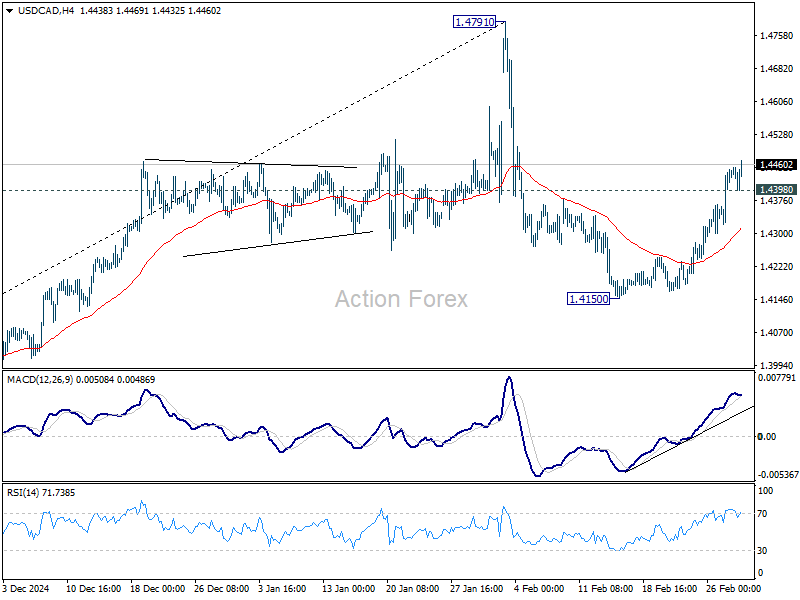
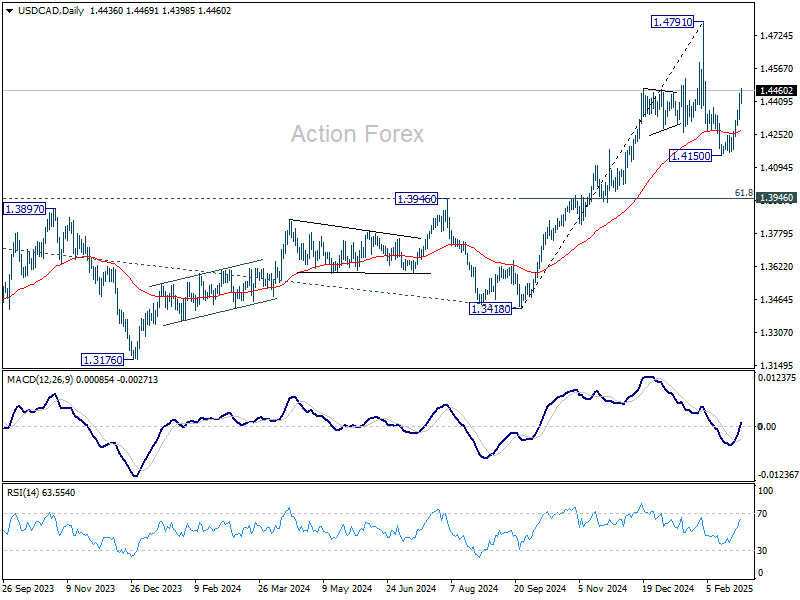
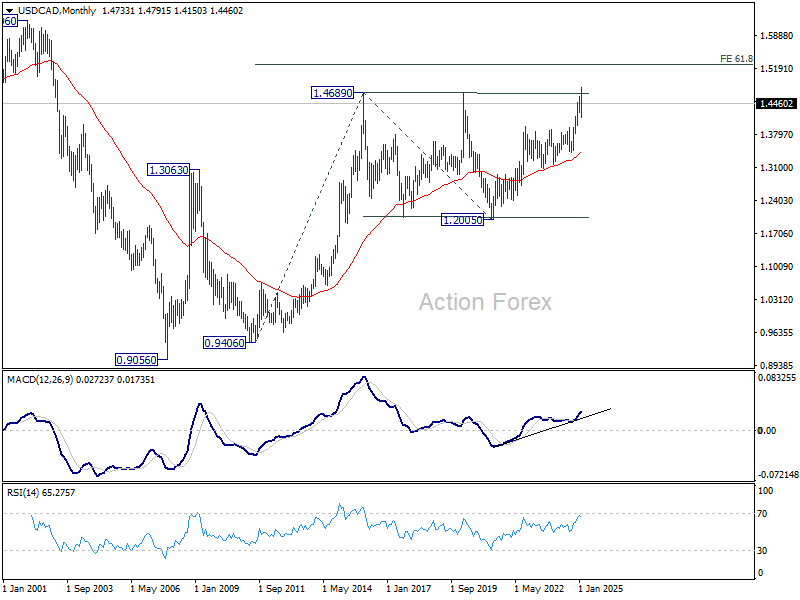
USD/CAD's strong rally last week suggests that corrective pull back from 1.4791 has already completed at 1.4150. Initial bias stays on the upside this week for retesting 1.4791. Strong resistance might be seen there to limit upside on first attempt. But decisive break there will confirm resumption of larger up trend. On the downside, below 1.4398 minor support will turn intraday bias neutral again first.
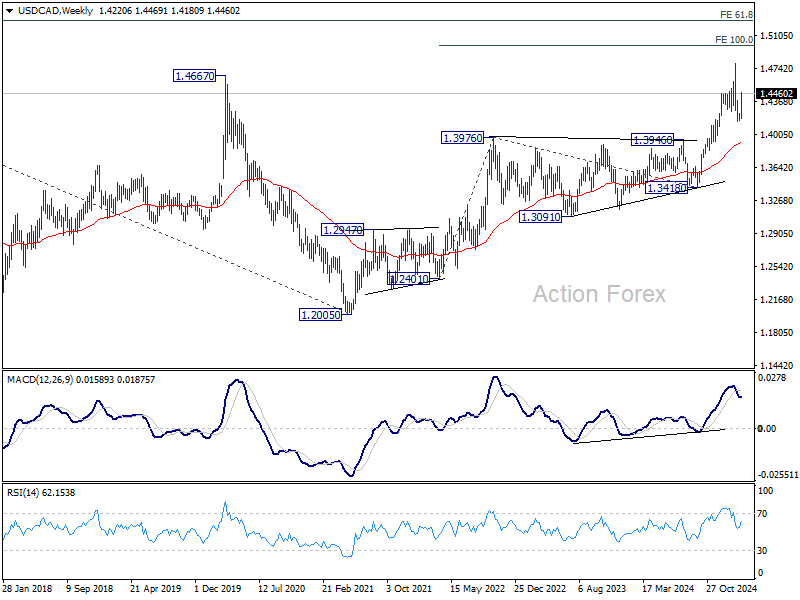
In the bigger picture, long term up trend is tentatively seen as resuming with prior breach of 1.4667/89 key resistance zone (2020/2015 highs). Next target is 100% projection of 1.2401 to 1.3976 from 1.3418 at 1.4993. This will remain the favored case as long as 1.3976 resistance turned support holds (2022 high), even in case of deep pullback.
In the longer term picture, up trend from 0.9506 (2007 low) is in progress and possibly resuming. Next target is 61.8% projections of 0.9406 to 1.4689 from 1.2005 at 1.5270. While rejection by 1.4689 will delay the bullish case, further rally will remain in favor as long as 55 M EMA (1.3430) holds.
GBP/JPY Weekly Outlook
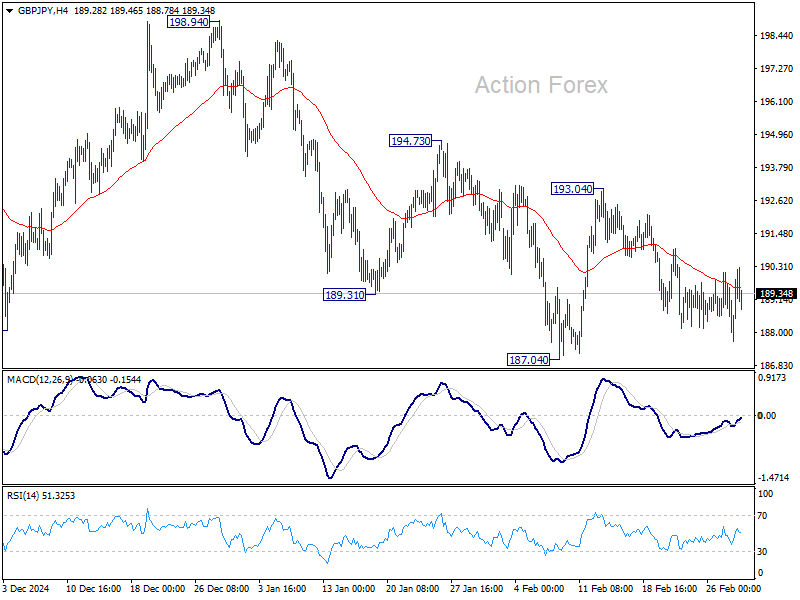
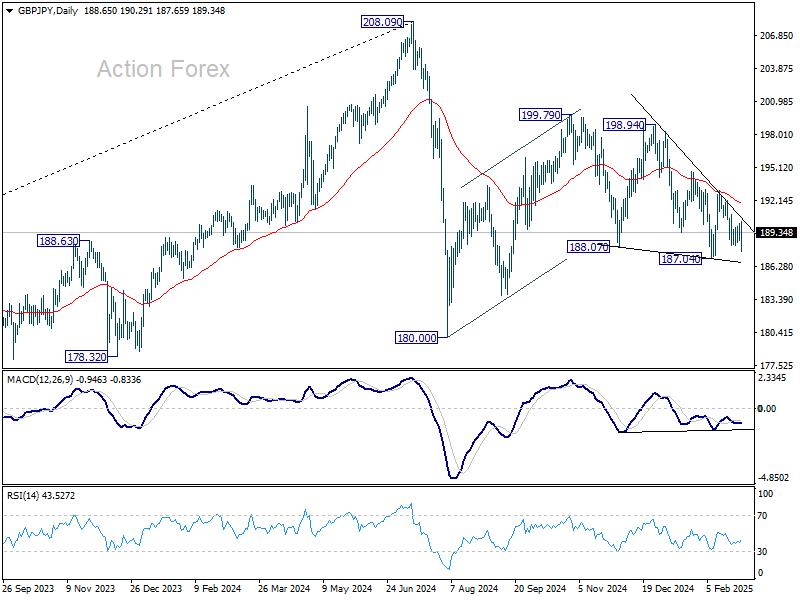
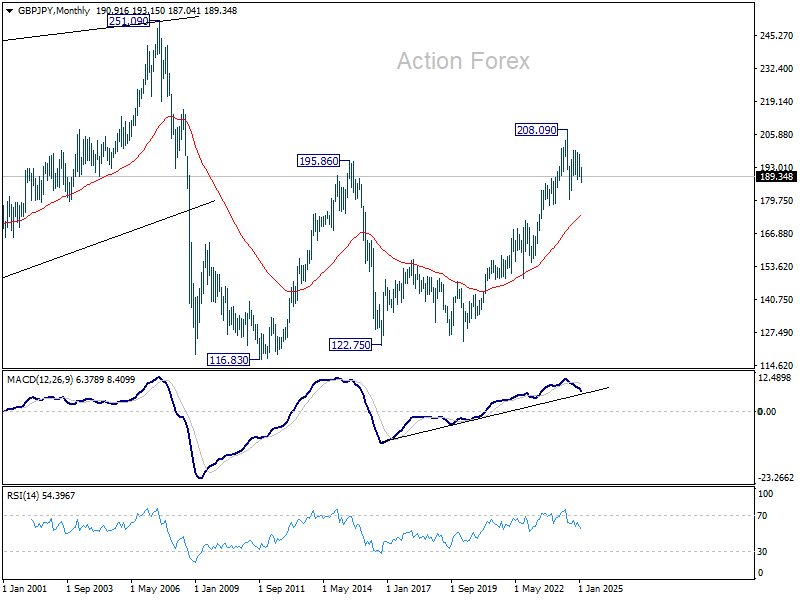
GBP/JPY was bounded in range trading above 187.04 last week. Initial bias stays neutral this week first. Further decline is in favor as long as 193.04 resistance holds. On the downside, firm break of 187.04 will extend the fall from 199.79 towards 180.00 support. That will also raise the chance that correction from 208.09 is resuming downward.
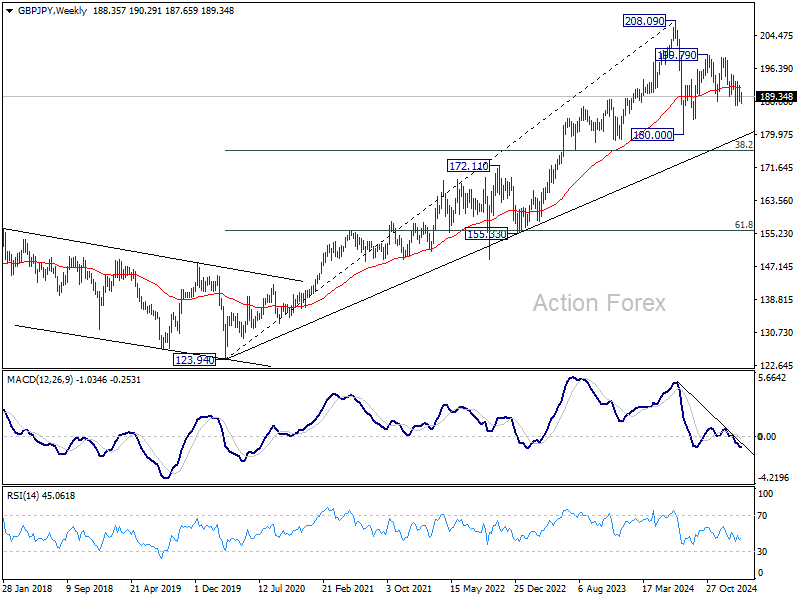
In the bigger picture, price actions from 208.09 are seen as a correction to rally from 123.94 (2020 low). Strong support should be seen from 38.2% retracement of 123.94 to 208.09 at 175.94 to contain downside. However, sustained break of 152.11 will bring deeper fall even still as a correction.
In the longer term picture, while a medium term top was formed at 208.09 (2024 high), it's still early to conclude that the up trend from 122.75 (2016 low) has completed. But GBP/JPY is at least in a medium term corrective phase, with risk of correction to 55 M EMA (now at 173.92).
EUR/JPY Weekly Outlook
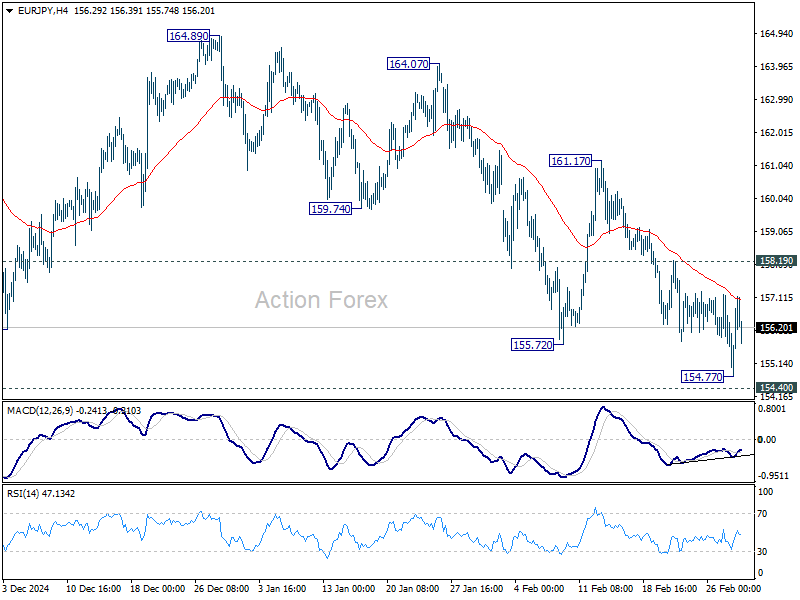
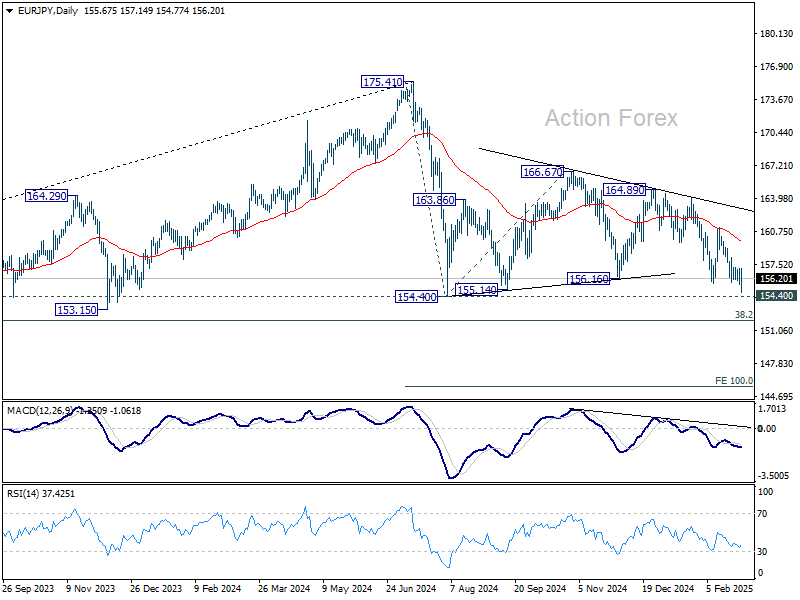
EUR/JPY dipped to 154.77 last week but quickly recovered. Initial bias is turned neutral this week first. Further decline is expected as long as 158.19 resistance holds. Below 154.77 will target 154.40 key support. Firm break there will confirm resumption of whole decline from 175.41 and target 152.11 fibonacci level next.
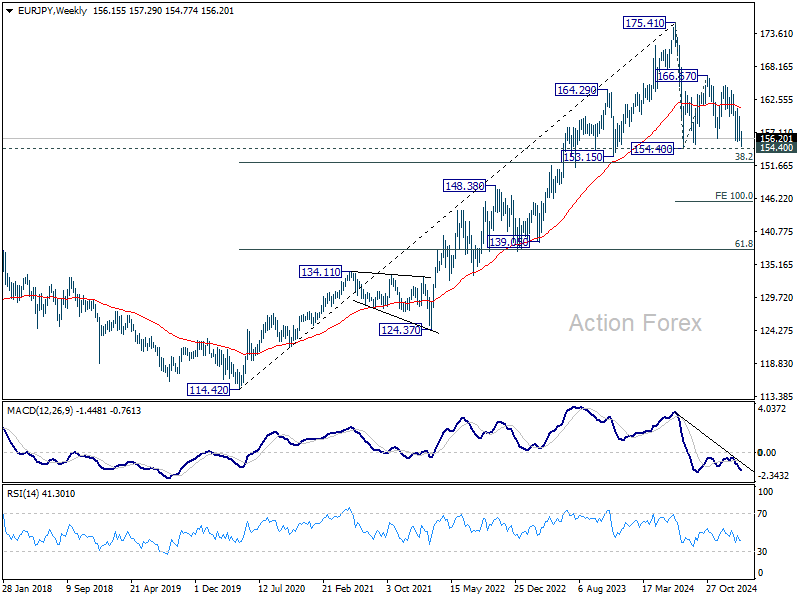
In the bigger picture, price actions from 175.41 are seen as correction to rally from 114.42 (2020 low). Strong support should be seen from 38.2% retracement of 114.42 to 175.41 at 152.11 to contain downside. However, sustained break of 152.11 will bring deeper fall even still as a correction. Next target will be 100% projection of 175.41 to 154.40 from 166.67 at 145.66.
In the long term picture, while 175.41 is at least a medium term top, it's still early to conclude that up trend from 94.11 (2012 low) has completed. A medium term corrective phase is in progress with risk of deeper fall back to 55 M EMA (now at 148.45).

EUR/GBP Weekly Outlook
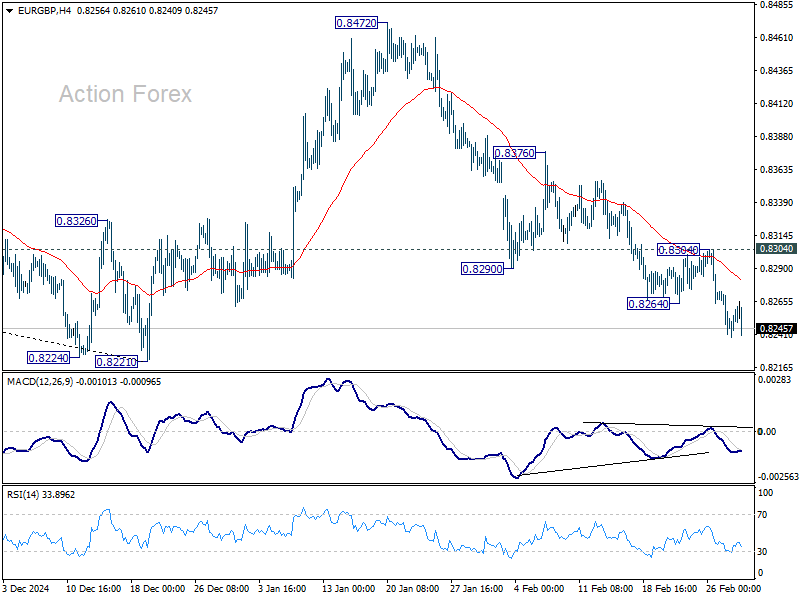
EUR/GBP's fall from 0.8472 continued last week after brief consolidations. Initial bias stays on the downside this week for retesting 0.8201/21 key support zone. Decisive break there will carry larger bearish implications. For now, risk will stay on the downside as long as 0.8304 resistance holds, in case of recovery.
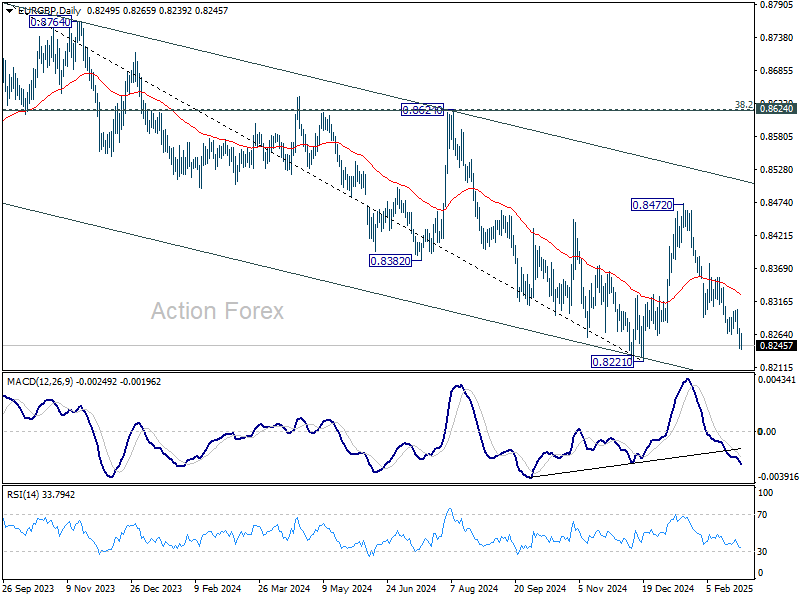
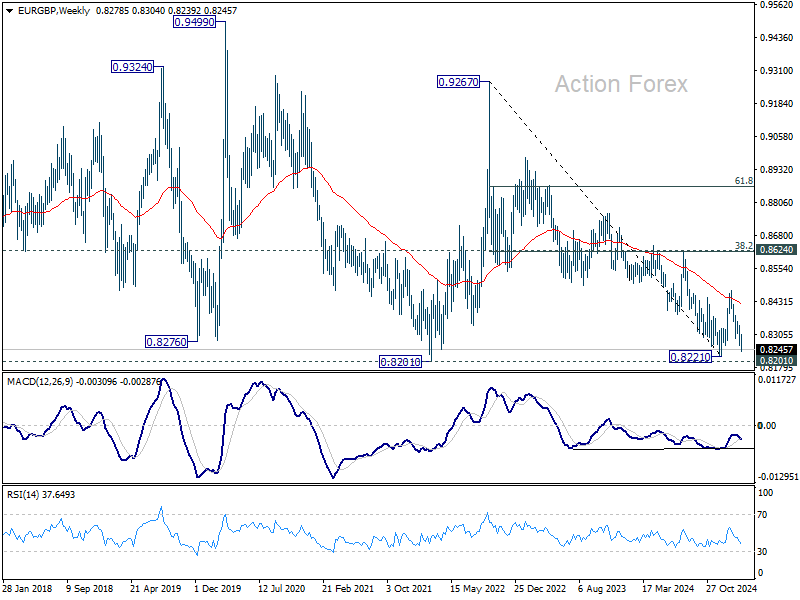
In the bigger picture, the medium term down trend remains intact with EUR/GBP staying well inside the falling channel. Prior rejection by 55 W EMA (now at 0.8419) also affirm bearishness. Decisive break of 0.8201/8221 support zone will resume whole down trend from 0.9449 (2020 high) and carry larger bearish implications.
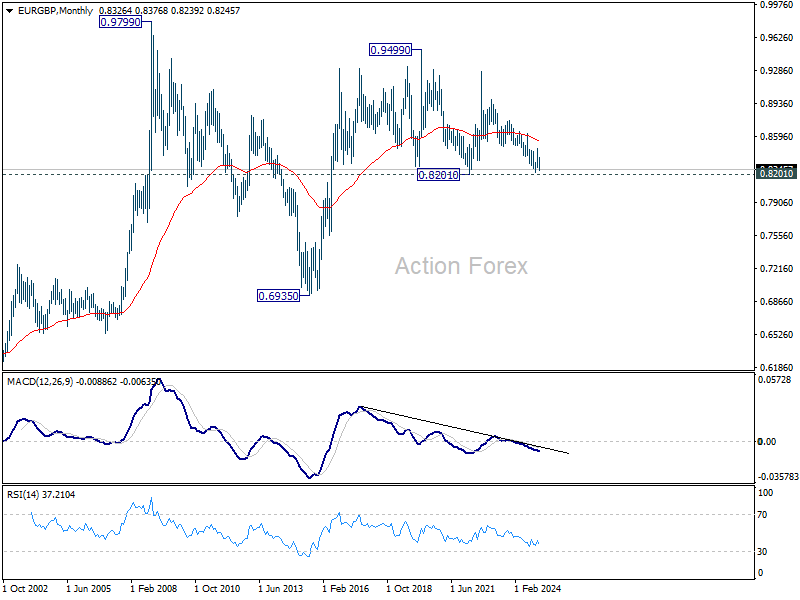
In the long term picture, price action from 0.9499 (2020 high) is seen as part of the long term range pattern from 0.9799 (2008 high). Range trading should continue between 0.8201 and 0.9499, until there is clear signal of imminent breakout.
EUR/AUD Weekly Outlook
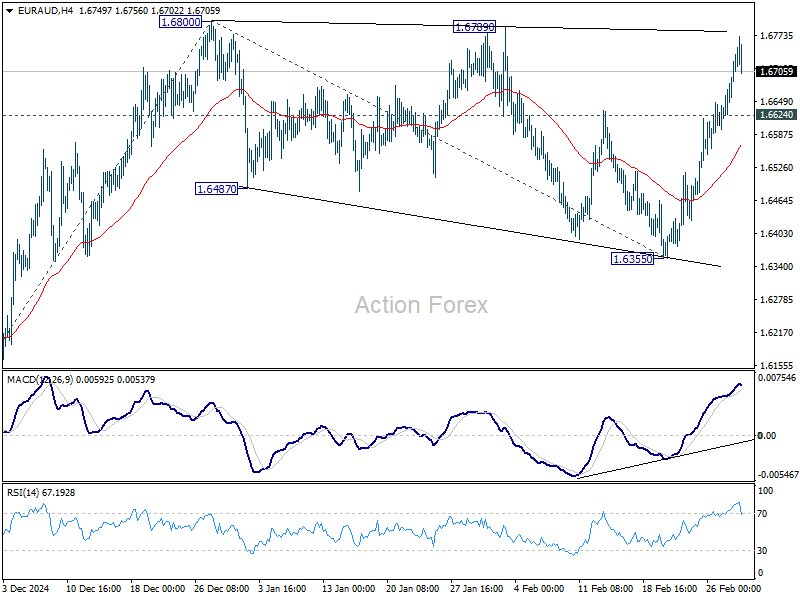
EUR/AUD's strong rally last week indicates that consolidation from 1.6800 has already completed with three waves down to 1.6355. Initial bias stays on the upside this week for 1.6800. Firm break there will resume the rise from 1.5963 to 61.8% projection of 1.5963 to 136800 from 1.6355 at 1.6872, and then 100% projection at 1.7192, which is close to 1.7180 high. On the downside, below 1.6624 minor support will delay the bullish case and turn intraday bias neutral again first.
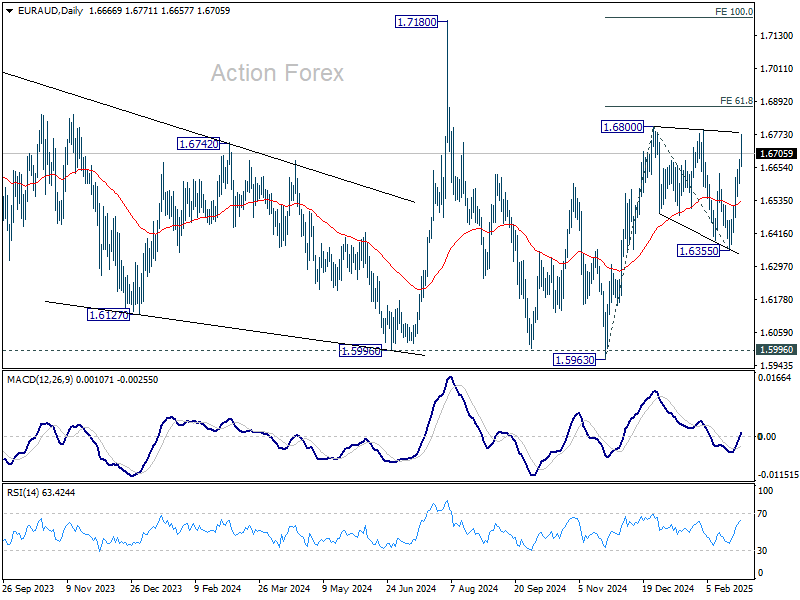
In the bigger picture, with 1.5996 key support (2024 low) intact, larger up trend from 1.4281 (2022 low) is still in favor to resume through 1.7180 at a later stage. Nevertheless, sustained break of 1.5996 will indicate that such up trend has completed and deeper decline would be seen.
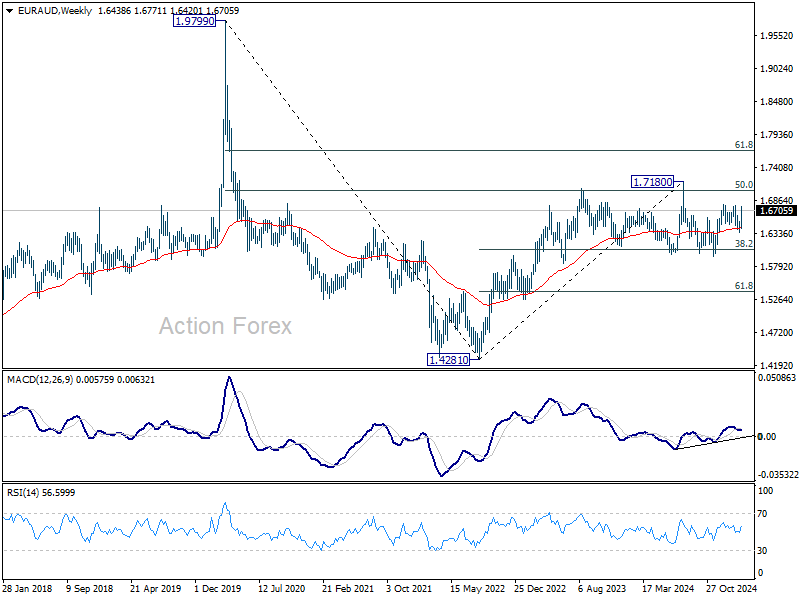
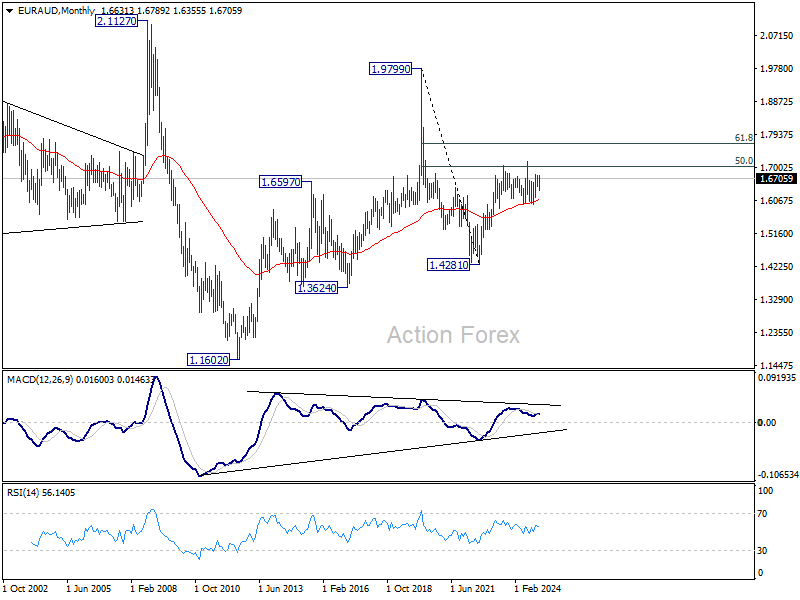
In the longer term picture, rise from 1.4281 is seen as the second leg of the pattern from 1.9799 (2020 high), which is part of the pattern from 2.1127 (2008 high). As long as 55 M EMA (now at 1.6090) holds, this second leg could still extend higher. However, sustained trading below 55 M EMA will open up the bearish case for extending the decline through 1.4281 low.
EUR/CHF Weekly Outlook
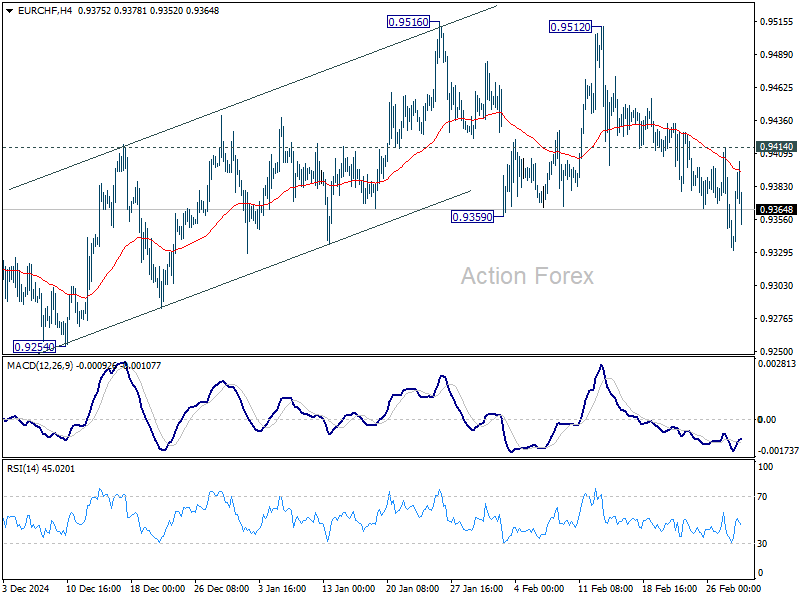
EUR/CHF's extended decline and break of 0.9359 support revived the case that corrective rise from 0.9204 has already completed at 0.9516. Further fall is expected this week as long as 0.9414 resistance holds, to retest 0.9204 low. On the upside, though, break of 0.9414 resistance will mix up the outlook again and turn intraday bias neutral.
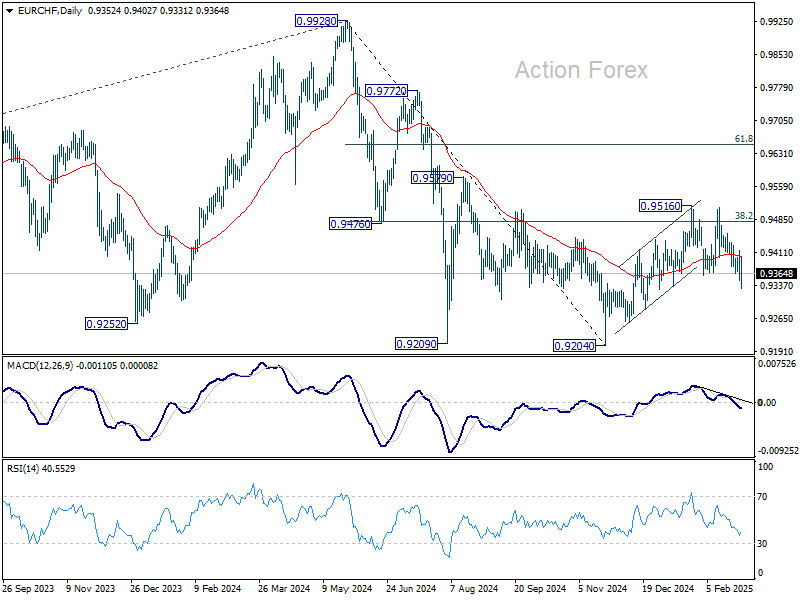
In the bigger picture, sustained trading above 38.2% retracement of 0.9928 to 0.9204 at 0.9481 should confirm that whole fall from 0.9928 has completed at 0.9204. Further rally should then be seen back to 61.8% retracement at 0.9651 and above. However, another rejection by 0.9481 will keep outlook bearish for extending larger down trend through 0.9204 at a later stage.
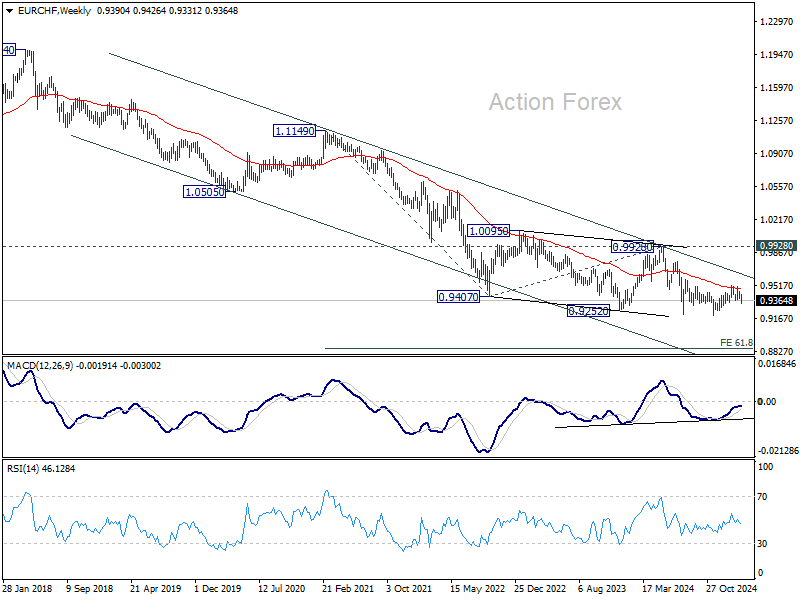
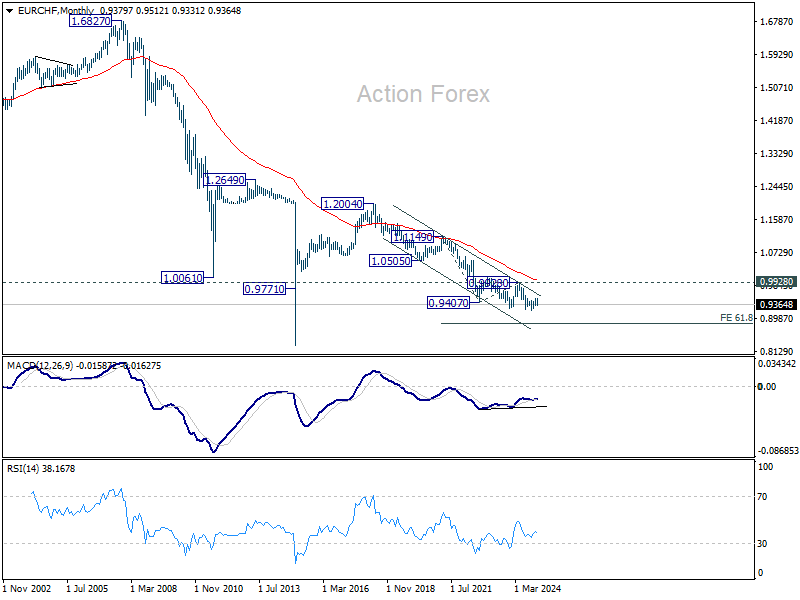
In the long term picture, as long as 0.9928 resistance holds, the multi-decade down trend remains intact, with decline from 1.2004 (2018 high) as another falling leg. Decisive break of 0.9252 (2023 low) will confirm long term down trend resumption to 61.8% projection of 1.1149 to 0.9407 from 0.9928 at 0.8851.
Safe-Haven Demand Fuels Dollar Rally Amid Trade, Geopolitical Turmoil
Market sentiment took a decisive turn for the worse last week, with risk aversion dominating across asset classes. The combination of deteriorating domestic economic conditions in the US and heightened global uncertainties has fueled concerns that risk appetite could weaken further. Equities faced renewed selling pressure, yields dropped sharply.
Domestically, US economic data painted a troubling picture. Consumer confidence deteriorated sharply, while weak personal spending data and a rise in jobless claims suggested that the labor market could be facing new headwinds. With the economy looking increasingly fragile, concerns are mounting that the economy may struggle to maintain momentum, reinforcing speculation about Fed rate cuts.
Externally, the risk of a full-blown trade war continues to escalate. US President Donald Trump doubled down on his aggressive tariff agenda, reaffirming the March 4 deadline for 25% tariffs on Canada and Mexico and indicating that the EU would be next in line with reciprocal tariffs.
Geopolitical tensions also worsened, particularly after a dramatic Oval Office showdown between Trump, Vice President JD Vance, and Ukrainian President Volodymyr Zelenskiy. The meeting, initially expected to pave the way for a mineral deal between the US and Ukraine—potentially a step toward resolving the Russian invasion—ended in failure. With US-Ukraine relations strained and no clear resolution in sight, uncertainty in the region remains elevated.
On the bright side, markets have scaled up expectations for a Fed rate cut in the first half of the year. However, it’s unclear whether additional monetary easing will truly bolster risk sentiment or simply underscore the extent of the economic challenges ahead. A rate cut could offer short-term relief for risk assets, but it might also underscore fears of an impending downturn in domestic activity.
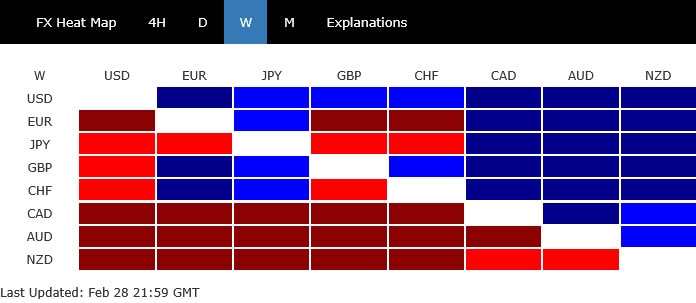
In the forex market, Dollar emerged as the clear winner for the week, benefiting from risk aversion rather than rate expectations. Sterling and Swiss Franc followed as the next strongest currencies, with the UK seemingly avoiding US tariff threats and the Franc gaining from both risk aversion and Euro weakness. At the other end of the spectrum, commodity currencies struggled, with New Zealand Dollar leading the declines, followed by Australian and Canadian Dollars. Meanwhile, Euro ended in a mixed manner, with the initial post-German election boost fading as tariff threats weighed. Yen also struggled to extend its rally, leaving it stuck in the middle of the performance ladder.
Investors Pin Hopes on Fed Easing as Stocks Sell Off, But Is Relief Temporary?
US equity markets ended February on a weak note, with NASDAQ suffering a sharp -3.5% weekly decline despite a late recovery. S&P 500 also lost nearly -1%, while DOW managed to close about 1% higher, benefiting from recovery after leading the selloff earlier in the month. However, the broader market sentiment remained fragile.
For the entire month, NASDAQ dropped -4%, marking its worst monthly performance since April 2024. S&P 500 fell -1.5%, while the DOW ended down -1.6%. Several factors weighed on market sentiment, including intensifying trade war risks, particularly as the scheduled 25% tariffs on Canada and Mexico approach on March 4. The more consequential reciprocal tariffs, set to take effect on April 2, also remain a source of significant uncertainty.
US economic data further exacerbated concerns, with sharp decline in consumer confidence, jump in jobless claims, and contraction in personal spending, all pointing to risk of extended weakness in household demand. These indicators have fueled doubts about the strength of US consumption, which remains a critical driver of economic growth.
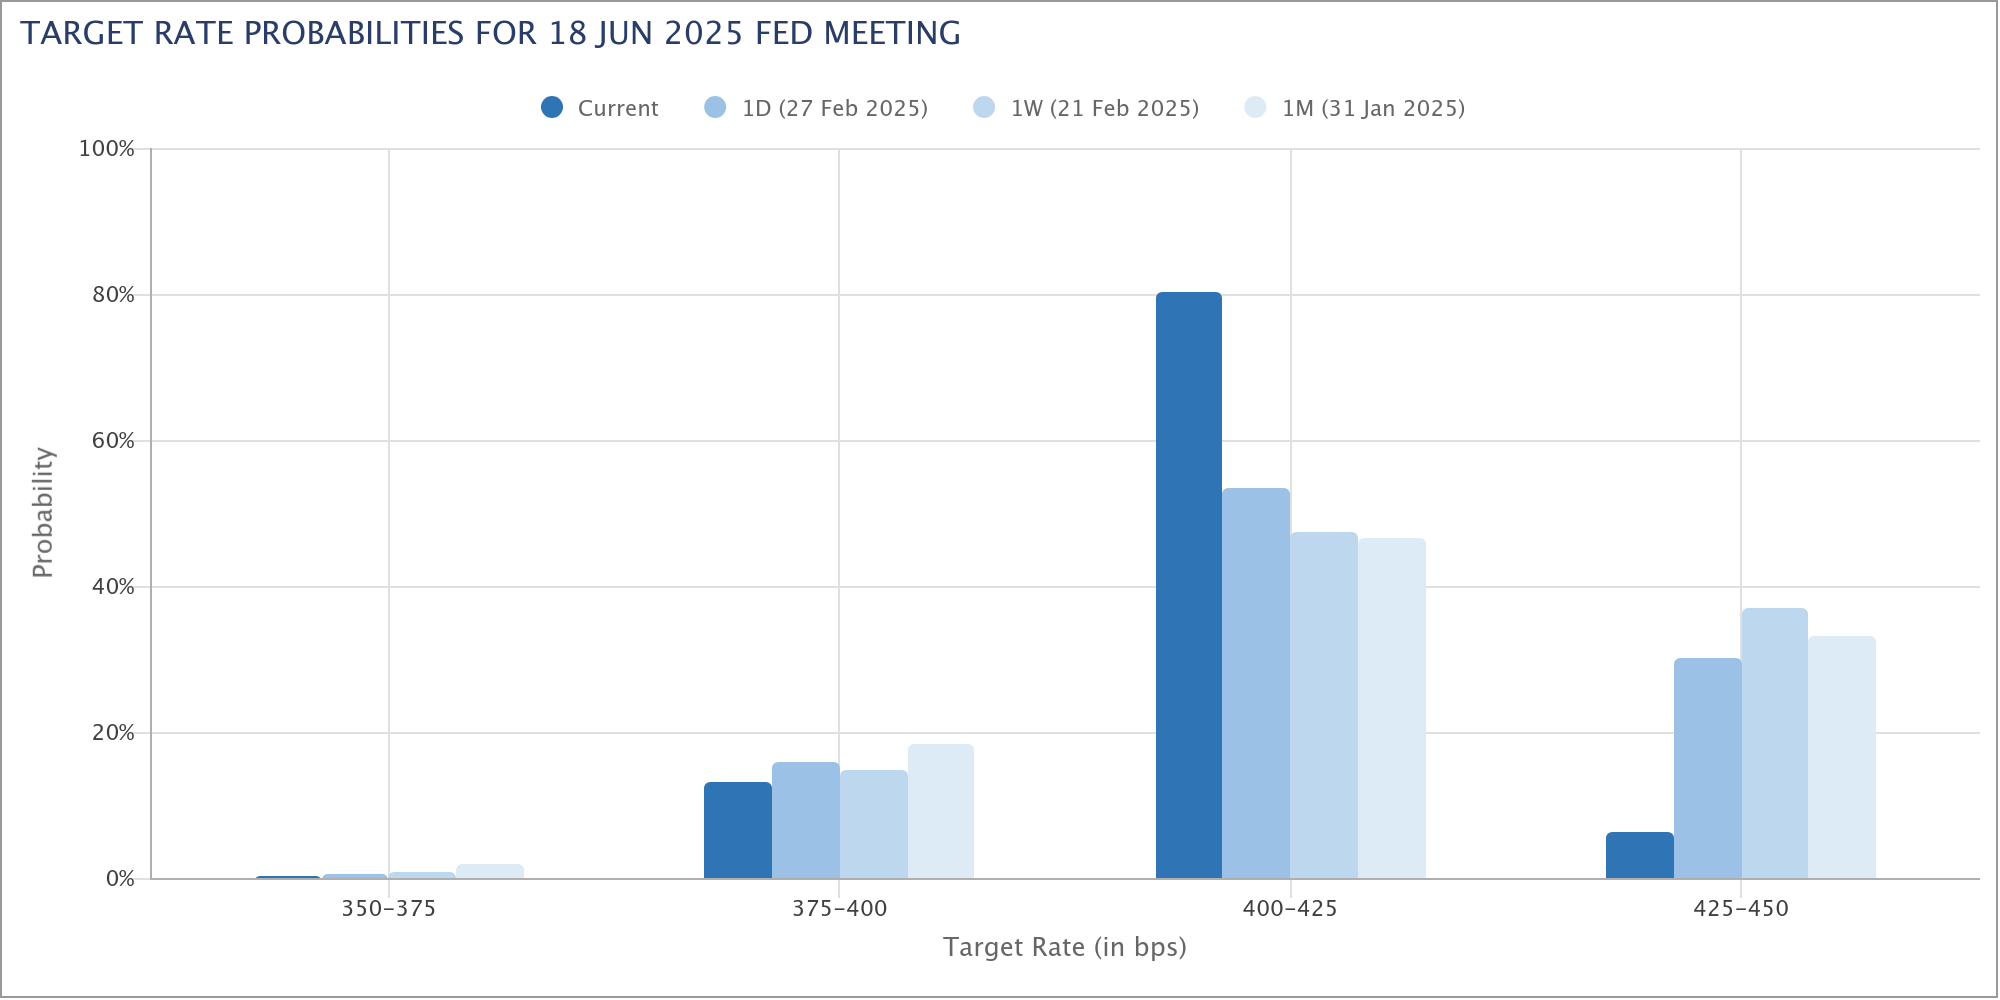
With these headwinds and decline in PCE core inflation as released on Friday, expectations for another Fed rate cut in the first half of the year continued to rise. Fed fund futures now price in a 94% probability of a 25bps cut to 4.00%-4.25% in June, up significantly from 63% just a week ago. This growing optimism about resumed Fed easing has provided some support to market sentiment. But it remains unclear whether it will be enough to reverse the pre-dominating risk-off mood or merely slow the pace of decline.
Technically, NASDAQ is tentatively drawing support from 38.2% retracement of 15708.53 to 20204.58 at 18487.09. Strong rebound from current level, followed by firm break of 55 D EMA (now at 19440.85) will suggest that the corrective pattern from 20204.58 has completed. That will also keep the medium term up trend intact for another rally through 20204.58 at a later stage.
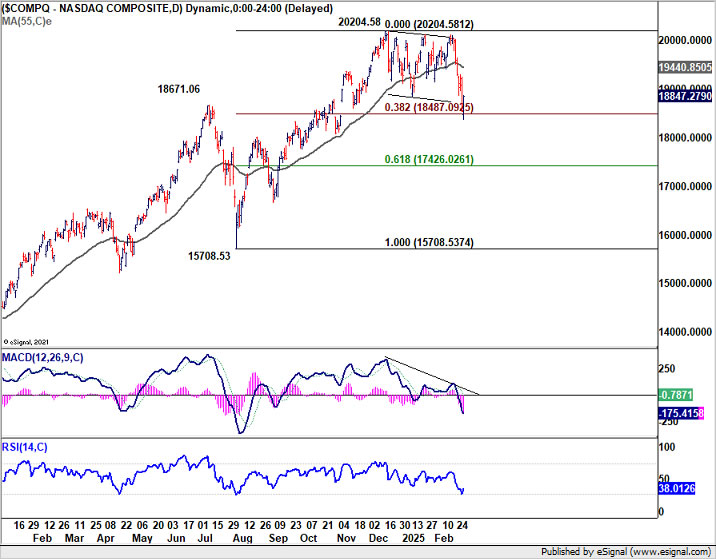
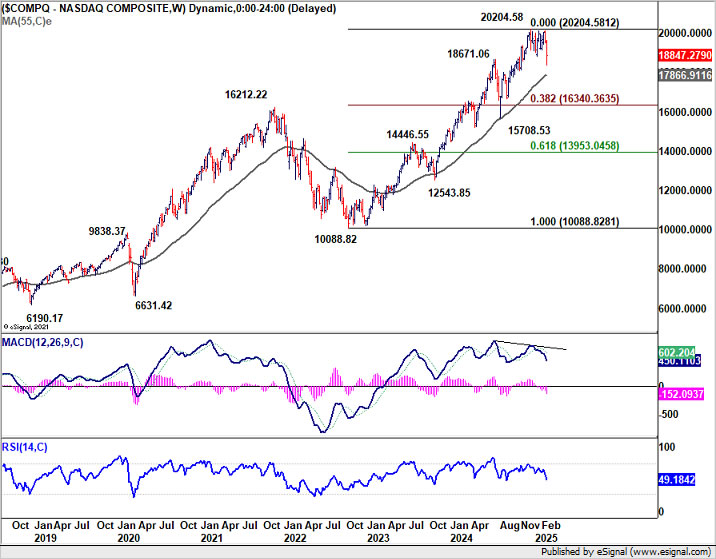
However, sustained break of 18487.09 will raise the chance that a larger scale correction has already started. In the bearish case, NASDAQ should be correcting whole uptrend from 10088.82 (2022 low). Further break of 55 W EMA (now at 17866.91) will confirm this bearish case and pave the way to 38.2% retracement of 10088.82 to 20204.58 at 16340.36.
Risk Aversion Drags Yields Down, But Lifts Dollar Higher
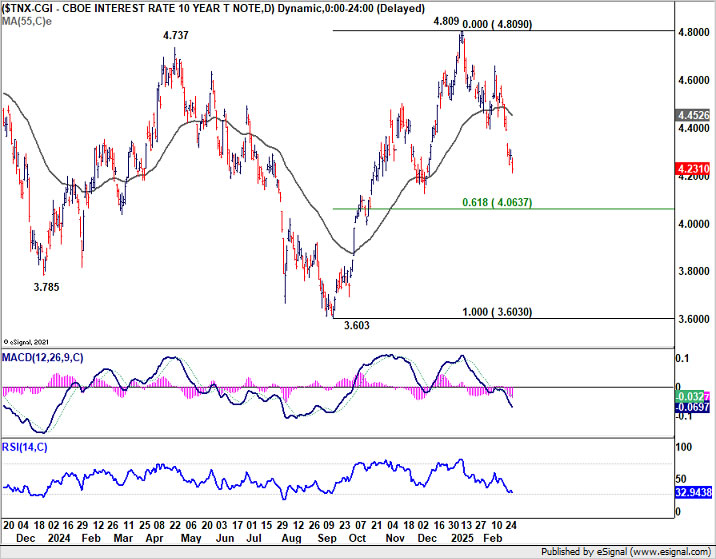
Risk aversion was also evident in the US bond markets, with 10-year Treasury yield tumbling sharply to its lowest level since December. The sharp drop highlights growing concerns over economic uncertainty and trade tensions.
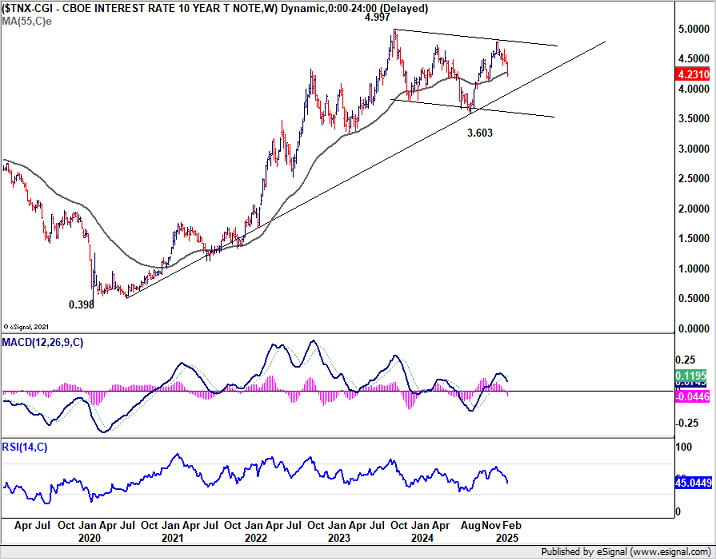
Technically, current development suggests that rise from 3.603 (2024 low) has completed at 4.809 already, well ahead of 4.997 (2023 high). Current fall is seen as another downleg in the sideway corrective pattern from 4.997. Deeper decline is expected to 61.8% retracement of 3.603 to 4.809 at 4.063 next. Risk will stay on the downside as long as 55 D EMA (now at 4.452) holds, in case of recovery.
Dollar Index clear reacted more to risk aversion than falling yields and Fed cut expectations. The's strong bounce towards the end of the week and the break of 55 D EMA (now at 107.31) suggests that fall from 110.17 has completed at 106.12. That came after defending 38.2% retracement of 100.15 to 110.17 at 106.34. Further rise should be seen to 108.52 resistance. Firm break there will target a retest on 110.17 high.
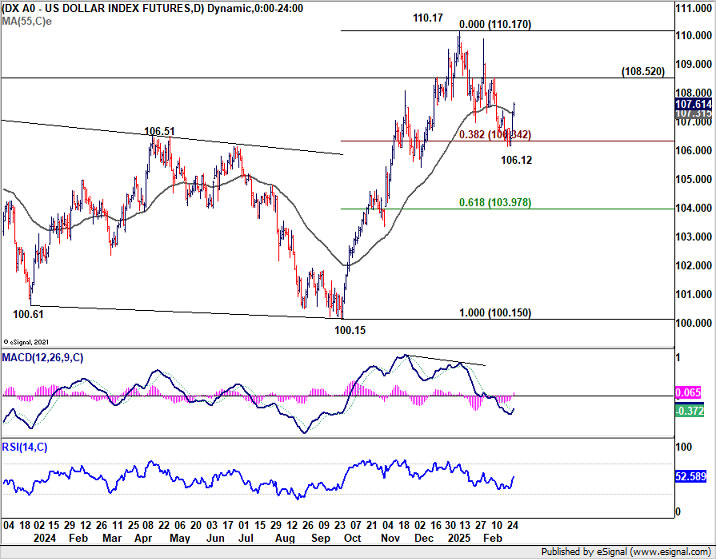
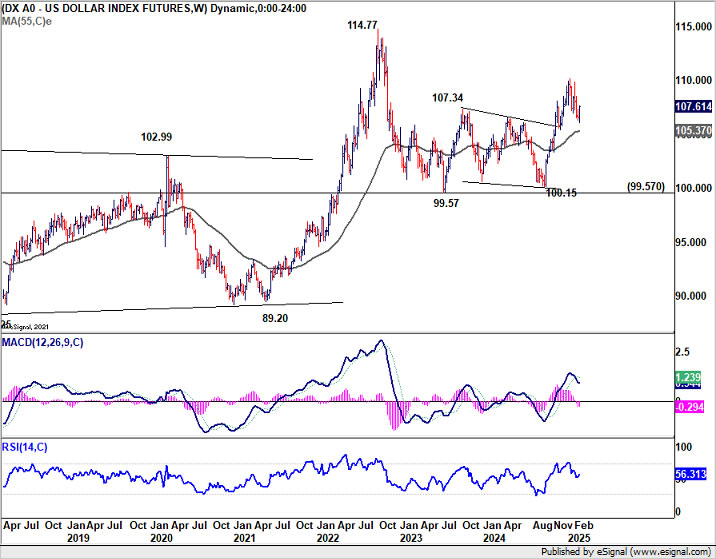
In the bigger picture, Dollar Index is holding comfortably above 55 W EMA (now at 105.37), and thus rise from 100.15 and 99.57 should still be intact. Break of 110.17 will pave the way back to 114.77 (2022 high) at a later stage.
NZD/USD and AUD/USD Sink, Eye 2025 Lows for Support
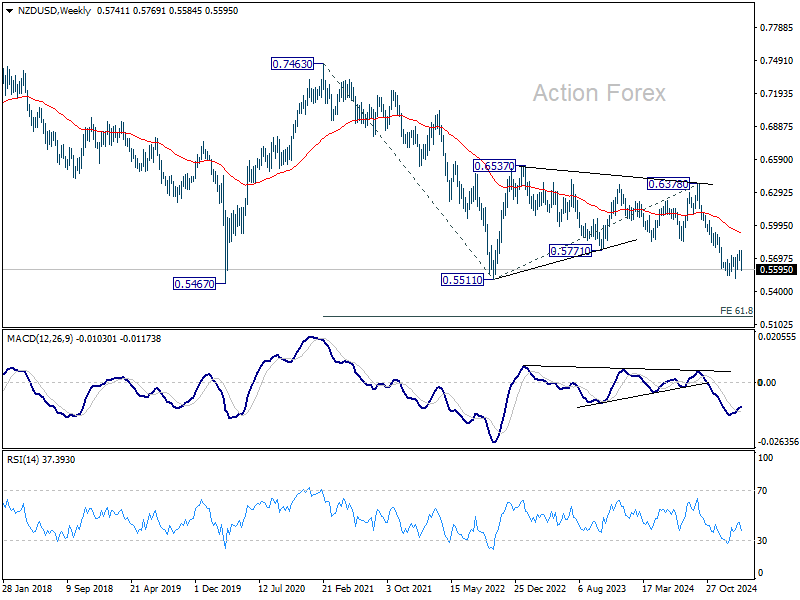
Kiwi and Aussie were the worst-performing currencies last week, each losing around -2.4% against the greenback. With risk sentiment deteriorating downside pressure on these two currencies could persistent. The key focus now is whether risk aversion would intensify and push NZD/USD and AUD/USD through this year's lows to resume the long term down trend. There these key support levels could offer a breather to them.
Technically, NZD/USD's steep decline last week suggests that corrective rebound from 0.5515 should have completed at 0.5571 already. Retest of 0.5515 should be seen next. Strong support from there could bring rebound to extend the corrective pattern with another rising leg. But outlook will stay bearish as long as 38.2% retracement of 0.6378 to 0.5515 at 0.5848 holds. Firm break of 0.5515 will resume the long term down trend to 61.8% projection of 0.7463 to 0.5511 from 0.6378 at 0.5172.

Similarly, AUD/USD's corrective rebound from 0.6087 should have completed at 0.6407. Retest of 0.6087 low should be seen next. Strong rebound from there would extend the corrective pattern with another rising leg. But outlook will stay bearish as long as 38.2% retracement of 0.6941 to 0.6087 at 0.6413 holds. Firm break of 0.6087 will resume the long term down trend to 61.8% projection of 0.8006 to 0.6169 from 0.6941 at 0.5806.
Bitcoin and Gold Tumble on Risk-Off Sentiment
Bitcoin and Gold struggled under renewed risk aversion last week, extending their losses in line with broader market weakness. While Gold retains a comparatively better outlook, both assets remain vulnerable to ongoing volatility.
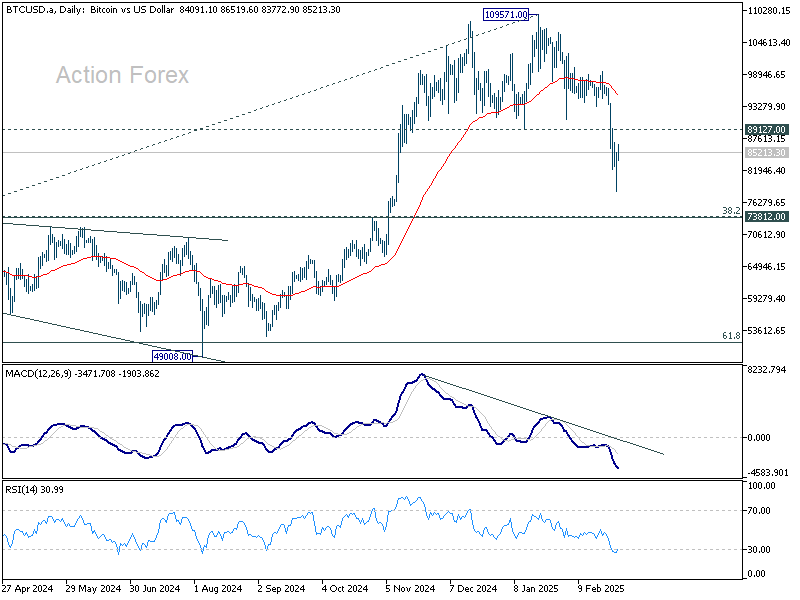
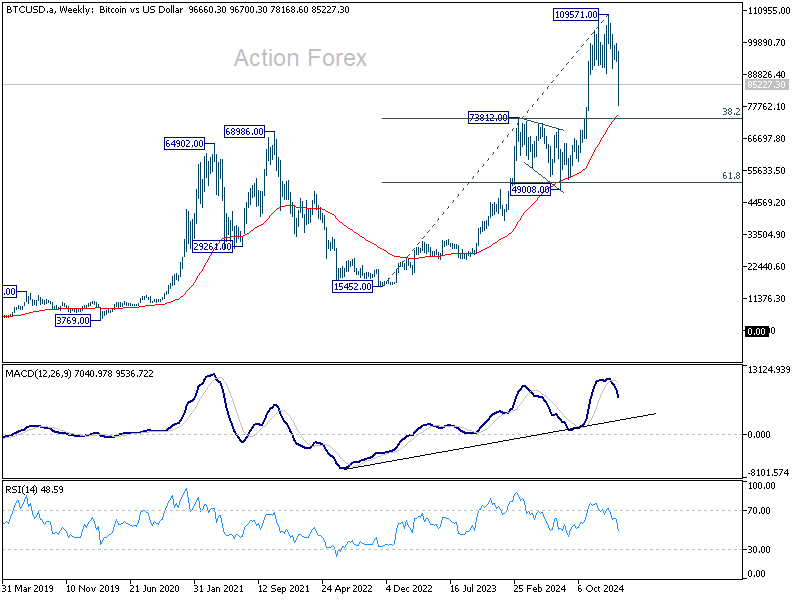
Bitcoin suffered a sharp fall, decisively breaking 89127 support, confirming medium-term topping at 109571. The current slide is seen as a correction of the entire uptrend from the 15452 (2022 low). Deeper decline toward 55 W EMA (now at 74129) is expected.
Strong support could emerge from the 73812 cluster zone (38.2% retracement of 15452 to 109571 at 73617) to bring rebound, at least first attempt. However, downside risks remain as long as 55 D EMA (now at 95288) caps any recovery.
Decisive break of 73617/73812 zone could extended the decline to 50k mark, which is close to 49008 support and 61.8% retracement at 51405.
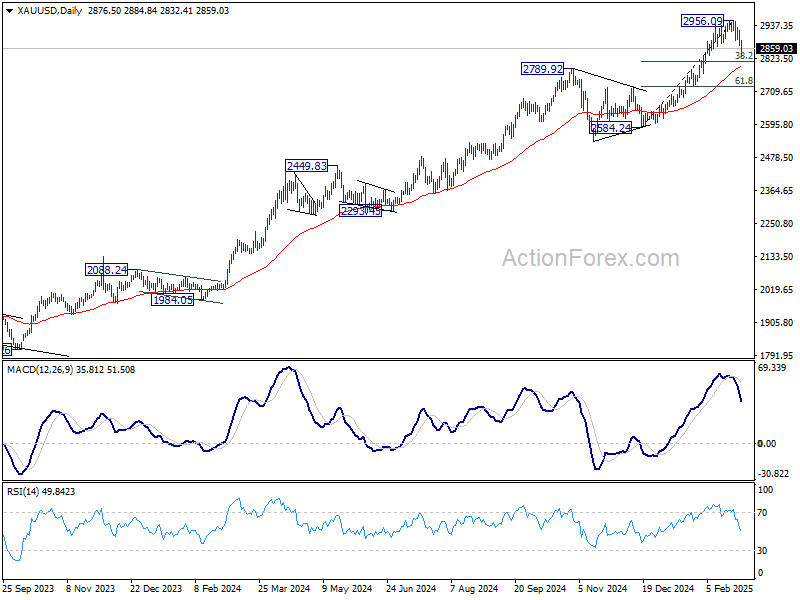
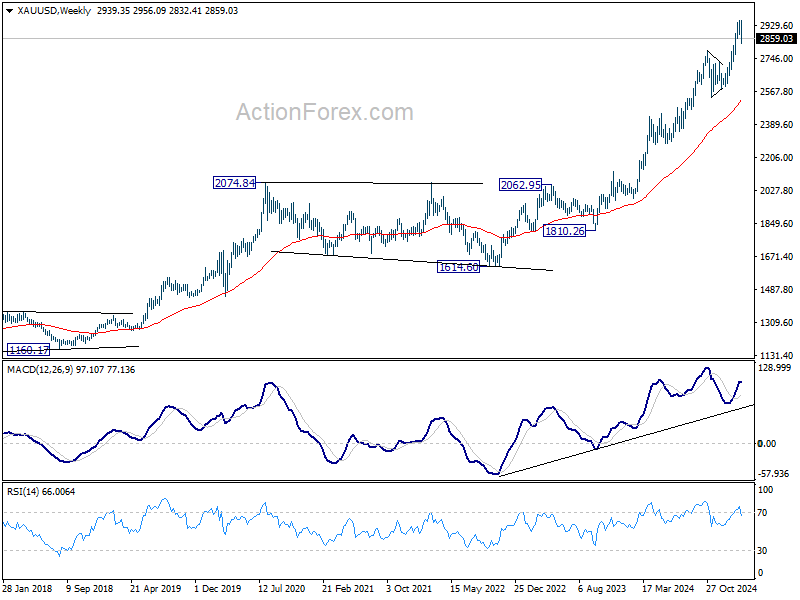
By contrast, Gold’s outlook is less overtly bearish. 2956.09 is seen as a short term top only, for now. Subsequent pullback is viewed primarily as a correction of the rise from 2584.24. Strong support might be seen from 55 D EMA (now at 2792.05) to bring rebound, and set the base for uptrend resumption at a later stage.
However, considering that Gold was just rejected by 3000 psychological level sustained trading below 55 D EMA would argue that larger scale correction in underway. In the bearish case, Gold could be starting a medium term decline back to 55 W EMA (now at 2522.33).
EUR/USD Weekly Outlook
EUR/USD reversed after edging higher to 1.0527 last week, and the development suggests that consolidation from from 1.0176 has already completed. Initial bias stays on the downside this week for retesting 1.0176/0210 support zone first. Firm break there will resume whole fall from 1.1213, and carry larger bearish implications. On the upside, above 1.0419 minor resistance will turn intraday bias neutral. But outlook will stay bearish as long as 38.2% retracement of 1.1213 to 1.0176 at 1.0572 holds.
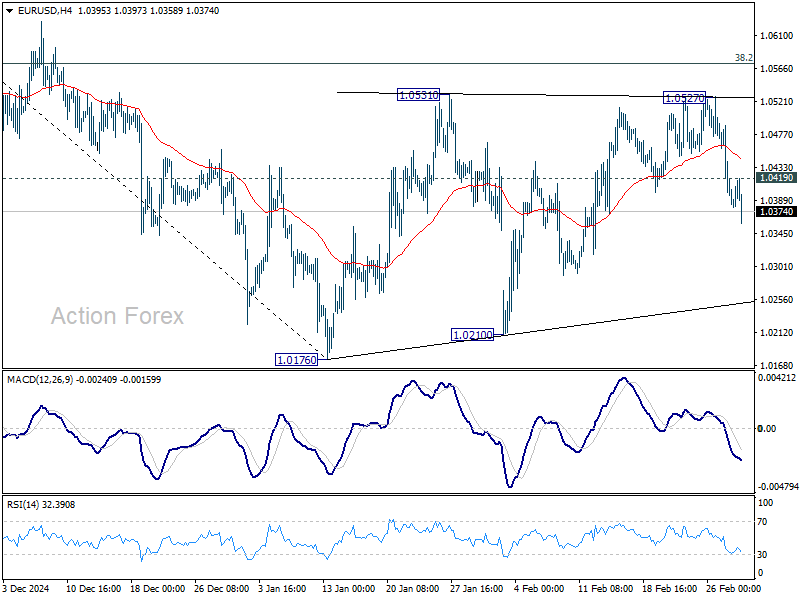
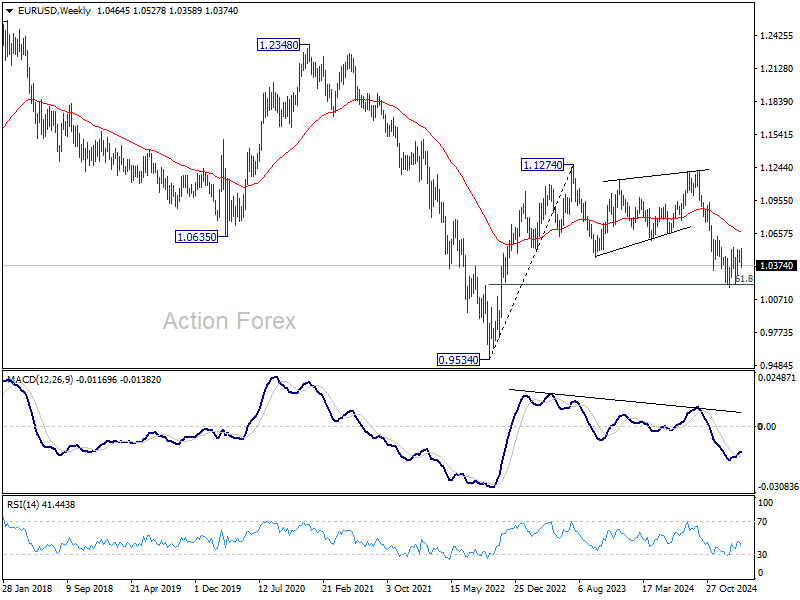
In the bigger picture, immediate focus is on 61.8 retracement of 0.9534 (2022 low) to 1.1274 (2024 high) at 1.0199. Sustained break there will solidify the case of medium term bearish trend reversal, and pave the way back to 0.9534. However, reversal from 1.0199 will argue that price actions from 1.1274 are merely a corrective pattern, and has already completed.
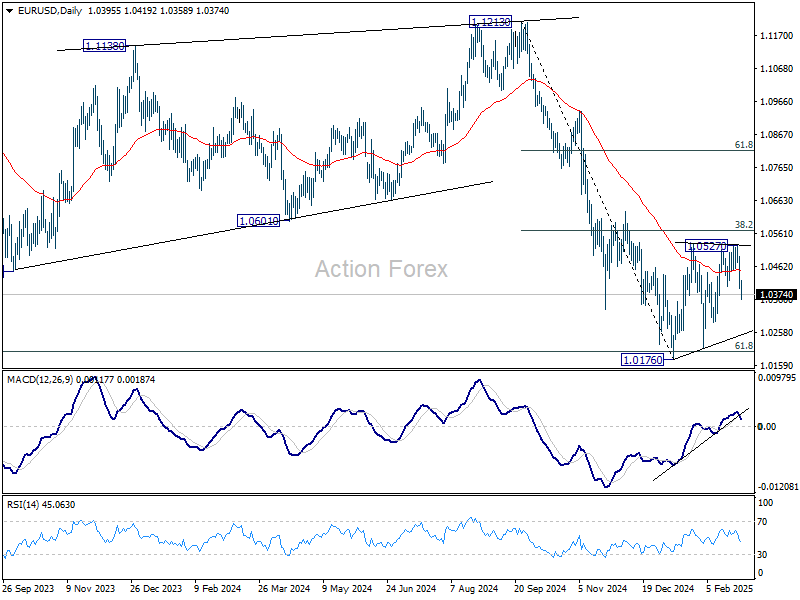
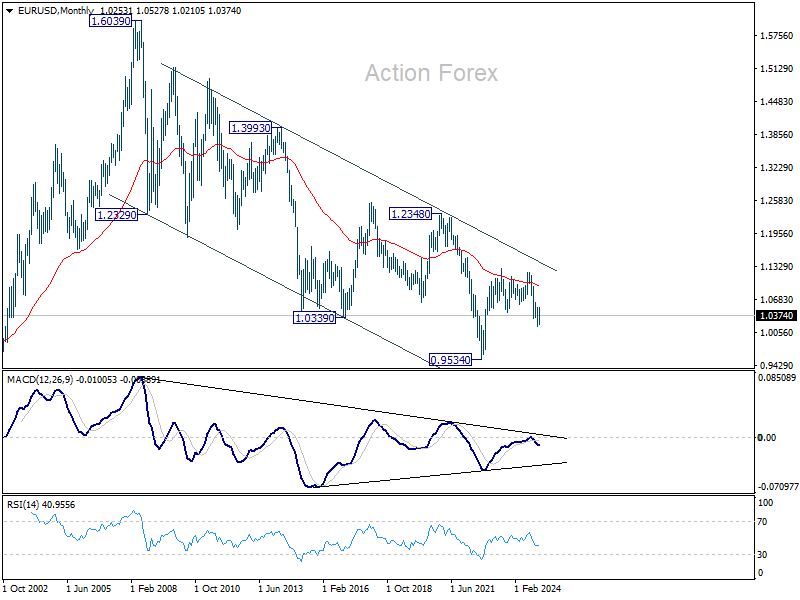
In the long term picture, down trend from 1.6039 remains in force with EUR/USD staying well inside falling channel, and upside of rebound capped by 55 M EMA (now at 1.0929). Consolidation from 0.9534 could extend further and another rising leg might be seem. But as long as 1.1274 resistance holds, eventual downside breakout would be mildly in favor.