Sample Category Title
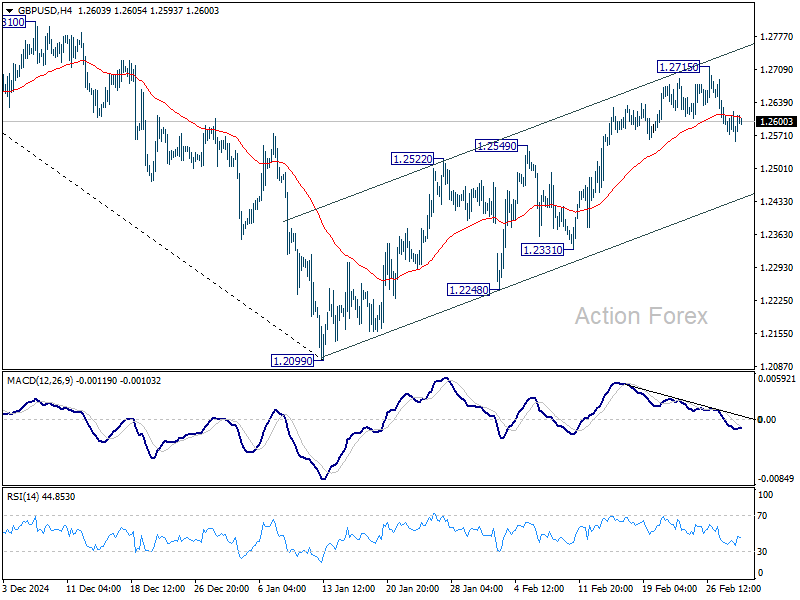
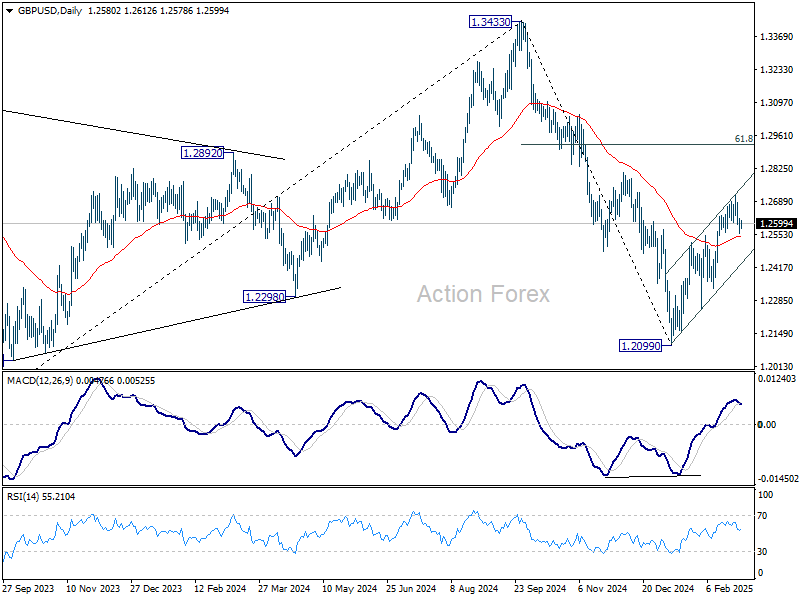
GBP/USD Daily Outlook
Daily Pivots: (S1) 1.2549; (P) 1.2585; (R1) 1.2612; More...
Intraday bias in GBP/USD stays mildly on the downside at this point. Fall from 1.2715 short term top would extend to near term rising channel support (now at 1.2439). Sustained break there will indicate that corrective rebound from 1.2099 has already completed. Nevertheless, above 1.2715 will resume the rebound to 1.2810 resistance next.
In the bigger picture, rise from 1.0351 (2022 low) should have already completed at 1.3433 (2024 high), and the trend has reversed. Further fall is now expected as long as 1.2810 resistance holds. Deeper decline should be seen to 61.8% retracement of 1.0351 to 1.3433 at 1.1528, even as a corrective move. However, firm break of 1.2810 will dampen this bearish view and bring retest of 1.3433 high instead.
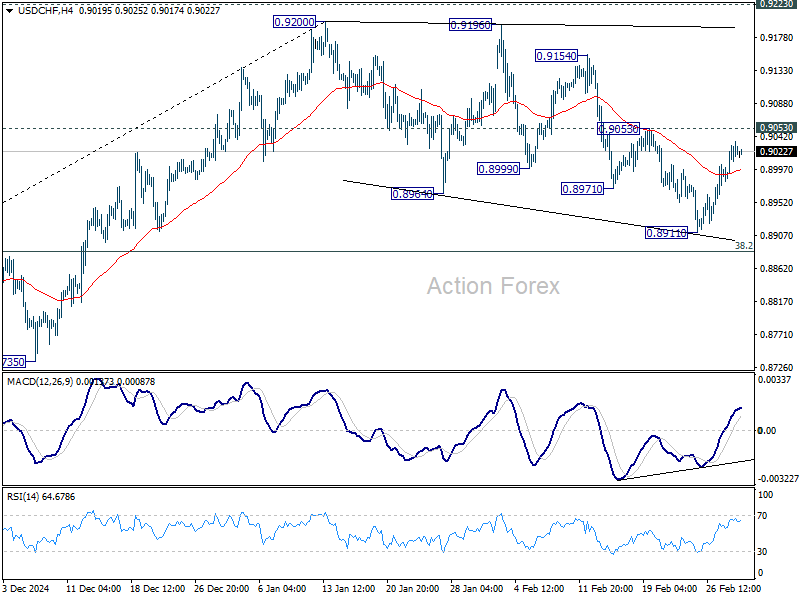
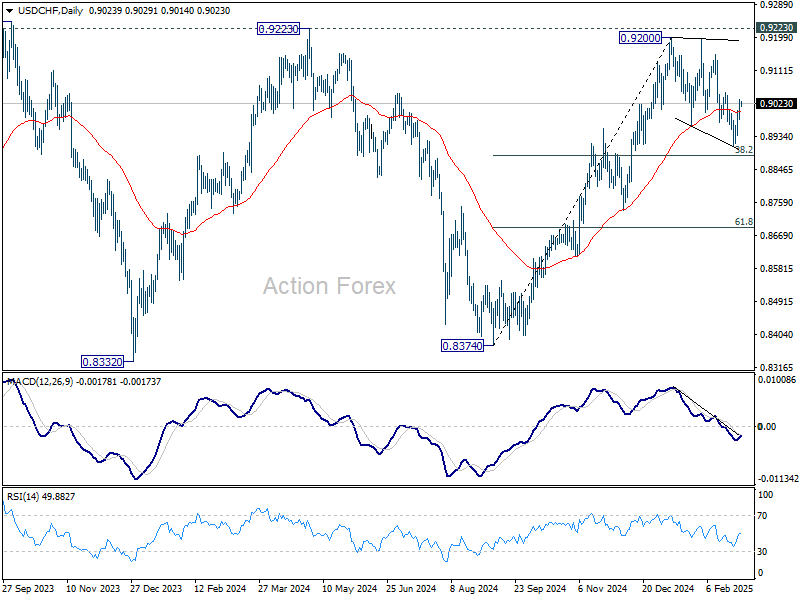
USD/CHF Daily Outlook
Daily Pivots: (S1) 0.8996; (P) 0.9017; (R1) 0.9050; More…
Intraday bias in USD/CHF remains neutral for the moment. On the upside, firm break of 0.9053 will suggest that corrective pattern from 0.9200 has already completed at 0.8911. Further rally should then be seen to retest 0.9200 resistance. In case of another fall, downside should be contained by 38.2% retracement of 0.8374 to 0.9200 at 0.8884 to bring rebound.
In the bigger picture, decisive break of 0.9223 resistance will argue that whole down trend from 1.0342 (2017 high) has completed with three waves down to 0.8332 (2023 low). Outlook will be turned bullish for 1.0146 resistance next. Nevertheless, rejection by 0.9223 will retain medium term bearishness for another decline through 0.8332 at a later stage.
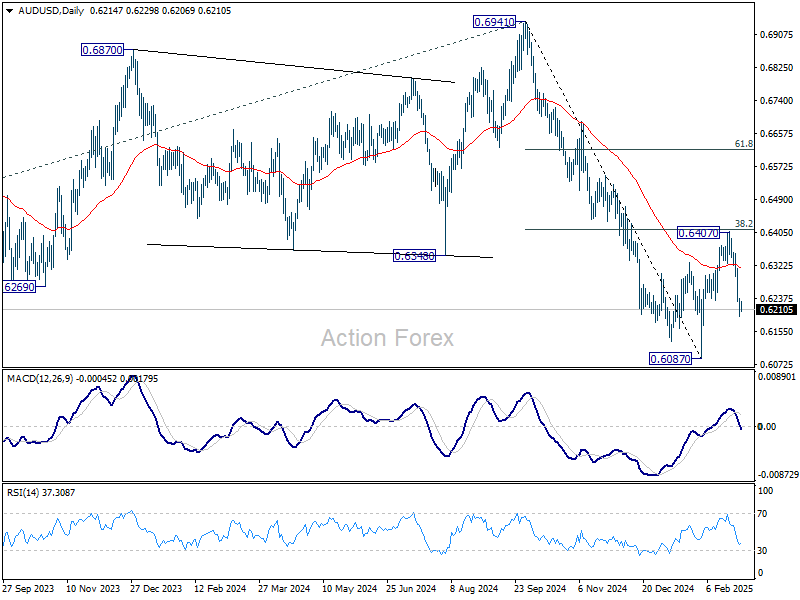
AUD/USD Daily Report
Daily Pivots: (S1) 0.6207; (P) 0.6261; (R1) 0.6291; More...
Intraday bias in AUD/USD stays on the downside at this point. Corrective rebound from 0.6087 should have completed at 0.6407, ahead of 38.2% retracement of 0.6941 to 0.6087 at 0.6413. Deeper fall should be seen for retesting 0.6087 low. Firm break there will resume whole decline from 0.6941. On the upside, above 0.6254 minor resistance will turn intraday bias neutral first.
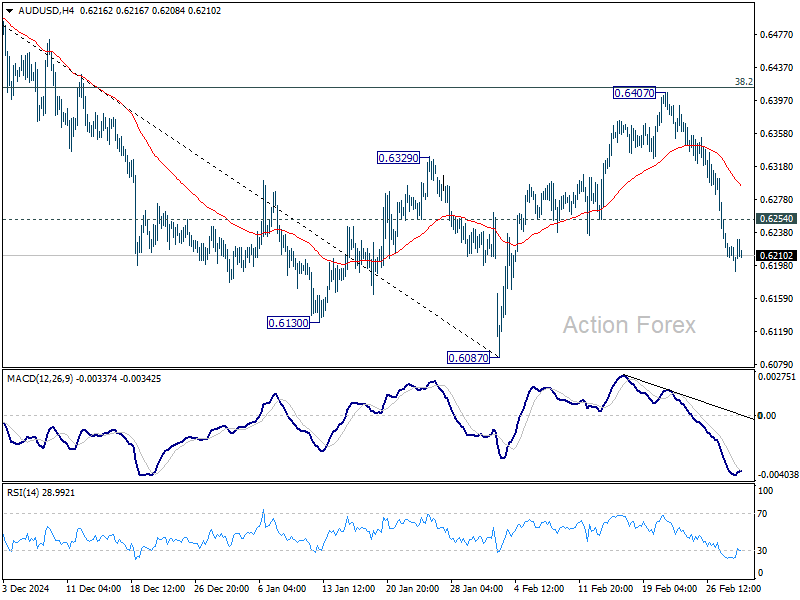
In the bigger picture, fall from 0.6941 (2024 high) is seen as part of the down trend from 0.8006 (2021 high). Next medium term target is 61.8% projection of 0.8006 to 0.6169 from 0.6941 at 0.5806. In any case, outlook will stay bearish as long as 55 W EMA (now at 0.6494) holds.
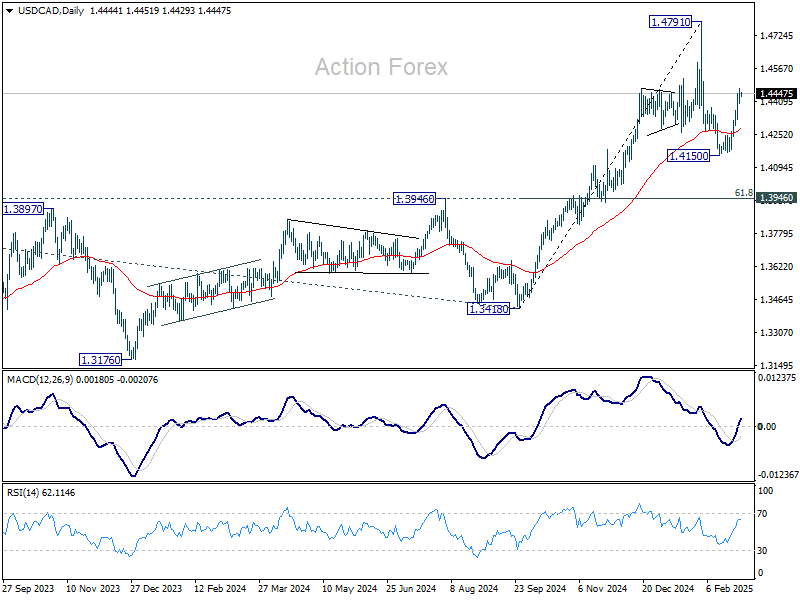
USD/CAD Daily Outlook
Daily Pivots: (S1) 1.4420; (P) 1.4446; (R1) 1.4492; More...
Intraday bias in USD/CAD remains on the upside at this point. Corrective pull back from 1.4791 should have completed at 1.4150 already. Further rise should be seen to retest 14791 high. Strong resistance might be seen there to limit upside on first attempt. But decisive break there will confirm resumption of larger up trend. On the downside, below 1.4398 minor support will turn intraday bias neutral again first.
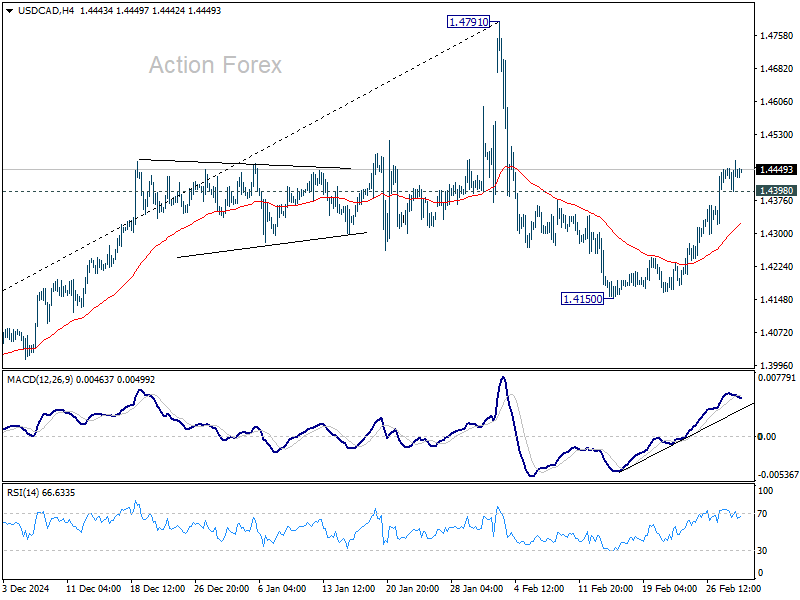
In the bigger picture, long term up trend is tentatively seen as resuming with prior breach of 1.4667/89 key resistance zone (2020/2015 highs). Next target is 100% projection of 1.2401 to 1.3976 from 1.3418 at 1.4993. This will remain the favored case as long as 1.3976 resistance turned support holds (2022 high), even in case of deep pullback.
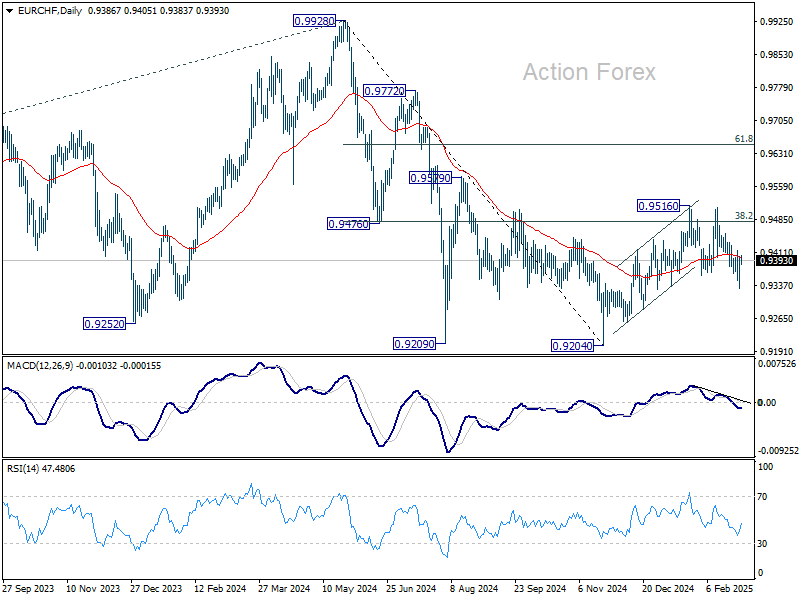
EUR/CHF Daily Outlook
Daily Pivots: (S1) 0.9333; (P) 0.9369; (R1) 0.9404; More....
Intraday bias in EUR/CHF remains neutral for the moment, but further decline is expected with 0.9414 resistance intact. Corrective rise from 0.9204 could have completed at 0.9516 already. Below 0.9331 will target a retest on this low. However, break of 0.9414 resistance will mix up the near term outlook again.
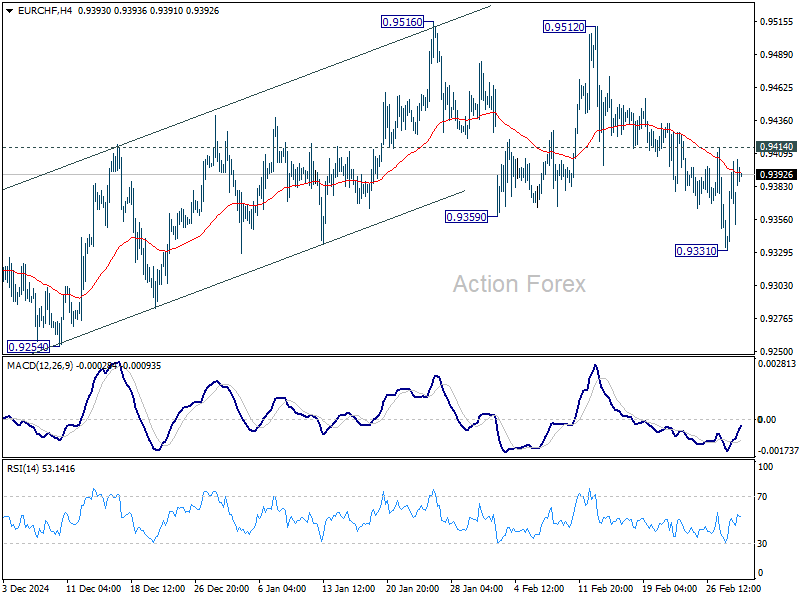
In the bigger picture, sustained trading above 38.2% retracement of 0.9928 to 0.9204 at 0.9481 should confirm that whole fall from 0.9928 has completed at 0.9204. Further rally should then be seen back to 61.8% retracement at 0.9651 and above. However, another rejection by 0.9481 will keep outlook bearish for extending larger down trend through 0.9204 at a later stage.
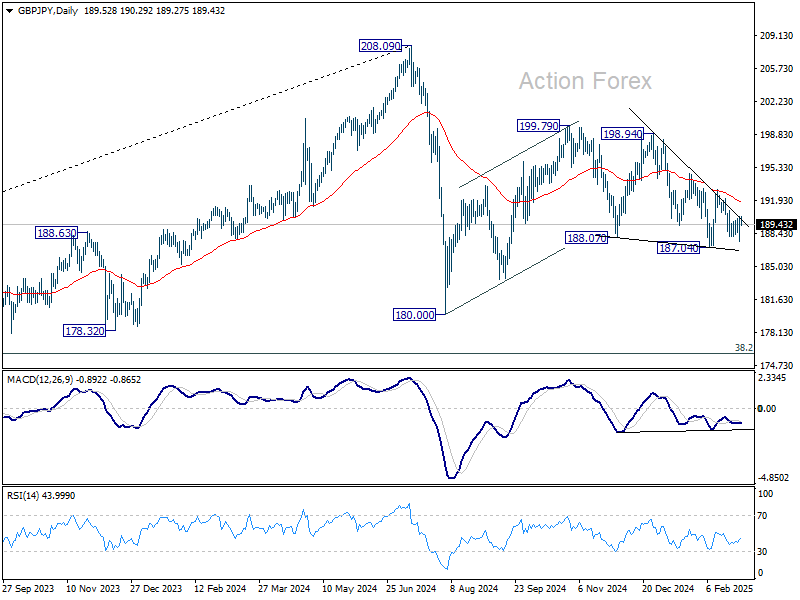
GBP/JPY Daily Outlook
Daily Pivots: (S1) 188.00; (P) 189.16; (R1) 190.62; More...
Intraday bias in GBP/JPY remains neutral and outlook is unchanged. Further decline is in favor as long as 193.04 resistance holds. On the downside, firm break of 187.04 will extend the fall from 199.79 towards 180.00 support. That will also raise the chance that correction from 208.09 is resuming downward.
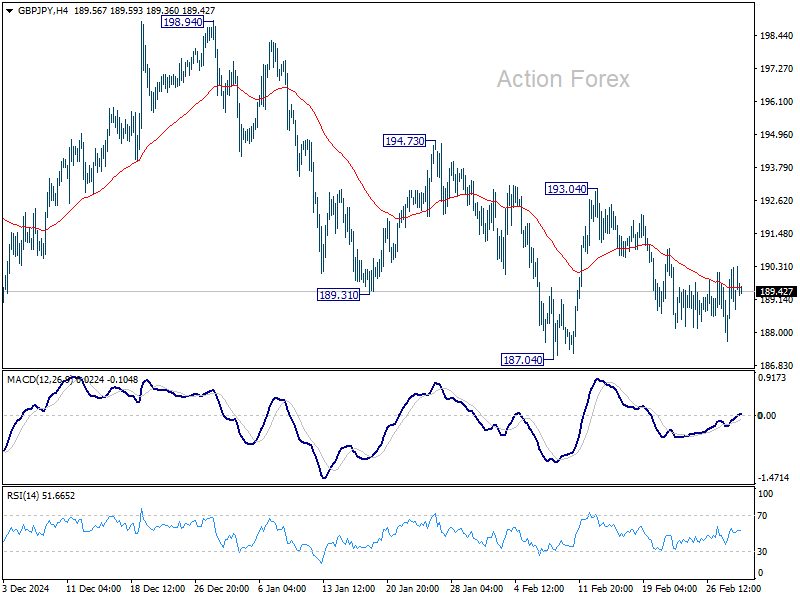
In the bigger picture, price actions from 208.09 are seen as a correction to rally from 123.94 (2020 low). Strong support should be seen from 38.2% retracement of 123.94 to 208.09 at 175.94 to contain downside. However, sustained break of 152.11 will bring deeper fall even still as a correction.
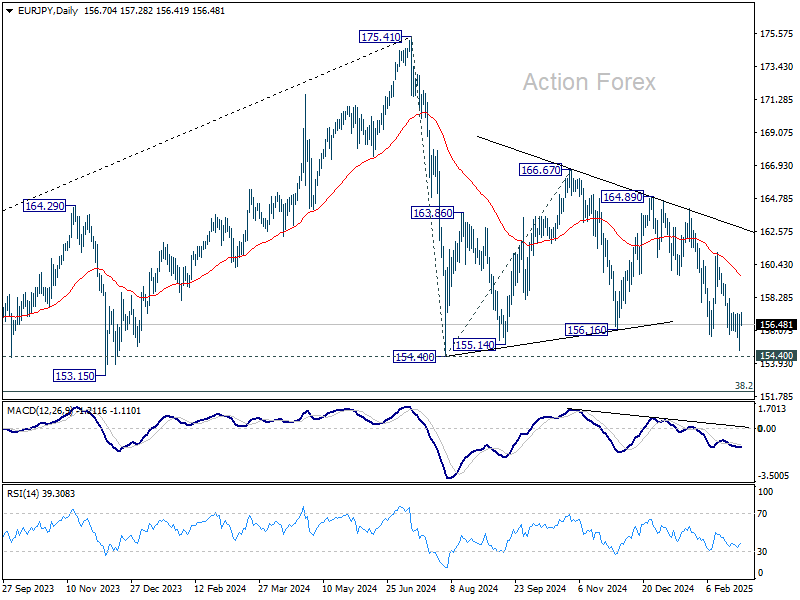
EUR/JPY Daily Outlook
Daily Pivots: (S1) 155.00; (P) 156.08; (R1) 157.37; More...
Intraday bias in EUR/JPY remains neutral and further decline is expected with 158.19 resistance intact. Below 154.77 will target 154.40 key support. Firm break there will confirm resumption of whole decline from 175.41 and target 152.11 fibonacci level next.
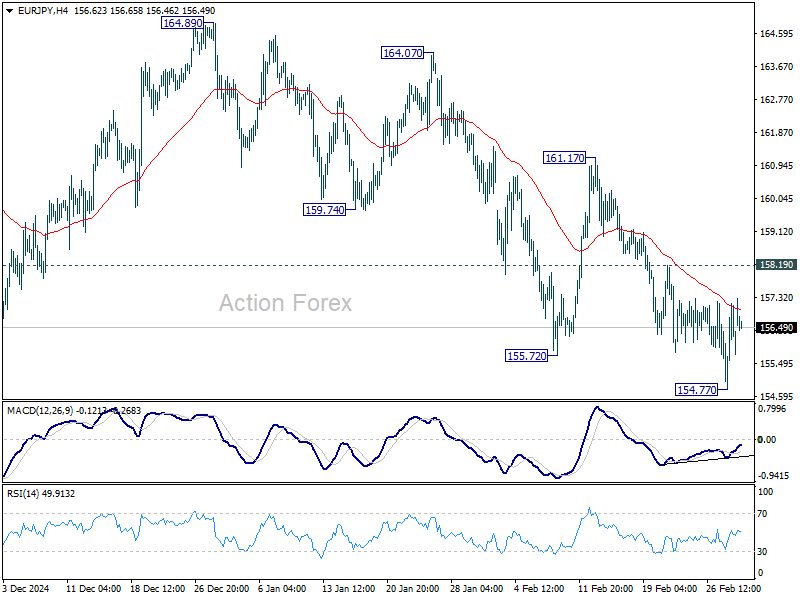
In the bigger picture, price actions from 175.41 are seen as correction to rally from 114.42 (2020 low). Strong support should be seen from 38.2% retracement of 114.42 to 175.41 at 152.11 to contain downside. However, sustained break of 152.11 will bring deeper fall even still as a correction. Next target will be 100% projection of 175.41 to 154.40 from 166.67 at 145.66.
EUR/GBP Daily Outlook
Daily Pivots: (S1) 0.8238; (P) 0.8256; (R1) 0.8271; More...
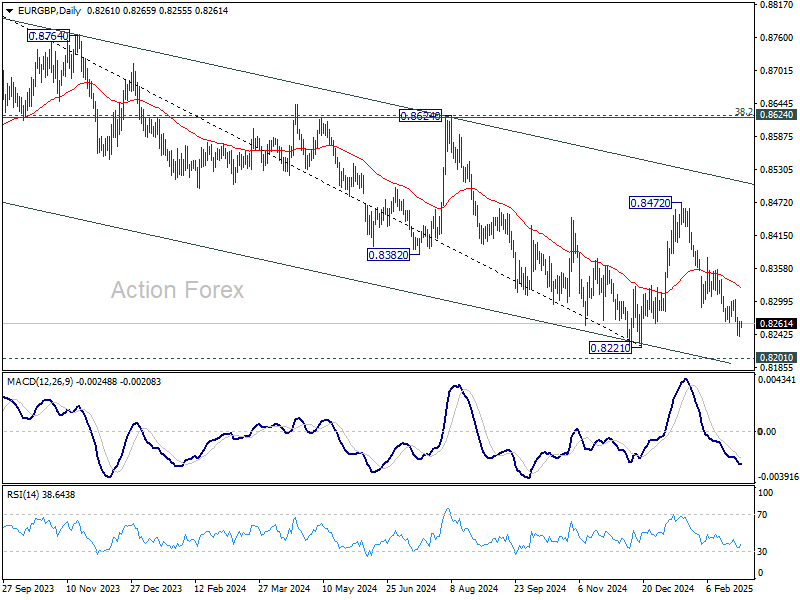
Further decline is expected in EUR/GBP as long as 0.8304 resistance holds. Fall from 0.8472 would target a test on 0.8201/21 key support zone. Decisive break there will carry larger bearish implications. Nevertheless, firm break of 0.8304 will indicate short term bottoming, and turn bias back to the upside for stronger rebound.
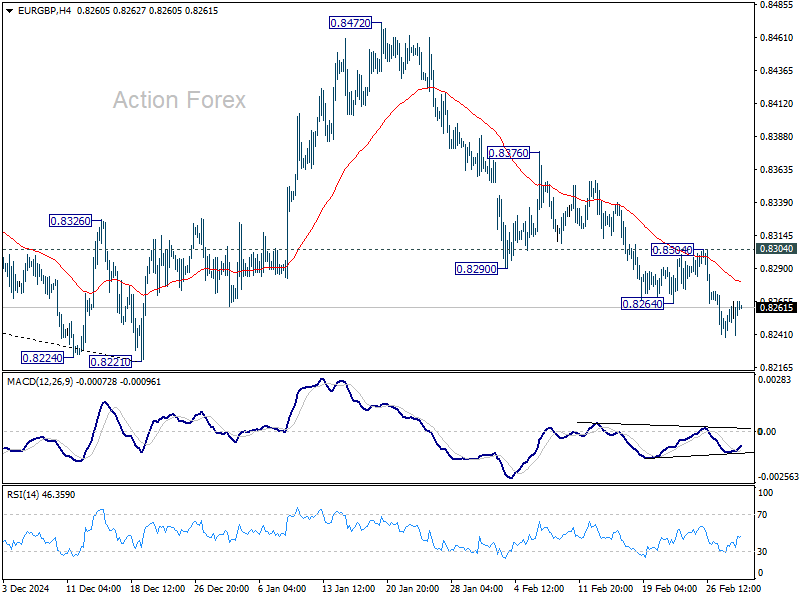
In the bigger picture, the medium term down trend remains intact with EUR/GBP staying well inside the falling channel. Prior rejection by 55 W EMA (now at 0.8414) also affirm bearishness. Decisive break of 0.8201/8221 support zone will resume whole down trend from 0.9449 (2020 high) and carry larger bearish implications.
Bitcoin Roars Back as Trump Plans Strategic Crypto Reserve; Tariffs, Geopolitics, NFP and ECB to Move Markets
Bitcoin led the charge in an otherwise quiet Asian session, rebounding over 20% from last week’s low after a major announcement from US President Donald Trump. The cryptocurrency sector saw dramatic relief from its steep selloff last week, as Trump revealed the creation of a strategic crypto reserve, including Bitcoin, Solana, XRP, and other digital assets.
The wording of the post also drew attention, with Trump emphasizing that BTC and ETH would be at the “heart of the reserve.” Unlike a simple stockpile, which implies holding onto existing government-owned crypto assets, a reserve suggests active purchases in regular installments.
However, the move has not been without criticism. Crypto purists argue that Bitcoin and other decentralized assets were created to exist outside government control, and they reject the notion of a nation-state amassing a large share of the market. Some others see the announcement as politically motivated rather than a structural shift in policy, raising concerns about long-term regulatory implications.
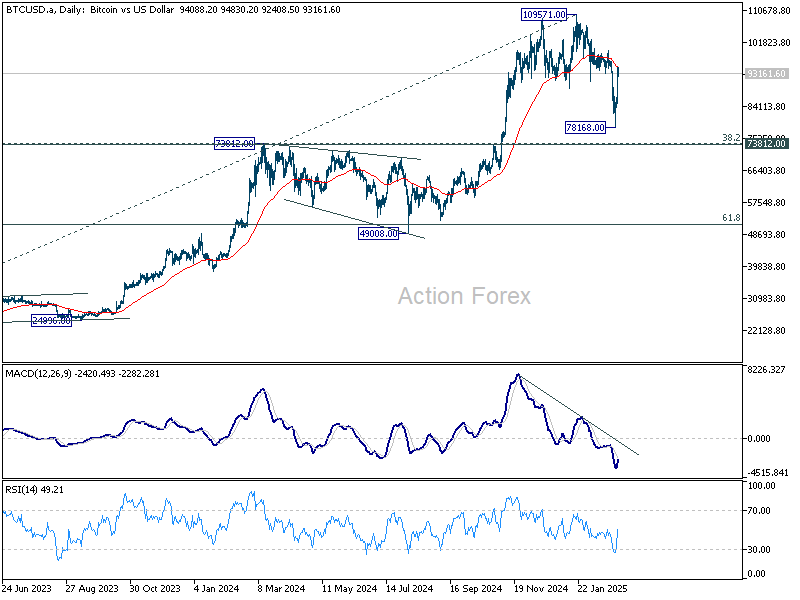
Technically, Bitcoin's strong rebound ahead of 73812 cluster zone (38.2% retracement of 15452 to 109571 at 73617) suggests that price actions from 10957 are likely forming a medium term consolidation pattern only, rather than bearish trend reversal. Sustained trading above 55 D EMA (now at 95271) will solidify this bullish case, and extend range trading below 109571 for a while before eventual upside breakout.
Meanwhile, in the currency markets, Euro is leading gains, followed by Sterling and Aussie. Dollar is the worst performer, trailed by Kiwi and Yen. Swiss Franc and Loonie are positioning in the middle.
Looking ahead, multiple US tariffs on Canada, Mexico, and China are set to take effect on Tuesday, March 4, and speculation is mounting over retaliatory measures. China has already hinted at countermeasures, including tariffs on U.S. agricultural products and non-tariff barriers.
On the geopolitical front, all eyes will be on the US response to a new UK-EU effort to draft a Ukraine peace plan, a move coming on the heels of President Volodymyr Zelenskiy’s high-profile clash with Trump at the Oval Office just two days ago.
In addition, crucial US economic data, including non-farm payrolls and ISM manufacturing and services indexes, will be closely watched. Across the Atlantic, ECB is expected to cut interest rates again this week, continuing its “regular, gradual” easing.
In Asia, at the time of writing, Nikkei is up 1.70%. Hong Kong HSI is up 1.30%. China Shanghai SSE is up 0.32%. Singapore Strait Times is up 0.47%. Japan 10-year JGB yield is up 0.029 at 1.405.
Japan’s PMI manufacturing finalized at 49 in Feb, modest improvement but outlook remains weak
Japan’s manufacturing sector showed slight improvement in February, with PMI finalized at 49.0, up from 48.7 in January. However, the sector remains in contraction territory, reflecting ongoing struggles with weak demand.
According to Usamah Bhatti at S&P Global Market Intelligence, manufacturers cited soft global and domestic demand, with "muted conditions" in key markets such as the US, Europe, and China. Additionally, purchasing activity saw a solid and sustained decline.
The "near-term outlook remains clouded". Business confidence fell to its lowest level since mid-2020, driven by growing concerns over the impact of US trade policies and a slower-than-expected global economic recovery.
China’s Caixin PMI manufacturing rises to 50.8, but employment remains a concern
China’s Caixin PMI Manufacturing climbed to 50.8 in February, up from 50.1, exceeding expectations of 50.3.
Wang Zhe, Senior Economist at Caixin Insight Group, noted that new export orders rebounded, corporate purchasing increased, and logistics remained smooth. However, employment continued to decline, and output prices stayed weak.
Additionally, official PMI data released over the weekend further reinforced signs of recovery. The official PMI Manufacturing rebounded from 49.1 to 50.2, marking its highest level since November and moving back into expansionary territory. Additionally, the non-manufacturing PMI, which covers services and construction, ticked up to 50.4 from 50.2.
Market sentiment hinges on US NFP, ECB cut and other data to watch
While trade war and geopolitics might continue to dominate headlines, key economic events this week could also inject extra volatility into the markets.
The week’s most significant market-moving event could come from the US. February non-farm payrolls report will be a crucial test for investor sentiment, particularly after recent economic data—including consumer confidence, business activity, and retail sales—showed signs of weakness. Additionally, ISM manufacturing and services data will provide further insight into business conditions. The impact of tariffs on the economy is beginning to surface in economic data, and a set of disappointing data could amplify the emerging concerns.
It should noted that while a softer NFP print could bring forward expectations for a Fed rate cut, optimism about policy easing may be overshadowed by broader economic worries, which would drive further volatility across asset classes. The key is whether the job market can hold up against growing uncertainty, or if fears of a sharper slowdown will escalate.
ECB is widely anticipated to proceed with its “regular, gradual” approach to policy easing at its meeting this week, with a 25bps cut to the deposit rate, bringing it down to 2.50%. The latest Economic Bulletin suggests policymakers see neutral rate in the range of 1.75%-2.25%, implying that further rate reductions beyond this week's move will be calculated cautiously.
Analysts largely expect two more 25bps cuts by ECB in Q2 to bring an end to the cycle. But the outcome could vary depending on economic growth and inflation developments. Markets will closely analyze ECB’s updated economic projections hints on the central bank's view, at least the base case.
Eurozone inflation data will also be in the spotlight. February's flash CPI is expected to show headline inflation falling to 2.3%, following four consecutive months of increases. Core inflation, which has remained at 2.7% for five straight months, is projected to ease to 2.5%.
Beyond the US and Eurozone, Australia will also be in focus. Although RBA initiated its easing cycle in February, policymakers have remained cautious about further cuts. RBA meeting minutes will provide more details on the board’s thinking regarding the next steps. Additionally, Australia’s Q4 GDP and January retail sales data will offer insight into whether more imminent easing is necessary.
Other key data releases include Canada’s employment report and China’s Caixin PMIs.
Here are some highlights for the week
- Monday: Japan PMI manufacturing final; China Caixin PMI manufacturing; Swiss PMI manufacturing; Eurozone CPI flash, PMI manufacturing final; UK PMI manufacturing final; Canada PMI manufacturing; US ISM manufacturing, construction spending.
- Tuesday: New Zealand building permits; Japan unemployment rate, capital spending, monetary base, consumer confidence; Australia RBA minutes, retail sales; Eurozone unemployment rate.
- Wednesday: Australia GDP; China Caxin PMI services; Eurozone PMI services final, PPI; UK PMI services final; US ADP employment, ISM services, factory orders, Fed's Beige Book report.
- Thursday: Australia building permits, goods trade balance; Swiss unemployment rate; UK PMI construction; Eurozone retail sales, ECB rate decision, US jobless claims, trade balance; Canada Ivey PMI.
- Friday: China trade balance; Germany factory orders; Swiss foreign currency reserves; Eurozone GDP revision; Canada employment; US non-farm payrolls.
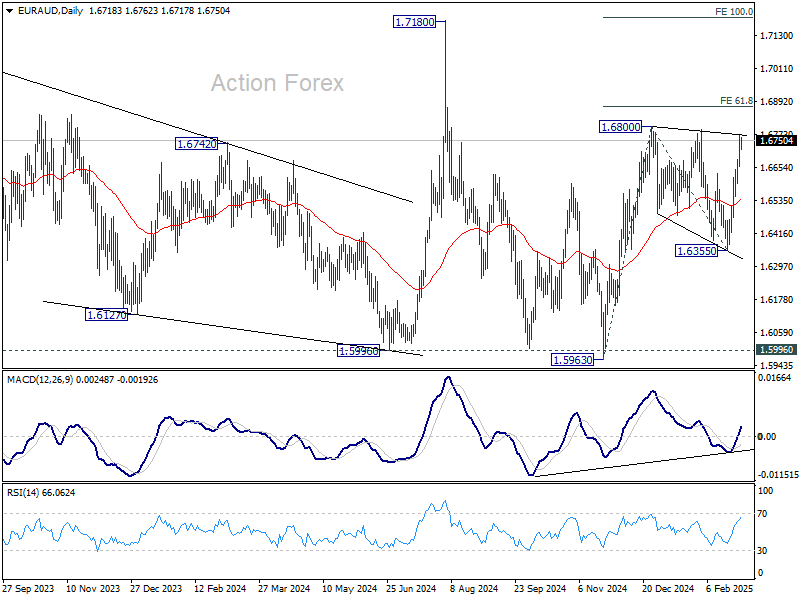
EUR/AUD Daily Outlook
Daily Pivots: (S1) 1.6660; (P) 1.6717; (R1) 1.6768; More...
Intraday bias in EUR/AUD stays on the upside for the moment. As noted before, consolidation from 1.6800 should have already completed with three waves down to 1.6355. Firm break of 1.6800 resume the rise from 1.5963 to 61.8% projection of 1.5963 to 136800 from 1.6355 at 1.6872, and then 100% projection at 1.7192, which is close to 1.7180 high. On the downside, below 1.6657 minor support will delay the bullish case and turn intraday bias neutral again first.
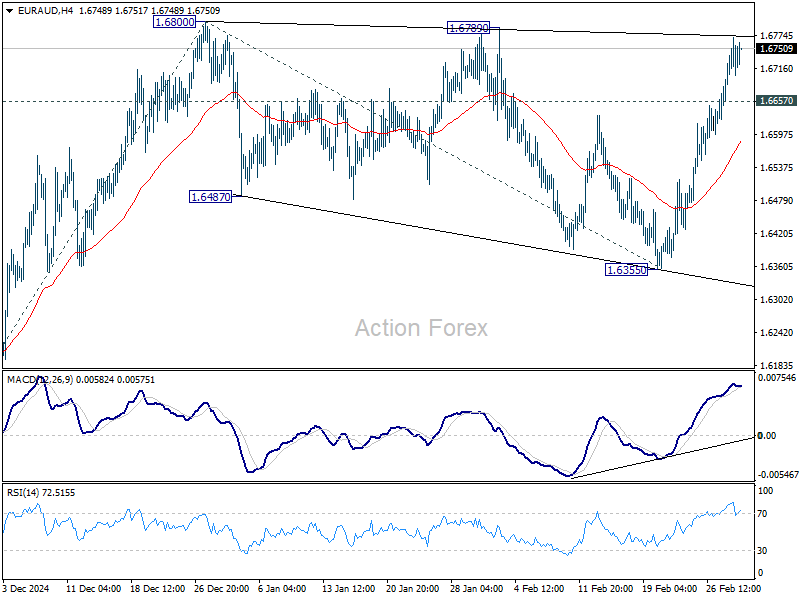
In the bigger picture, with 1.5996 key support (2024 low) intact, larger up trend from 1.4281 (2022 low) is still in favor to resume through 1.7180 at a later stage. Nevertheless, sustained break of 1.5996 will indicate that such up trend has completed and deeper decline would be seen.
EUR/AUD Daily Outlook
Daily Pivots: (S1) 1.6660; (P) 1.6717; (R1) 1.6768; More...
Intraday bias in EUR/AUD stays on the upside for the moment. As noted before, consolidation from 1.6800 should have already completed with three waves down to 1.6355. Firm break of 1.6800 resume the rise from 1.5963 to 61.8% projection of 1.5963 to 136800 from 1.6355 at 1.6872, and then 100% projection at 1.7192, which is close to 1.7180 high. On the downside, below 1.6657 minor support will delay the bullish case and turn intraday bias neutral again first.
In the bigger picture, with 1.5996 key support (2024 low) intact, larger up trend from 1.4281 (2022 low) is still in favor to resume through 1.7180 at a later stage. Nevertheless, sustained break of 1.5996 will indicate that such up trend has completed and deeper decline would be seen.