Sample Category Title
Eurozone CPI falls to 2.4%, core CPI slows to 2.6%, both above expectations
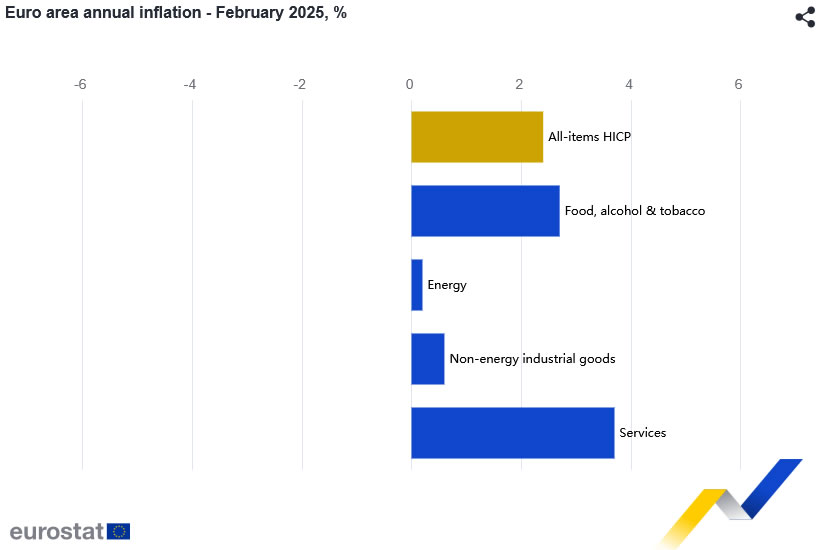
Eurozone CPI ticked down from 2.5% yoy to 2.4% yoy in February, above expectation of 2.3% yoy. Core CPI (ex-energy, food, alcohol & tobacco), fell from 2.7% yoy to 2.6% yoy, above expectation of 2.5% yoy.
Looking at the main components of inflation, services is expected to have the highest annual rate in February (3.7%, compared with 3.9% in January), followed by food, alcohol & tobacco (2.7%, compared with 2.3% in January), non-energy industrial goods (0.6%, compared with 0.5% in January) and energy (0.2%, compared with 1.9% in January).
UK PMI manufacturing finalized at 46.9, job cuts accelerate
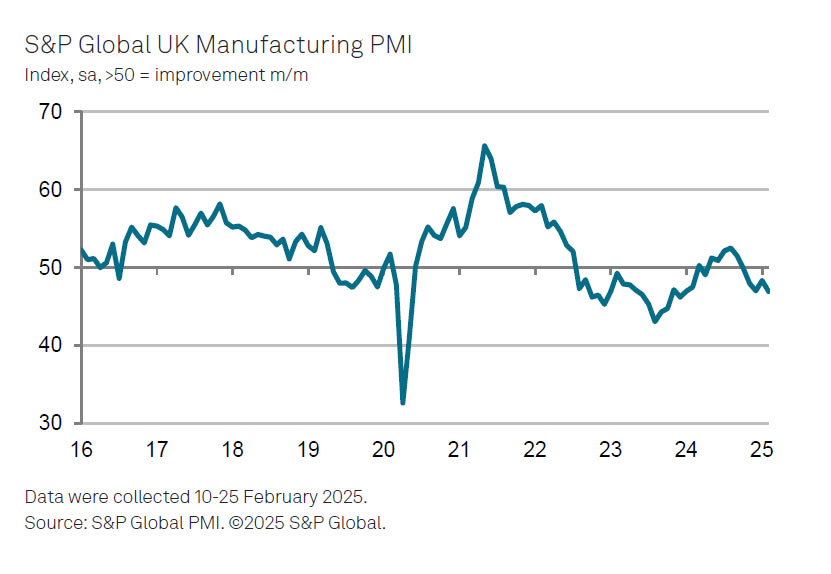
The UK manufacturing sector continued to struggle in February, with PMI Manufacturing finalized at 46.9, down from January’s 48.3, marking a 14-month low. Weak demand and declining confidence among clients have exacerbated the downturn, leading to falling output and new orders.
Rob Dobson, Director at S&P Global Market Intelligence, noted that UK manufacturers are facing an "increasingly difficult trading environment." The combination of subdued demand, rising cost pressures, and uncertainty over future economic conditions is making it harder for firms to sustain growth.
Inflation fears are also rising, particularly due to changes in the national minimum wage and employer NICs announced in the Autumn Budget.
One of the most concerning trends is the acceleration in job losses. The pace of staff reductions in the sector is now at levels not seen since the pandemic-induced slump in mid-2020.
Eurozone PMI manufacturing finalized at 47.6, a 24-mth high
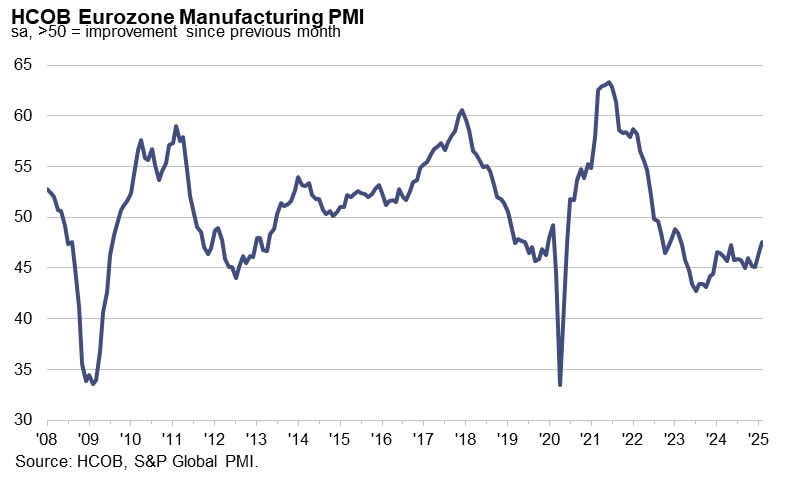
Eurozone manufacturing activity showed signs of stabilization in February, with PMI finalized at 47.6, a 24-month high, up from January’s 46.6. While still in contraction territory, the improvement offers some hope that the sector may be finding its footing.
Among individual countries, Ireland led the rankings at 51.9, marking a 12-month high, while the Netherlands reached the neutral 50.0 mark for the first time in eight months. However, Spain dipped to a 13-month low at 49.7, and Italy, Austria, Germany, and France all remained below 50, despite showing some improvement.
Cyrus de la Rubia, Chief Economist at Hamburg Commercial Bank, emphasized that while the data is encouraging, it’s "too early to call it a recovery". New orders are still falling but at the slowest rate since May 2022, and production is inching closer to stabilization. After nearly three years of recession, there is potential for modest growth in the coming months.
Despite ongoing risks, most businesses remain optimistic about the future, with confidence slightly above its long-term average. This resilience is notable, given the looming threat of US tariffs. Additional positive factors include hopes that Russia’s war in Ukraine could come to an end this year, alongside expectations of greater political stability in Germany following the recent elections.
Market Analysis: Gold Price Corrects Gains While Oil Price Eyes Recovery
Gold price rallied above $2,920 before correcting lower. Crude oil price is recovering and it could climb further higher toward the $71.80 resistance.
Important Takeaways for Gold and Oil Prices Analysis Today
- Gold price rallied significantly above $2,900 and recently corrected lower against the US Dollar.
- A key bearish trend line is forming with resistance at $2,870 on the hourly chart of gold at FXOpen.
- Crude oil prices are moving higher above the $68.90 resistance zone.
- There is a connecting bullish trend line forming with support at $69.50 on the hourly chart of XTI/USD at FXOpen.
Gold Price Technical Analysis
On the hourly chart of Gold at FXOpen, the price was able to climb above the $2,900 resistance, as mentioned in the previous analysis. The price even broke the $2,940 level before the bears appeared.
The price traded close to the $2,960 zone before there was a downside correction. There was a move below the $2,900 pivot zone. The price settled below the 50-hour simple moving average and RSI dipped below 50. Finally, it tested the $2,830 zone.
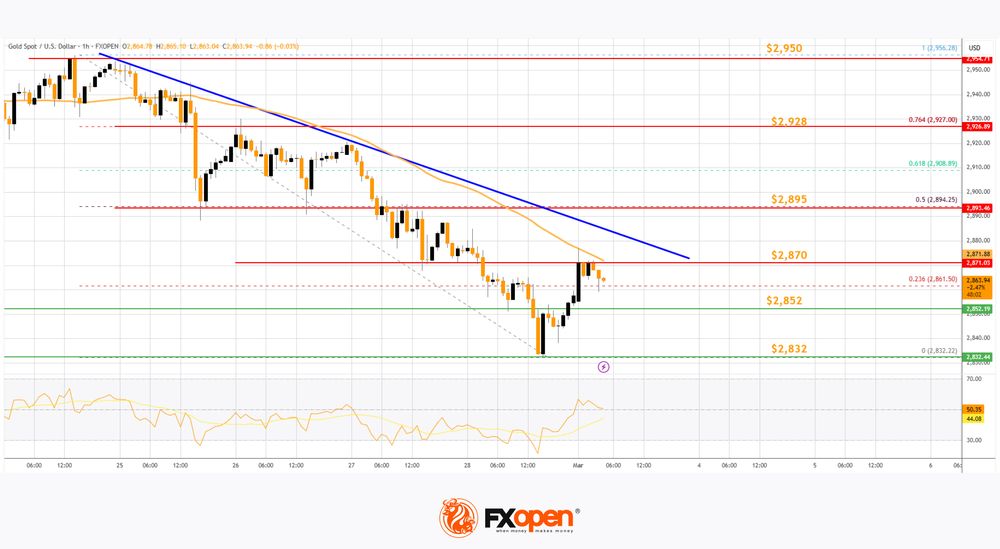
The price is now correcting losses above the 23.6% Fib retracement level of the downward move from the $2,956 swing high to the $2,832 low. Immediate resistance on the upside is near the 50-hour simple moving average and $2,870.
There is also a key bearish trend line forming with resistance at $2,870. The next major resistance is near the 50% Fib retracement level of the downward move from the $2,956 swing high to the $2,832 low at $2,895.
An upside break above the $2,895 resistance could send Gold price toward $2,928. Any more gains may perhaps set the pace for an increase toward the $2,950 level. If there is no fresh increase, the price could continue to move down.
Initial support on the downside is near the $2,852 level. The first major support is $2,832. If there is a downside break below the $2,832 support, the price might decline further. In the stated case, the price might drop toward the $2,810 support.
Oil Price Technical Analysis
On the hourly chart of WTI Crude Oil at FXOpen, the price started a decent increase against the US Dollar. The price gained bullish momentum after it broke the $68.90 resistance.
The bulls pushed the price above the 50-hour simple moving average and the RSI climbed toward 65. There was a clear move above the 50% Fib retracement level of the downward move from the $71.12 swing high to the $68.24 low.
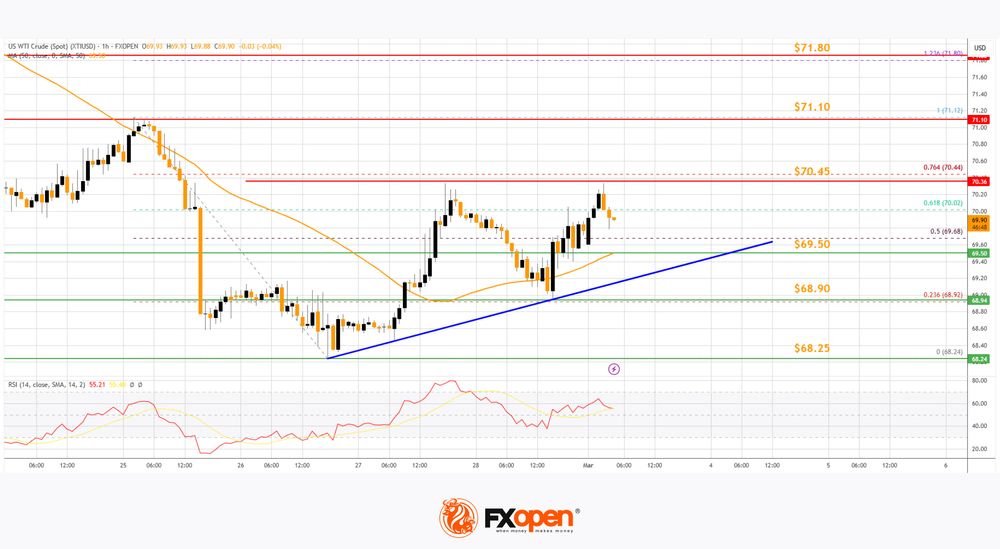
Immediate resistance is near the $70.45 level. It is close to the 76.4% Fib retracement level of the downward move from the $71.12 swing high to the $68.24 low.
If the price climbs further higher, it could face resistance near $71.10. The next major resistance is near the $71.80 level. Any more gains might send the price toward the $72.50 level.
Conversely, the price might correct gains and test the $69.50 support. There is also a connecting bullish trend line forming with support at $69.50 and the 50-hour simple moving average.
The next major support on the WTI crude oil chart is near the $68.90 level. If there is a downside break, the price might decline toward $68.25. Any more losses may perhaps open the doors for a move toward the $66.50 support zone.
Start trading commodity CFDs with tight spreads. Open your trading account now or learn more about trading commodity CFDs with FXOpen.
This article represents the opinion of the Companies operating under the FXOpen brand only. It is not to be construed as an offer, solicitation, or recommendation with respect to products and services provided by the Companies operating under the FXOpen brand, nor is it to be considered financial advice.
Risks to Eco Data Asymmetric With Negative Outcomes Likely to Trigger More Pronounced Moves
Markets
Event risk looms large this week as narratives unfold at similar levels. We therefore continue to err on the side of caution, favoring traditional haven assets. First, there’s the US growth story. Markets turned more sensitive to risks of a US growth slowdown or even recession as US President Trump’s policy mix (going from the DOGE blitzkrieg to the tariff threats) risks backfiring. Confidence surveys turned very pessimistic with the Atlanta Fed’s latest GDPNow forecast pointing at an annualized 1.5% GDP decline in Q1 after Friday’s widening trade deficit data suggested a significant drag from net exports with personal spending data reduced projections for consumer spending. This week we’ll see US ISM surveys, ADP employment change and payrolls. Last week’s uptick in weekly claims might be a prelude for weakness in public sector hiring. Risks to this week’s eco data remain asymmetric with negative outcomes likely to trigger more pronounced moves than positive data. A second topic to watch are negotiations around a truce in Ukraine. Friday’s summit between Trump and Ukrainian President Zelensky in Washington ended in a shouting competition instead of signing the mineral resources deal which could have been a step-up to further negotiations. Several EU leaders called an emergency summit yesterday in response. Countries like the UK and France are gathering a European “coalition of the willing” to secure any ceasefire. They floated the idea of a one-month truce covering air, sea and (energy) infrastructure sites to establish confidence on both sides. Next, they hope to revamp the mineral-deal in order to avoid the US from pulling security guarantees. The broader EU Council meets on Thursday to discuss a €20bn military package for Ukraine and ways to rapidly boost defense spending even if it means giving up fiscal rules. Third, there’s tomorrow US deadline for hitting neighboring countries with tariffs. Trump proposed a 25% rate, but commerce secretary Lutnick this weekend said that the final level still needs to be decided upon. The countries did “a lot” on border security, but not enough to address worries on “fentanyl deaths in America”. A delay or reduced level are still possible. The 10%pts mark-up on Chinese tariffs seems to be a done deal. After tomorrow’s deadline there are more cutoffs lining up like March 12 (steel & aluminum) and April 2 (reciprocal tariffs & more sectoral tariffs eg cars, semiconductor chips and pharmaceutical drugs). Fourth, there’s the European trace with EMU February inflation data today and the ECB meeting on Thursday. Both headline and core inflation are expected to moderate, respectively from 2.5% Y/Y to 2.3% Y/Y and from 2.7% Y/Y to 2.5% Y/Y. Today’s numbers won’t move the market needle. A 25 bps rate cut on later this week to 2.5% is discounted, with the ECB probably no longer labeling its monetary policy restrictive. Several ECB members recently floated the idea of a pause in the cutting cycle in April, our preferred scenario, with money markets currently attaching a 33% probability to that idea. Finally, Chinese leaders meet on Wednesday for the National People’s Congress where president Xi Jinping is expected to unveil a new stimulus plan together with official growth and deficit goals.
News & Views
Rating agency S&P put a negative outlook on the French AA- credit rating. That’s in line with Fitch while Moody’s holds a similar rating, but with a stable outlook. The negative outlook reflects rising government debt amid weak political consensus for tackling France's large underlying budget deficits, against a backdrop of more uncertain economic growth prospects. A downgrade is possible if the French government fails to cut deficits further over the next two years or if growth falls below projections. The rating agency lowered this year’s growth outlook from 1% to 0.8%, putting even more pressure on public finances. By 2028, S&P France's average cost of debt to be roughly equal to nominal GDP growth, meaning that in order to reduce debt to GDP, the government will need to operate a primary budget surplus, which it has not achieved since 2001. S&P projects the debt ration to rise to 119% of GDP in 2028 from 111% in 2024.
US President Trump suggested on his social media platform Truth Social that the would move forward on a US crypto strategic reserve. He named bitcoin and ethereum as the ‘heart of the reserve” but also referred to solana, XRP and cardano. After his inauguration, Trump signed an executive order to support digital assets and blockchain technology. Legislative proposals are already being drafted with in one republican-backed Senate bill looking to direct the US Treasury to buy 1mn bitcoin. The US President is expected to host and speak at the first ever White House Crypto Summit on Friday.
‘Coalition of the Willing’ Boosts Euro and European Stock Futures
The meeting between US President Trump and Ukrainian President Zelensky didn’t go as planned—no mineral deal was signed, and the talks ended in a clash. In contrast, Zelensky’s meeting with UK Prime Minister Starmer was more productive. Starmer urged European companies to form a ‘coalition of the willing’ to support Ukraine with military aid and security guarantees. Later, Macron announced plans to pursue a one-month truce.
Overall, tensions between the two continents have worsened. Oil prices initially rose in early Asian trading amid concerns that the Trump-Zelensky conflict could delay any path to lasting peace. However, selling pressure outweighed geopolitical risk perception, as last Friday’s US economic data fueled concerns about slowing growth—Atlanta Fed's GDPNow tanked to -1.5%!
The EURUSD started the week on a positive note after slipping below its 50-day moving average on Friday.
The European will to stand with Ukraine means more military spending. Increased defense spending from the ‘coalition of the willing’ should provide a short-term economic boost but also accelerate technological advancements in the medium to long run. The whole situation is a wake-up alarm for the sleeping European beauty.
On the budget side, higher spending also means increased borrowing, which could push European yields higher. The latter doesn't impact optimistic mood among investors this monday morning with DAX futures leading gains. Appetite for the European defense stocks will certainly remain solid. Gold has given back early session gains, while the US dollar is broadly softer even against the Loonie although the US is supposed to go ahead with 25% tariffs on Mexican and Canadian imports, while levies on Chinese products would be doubled to 20%.
Speaking of China, the CSI and HSI kicked off the week on a negative note despite a stronger-than-expected Caixin data that suggested the manufacturing activity in China grew faster than expected in February. Chinese bubble tea giant Mixue made a strong debut in Hong Kong trading—something to take your mind off geopolitics for a moment.
On the data front
Friday’s economic data was bitter-sweet. The core PCE index, the Federal Reserve’s (Fed) favourite gauge of inflation, came in line with expectations. But the combination of higher-than-expected personal income but lower-than-expected – and unexpectedly negative - spending growth in January raised worries regarding US growth prospects. On top, Atlanta Fed’s GDPNow forecast tanked to -1.5% from above 2% printed previously. As such, the US growth expectations are deteriorating – and they are deteriorating fast. The latter could boost the dovish Fed expectations – which could be an encouraging development for risk appetite – but for the Fed to go ahead with further support to the economy, inflation should remain under control. And with tariffs due to materialize starting from this month, controlling inflation won’t be a walk in the park.
Anyway, this week, the market will focus on January employment numbers. A consensus of analyst expectations on the latest Bloomberg survey suggests that the US economy may have added 156K nonfarm jobs in January and slightly slower wages growth. Investors will also be looking at the impact of mass firings at the federal government offices in the coming months. Soft data is good for boosting Fed doves, pushing the yields lower and improving sentiment in risk assets, but if inflation doesn’t allow, the ‘bad news is good news’ trade could be limited.
In Europe
The geopolitical developments are perceived with optimism among investors on hope that the clash with the US will finally awaken the sleeping European economies, shift focus from financial control to more spending without asking too many questions on whether the extra spending is justified – because it is. In the past, war and military spending have accelerated technology advances and served to the broader economy.
On the trade front, the next step in Trump’s tariff threats is the actual implementation, with levies set to increase. The latter will certainly have a negative impact on growth prospects and call for a decent support from the European Central Bank (ECB) to the underlying economies. Here, as well, the inflation’s trajectory is important to assess the extent to which the ECB could ease financial conditions to boost growth. The CPI updates for February released last week pointed at a mixed picture across the major eurozone countries. But the aggregate CPI update due this morning is expected to print a softening headline and core inflation in February. If that’s the case, the impact on the euro is not certain. In one hand, soft inflation numbers back the expectation of a more dovish ECB stance and could weigh on the euro, but on the other hand, the geopolitical tensions boost growth prospects and the idea that monetary and fiscal support would lead to a stronger growth across Europe – and that’s positive for the euro outlook. The combination of deteriorating growth prospects for the US and improved growth prospects for Europe could help the EURUSD regain confidence and appreciate sustainably beyond the 1.06 mark, the major 38.2% Fibonacci retracement on September to January Trump selloff, and reverse the Trump-led bearish trend.
All Eyes on Russia and Ukraine Peace Plan
In focus today
In the euro area, focus turns to the inflation data for February. As hinted by the national releases (see our what happened over the weekend section), we forecast euro area headline inflation to decline to 2.3% y/y from 2.5% y/y. Most importantly, underlying inflation continued to ease in all countries, with muted monthly price increases and a decline in the yearly growth rates. Services inflation is finally starting to decline due to base effects and lower momentum, and we thus expect euro area core inflation to fall to 2.4 % y/y from 2.7% y/y. We also look out for the final release of the manufacturing PMI for February, which rose more than expected to 47.3 in the flash print.
In the US, focus turns to the ISM Manufacturing index for February released at 16.00 CET. Consensus points to a modest downtick to 50.5 from 50.9 in January. This is in contrast to the flash S&P Manufacturing PMI, which showed an improvement in February. Note that the final release of the S&P-measure will be released at 15:45.
In Sweden, PMI for the manufacturing sector has been in solid territory over the past year with an average of 52.0, and the last print for January was 52.9. While our base case is for a number around that level, we look for any impact of recent jitters around tariffs and the increasing geopolitical tensions. Given the rather weak state of the labour market, we will also look more closely at how the employment sub-index evolved. We will also get the Riksbank Business Survey, which will be an important input for the board ahead of the upcoming March meeting and has been highlighted by Aino Bunge as especially important.
The focus this week will most likely be on geopolitical news - in particular any progress in the Russia-Ukraine peace talks and whether the Trump administration's tariffs imposed on Mexico, Canada and China will be implemented Tuesday. Furthermore, the ECB will convene on Thursday, where we expect them to cut rates by 25bp, while the week is concluded with the US February Jobs Report scheduled for release on Friday.
Economic and market news
What happened over the weekend
In the US, Core PCE was close to expectations at +0.3% m/m (SA), while core services inflation moderated. While this is not exactly a surprise, it is still positive for the Fed to see that the upside surprise in CPI was not repeated in PCE data.
And while spending data for January is subject to residual seasonality, at first glance it is noteworthy that savings rate ticks quite sharply higher to 4.6% (from 3.5%). This causes real household spending volume to decline by 0.5% m/m (SA). It will be interesting to see if weaker consumer sentiment in February translates into further cautiousness in spending.
In the euro area, there were several inflation releases on Friday. German CPI inflation was unchanged at 2.3% y/y in February (consensus 2.3% y/y), but higher than indicated by regional data. In France, HICP inflation fell to 0.9% y/y from 1.8% y/y (consensus 1.1% y/y). Italian HICP rose 1.7% y/y, which was below expectations of a rise to 1.8% y/y (prior 1.7%). Hence, Italian inflation also came in lower like France and Germany.
In Norway, NAV registered labour market report showed an unemployment rate of 2.0% (SA) which is slightly below Norges Bank's forecast of 2.1%. The number of full-time employees fell by 327 people s.a. in February which is clearly considerably better than what other indicators would suggest. Retail sales showed a monthly rise of 1.1% m/m which paints a picture of a slight pick-up in goods consumption towards the end of last year and the beginning of 2025.
The Norges Bank's Q1 expectations survey showed that price and wage expectations are on the decline. Thus, the range for expected wage growth in 2025 is in the range 3.9-4.2%, compared with Norges Bank's estimate of 4.2% from the December monetary policy report.
In Sweden, GDP numbers came in better than expected at 0.8% q/q and 2.4% y/y. The domestic economy also performed better than expected, and consumption ticked up by 0.7% q/q. Thus, we expect consumption to show a more modest increase in Q1 than in Q4.
In China, manufacturing and non-manufacturing activities showed growth in February, with the PMI (NBS) rising to 50.2 and 50.4 respectively, suggesting improved domestic demand. Composite PMI increased to 51.1 in February. Like NBS, Caixin manufacturing PMI increased to 50.8 from 50.3.
Turning to politics, China plans to counter the upcoming US tariffs by targeting American agricultural exports, according to China's state-backed Global Times. The US agricultural sector, with China as its largest market, has historically been prone to being leveraged during trade conflicts.
On the geopolitical front, the UK and France announced they would lead the so-called Coalition of the Willing and work on a ceasefire proposal for Ukraine after the emergency meeting convened by the UK Prime Minister Starmer in London yesterday. They emphasize that for any peace deal to be sustainable, the US needs to be involved and say that signing of the minerals deal is a key priority next. Late in the evening, French PM Macron also proposed a partial one-month ceasefire that would not cover ground fighting. This morning we published a piece about the most recent talks in the Russia-Ukraine war, see Research Global: Arming Ukraine is the cheap option for Europe, 3 March. After the heated Trump-Zelensky exchange in the Oval Office on Friday, it is ever more clear that Europe urgently needs a plan to ensure undisrupted support for Ukraine. We argue that arming Ukraine is by far the cheapest option for Europe, even if it requires that Europe would cover the costs on behalf of the US. We also think the easiest way forward is to work with the so-called Coalition of the Willing instead of pursuing a unanimous EU-wide decision on the matter of confiscating the frozen Russian assets.
In the Middle East, the ceasefire between Hamas and Israel lapsed on Sunday morning after Hamas rejected an updated proposal by Israel regarding the extension of the ceasefire under phase two. As a result, Israeli PM Netanyahu announced that all aid deliveries to Gaza would stop.
Equities: Equities rose on Friday as US markets rallied, closing at their highest point after a late surge in trading. However, this does not alter the fact that equities were lower over the week on a global scale, led by declines in the US and within the tech growth sector. It is also worth remembering that Japan and other Asian markets experienced sharp declines on Friday morning.
Before jumping to conclusions, it is essential to thoroughly review the performance of cross-equities and cross-asset classes. One notable observation is that European equities rose last week, driven by banks, which saw gains of more than 4%. Thus, the initial conclusion is that we are not witnessing a global growth scare. Also, value stocks outperformed growth stocks by 3% last week, which does not align with the message from the bond market, where yields continued to fall, including on Friday.
It is tempting to point to a growth scare in the bond market, drawing parallels to previous episodes. However, the still relatively new US administration plays a significant role here. Again, look at Europe, where the 10-year yield is down "only" 25 basis points from its peak in January compared to the US, where the decline is about 60 basis points. Hence, we are not really seeing a global growth scare.
A final noteworthy observation is the performance of assets such as Bitcoin and Tesla, which surged right after the election but are currently under pressure. This indicates that we are not dealing with a classic growth scare sell-off but rather a policy fear and uncertainty-driven readjustment. US equities on Friday: Dow +1.4%, S&P 500 +1.6%, Nasdaq +1.6%, and Russell 2000 +1.1%. Markets in Asia are playing catch-up this morning despite the looming tariff deadline tomorrow. European futures are also reflecting the strong late-hour performance in the US on Friday, rising by half a percent this morning. US futures are green as well, although not rising as strongly as in Europe.
FI: The decline in US yields continued through Friday's session as US consumer spending weakened significantly in January. The bulk of the move came from the front end of the curve with the 2Y US Treasury yield breaking below the 4% mark. In Europe, rates were relatively flat throughout the session despite a new batch of soft figures on core inflation from Germany and France. The recent string of soft US data has lowered the implied terminal Fed Funds rate from 4% by mid-February to 3.50% as of today. We think the downward correction can proceed a bit longer, as we target a terminal rate of 3-3.25%. However, the rapid repricing seen recently has left US yields more sensitive in the near term to upside data surprises (e.g. on this Friday's NFP) and the ongoing process of delivering an expansionary tax reform.
FX: EUR/USD dropped below 1.04 after Trump's tariff tweet last Thursday, which triggered a typical risk-off reaction and a broadly stronger USD - its first weekly gain in a month, also supported by general risk off sentiment. CEE currencies ended the US-session on Friday on a weak footing after Zelensky's visit to the White House took a turn for the worse, halting further immediate progress between the two nations. Closer to home, the market continued to press EUR/DKK FX forwards higher on Friday in anticipation of tighter liquidity conditions at the end of March.
EUR/USD Daily Outlook
Daily Pivots: (S1) 1.0350; (P) 1.0385; (R1) 1.0410; More...
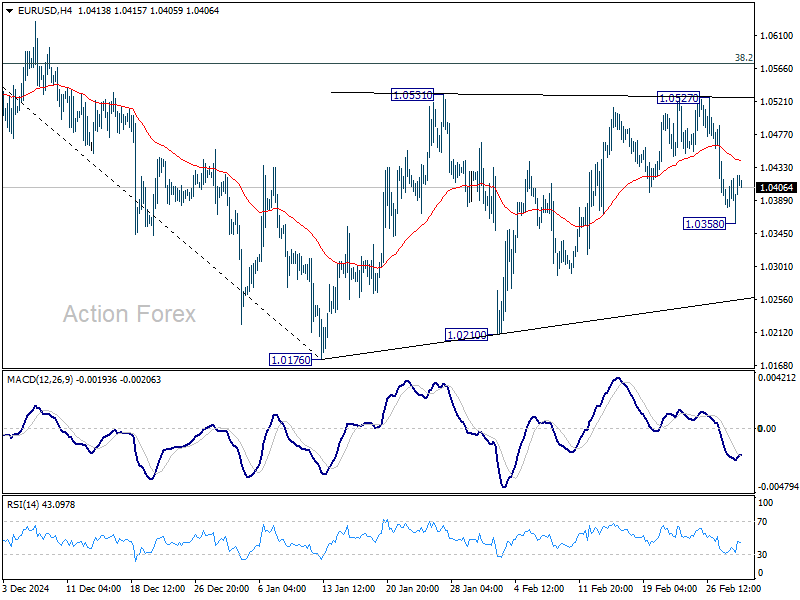
Intraday bias in EURUSD is turned neutral first with current recovery. But outlook is unchanged that consolidation from 1.0176 should have completed at 1.0527. Below 1.0358 will target 1.0176/0210 support zone first. Firm break there will resume whole fall from 1.1213, and carry larger bearish implications. Overall outlook will remain bearish as long as 38.2% retracement of 1.1213 to 1.0176 at 1.0572 holds.
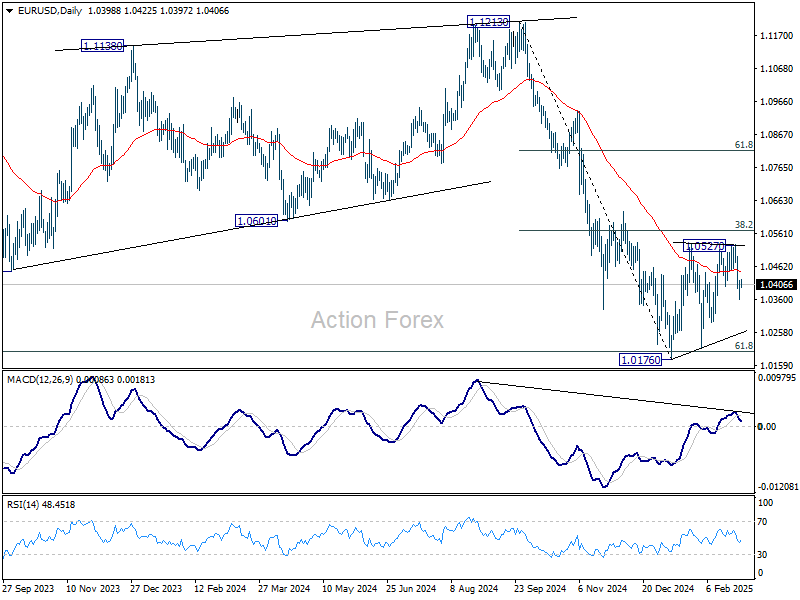
In the bigger picture, immediate focus is on 61.8 retracement of 0.9534 (2022 low) to 1.1274 (2024 high) at 1.0199. Sustained break there will solidify the case of medium term bearish trend reversal, and pave the way back to 0.9534. However, reversal from 1.0199 will argue that price actions from 1.1274 are merely a corrective pattern, and has already completed.
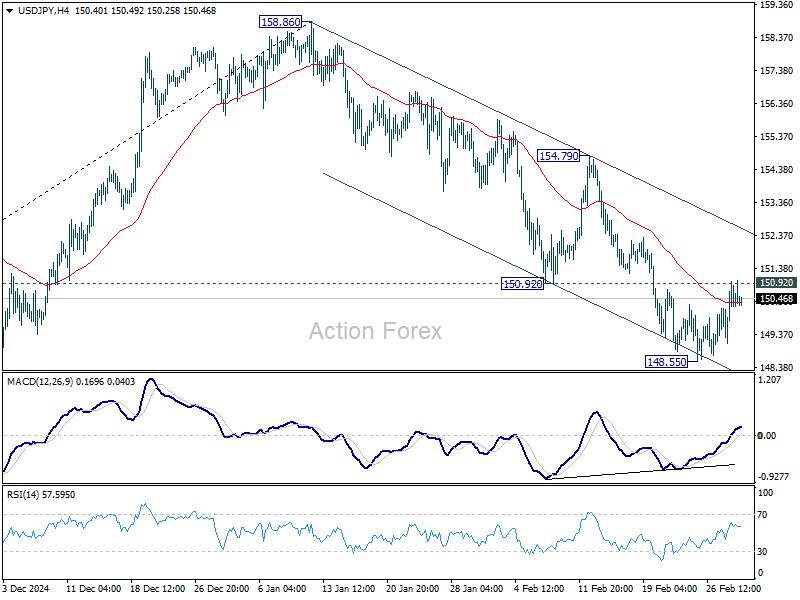
USD/JPY Daily Outlook
Daily Pivots: (S1) 149.49; (P) 150.24; (R1) 151.38; More...
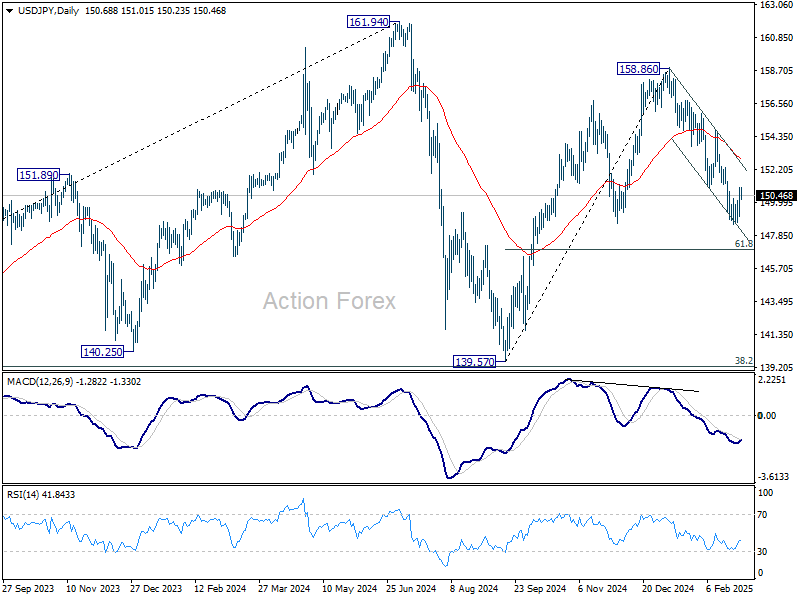
Intraday bias in USD/JPY remains neutral for the moment. Fall from 158.86 is seen as the third leg of the corrective pattern from 161.94 high. Break of 148.55 will target 61.8% retracement of 139.57 to 158.86 at 146.32 next. On the upside, however, break of 150.92 will indicate short term bottoming and bring stronger rebound.
In the bigger picture, price actions from 161.94 are seen as a corrective pattern to rise from 102.58 (2021 low). In case of another fall, strong support should be seen from 38.2% retracement of 102.58 to 161.94 at 139.26 to bring rebound. However, sustained break of 139.26 would open up deeper medium term decline to 61.8% retracement at 125.25.
GBP/USD Daily Outlook
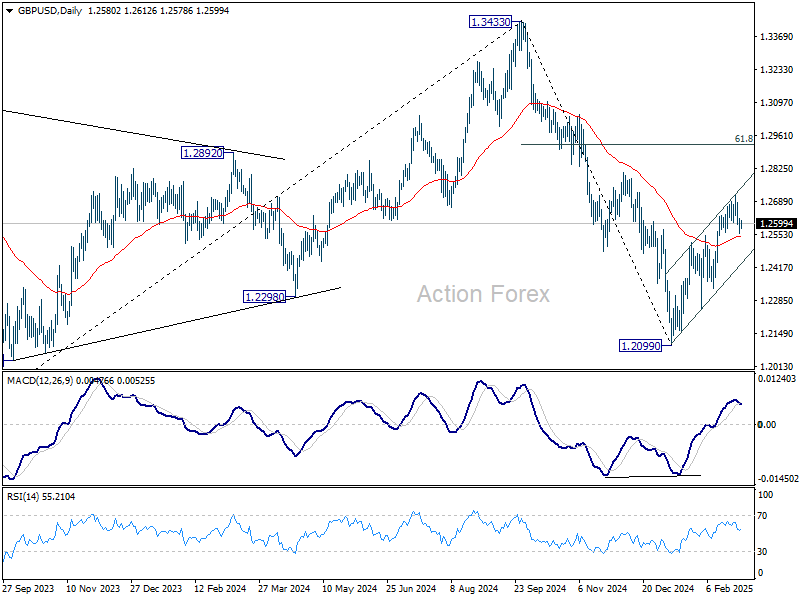
Daily Pivots: (S1) 1.2549; (P) 1.2585; (R1) 1.2612; More...
Intraday bias in GBP/USD stays mildly on the downside at this point. Fall from 1.2715 short term top would extend to near term rising channel support (now at 1.2439). Sustained break there will indicate that corrective rebound from 1.2099 has already completed. Nevertheless, above 1.2715 will resume the rebound to 1.2810 resistance next.
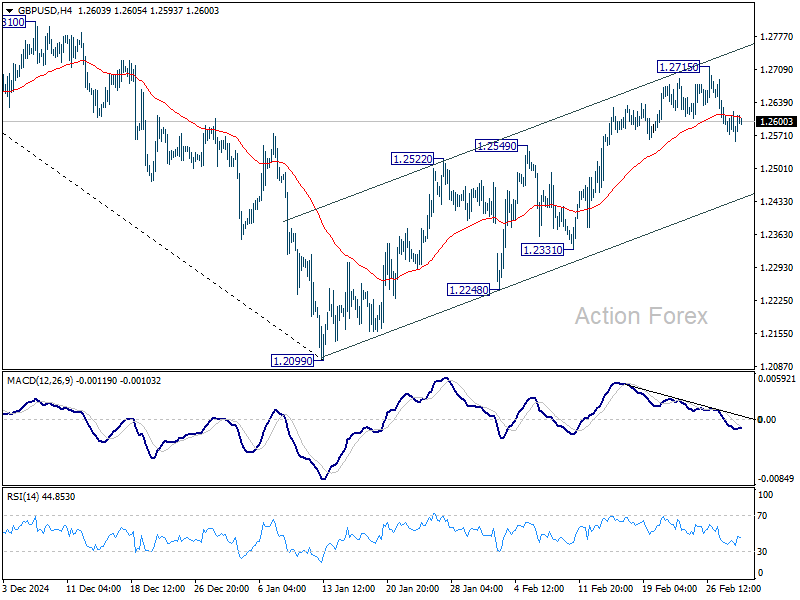
In the bigger picture, rise from 1.0351 (2022 low) should have already completed at 1.3433 (2024 high), and the trend has reversed. Further fall is now expected as long as 1.2810 resistance holds. Deeper decline should be seen to 61.8% retracement of 1.0351 to 1.3433 at 1.1528, even as a corrective move. However, firm break of 1.2810 will dampen this bearish view and bring retest of 1.3433 high instead.