
Sample Category Title
EURUSD Breaks Above Key 1.2430 Resistance Level
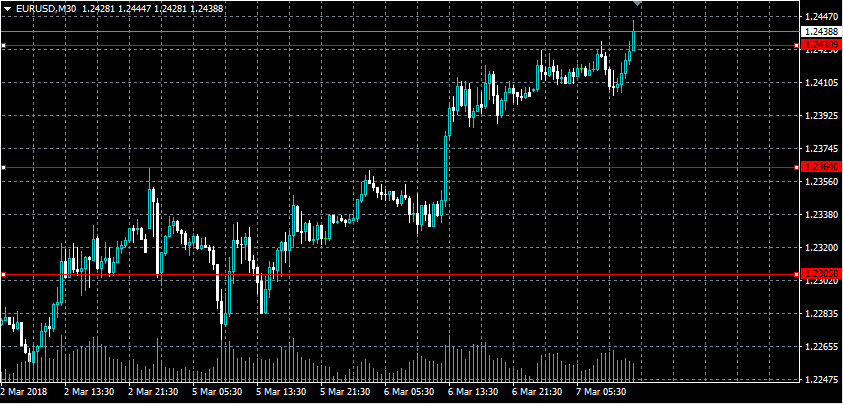
The euro has broken above the key 1.2430 resistance level against the greenback during the European trading session, as the U.S dollar index comes under strong selling pressure. The EURUSD pair has so far set a new weekly trading-high of 1.2444, with further intraday gains likely as traders use the 1.2430 level as former key resistance turned critical support. Traders now look towards the release of the U.S ADP jobs report, with economists expecting 185,000 new private sector jobs to be created.
The EURUSD pair is strongly bullish while trading above the 1.2430 level, further gains towards the 1.2474 and 1.2550 levels appears likely.
If the EURUSD pair now falls below the 1.2430 level, price-action may correct back towards the 1.2400 and 1.2364 support levels.
WTI Oil Weakens On Strong Oil Stocks Build, Risks Further Downside
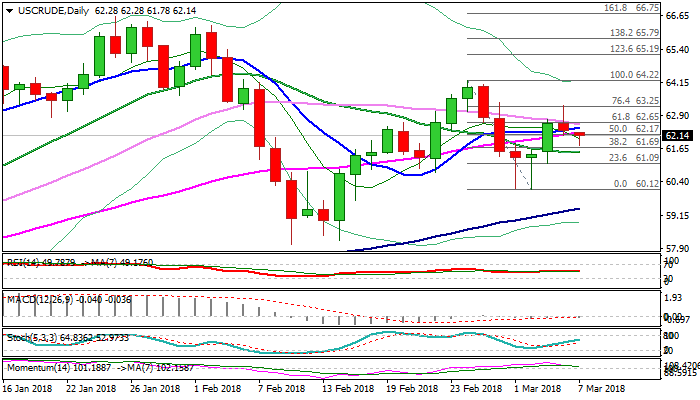
WTI oil stands in red on Wednesday on fresh negative sentiment, sparked by stronger than expected build of crude stocks and rising fears about potential global trade war. Oil price closed in red on Tuesday after attempts to extend strong rally from Monday were strongly rejected at $63.26, leaving daily candle with long upper shadow, which was initial bearish signal. API weekly crude stock report, released late Tuesday, showed unexpectedly strong build in crude inventories by 5.66 million barrels, more than double of forecast for build of 2.7 million barrels. Oil price extended weakness to $61.78 on Wednesday, driven by negative sentiment, but dips were so far short-lived as the price bounced back above cracked Fibo support at $62.06 (38.2% of $60.12/$63.26 recovery). Fresh easing weakened near-term structure as daily MA's (10/30/55) turned to bearish setup and momentum dipped to the border of negative territory, threatening of further weakness, which could be triggered by stronger than forecasted build of weekly crude stocks from EIA report (due later today) and close below cracked Fibo support at $62.06. Bearish scenario would look for Fibo levels at $61.69 (50%) and $61.32 (61.8% of $60.12/$63.26) which guard the base of thick daily cloud at $60.91. Bullish scenario sees minimum requirement on bounce above 30SMA ($62.56) to ease immediate downside risk, however, extension above Tuesday's high at $63.25 is needed for attack at daily cloud top at $63.49, which marks upper pivot.
Res: 62.28, 62.56, 62.77, 63.25
Sup: 62.06, 61.78, 61.69, 61.32
EURJPY Fails To Strengthen Bullish Run, Negative Movement In Progress
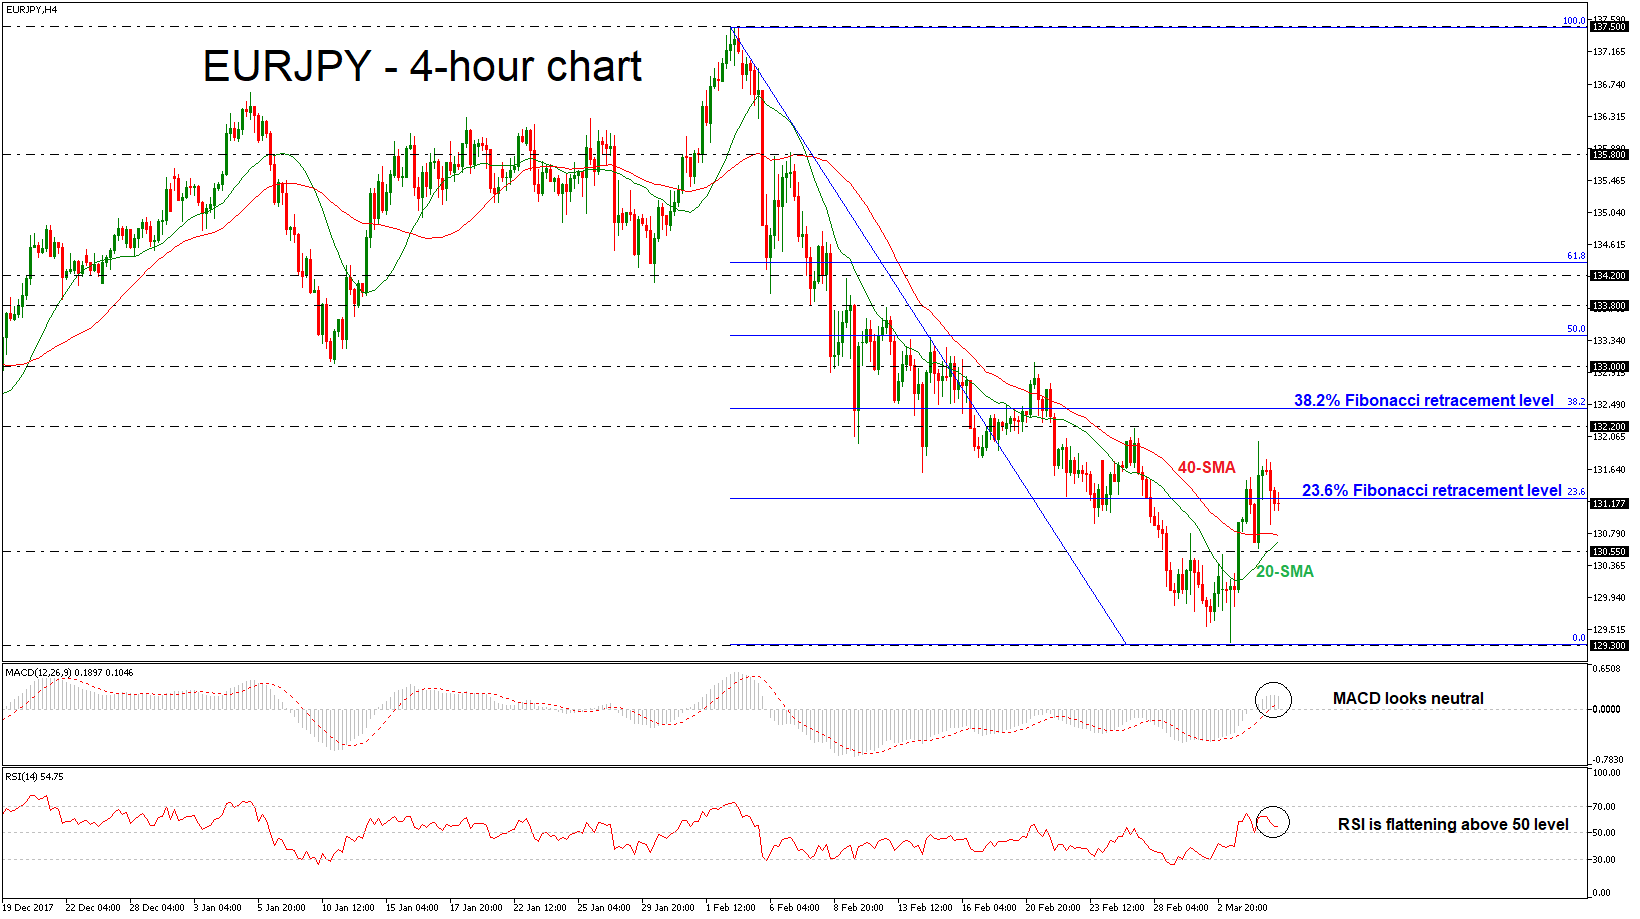
EURJPY remains under strong pressure as it has started an aggressive bearish correction since February 2. The price lost more than 30% of its gains since April 2017 as it tried to challenge the 38.2% Fibonacci retracement level at 128.80 of the upleg from 114.90 to 137.50.
During today's European session the pair completed two consecutive bearish sessions in the 4-hour chart and slipped below the 23.6% Fibonacci level of the downleg from 137.50 to 129.30.
From the technical point of view, in the short-term, the MACD oscillator holds in the positive area with weak momentum, while the RSI indicator is flattening above the 50 level, suggesting neutral to negative movement in price action. Despite that, the 20 and 40 simple moving averages are turning to the upside.
In case of further losses, the pair could hit the 130.55 support barrier but needs to fall below the 20 and 40 SMAs. A dip below the aforementioned obstacle could lead the way towards the 129.30 low.
On the flip side, to the upside, the next level to watch is the 132.20 resistance if there is a jump above the 23.6% Fibonacci mark. Rising above this barrier could hit the 38.2% Fibonacci level of 132.45.
CRUDE OIL Bearish Pressures Increase
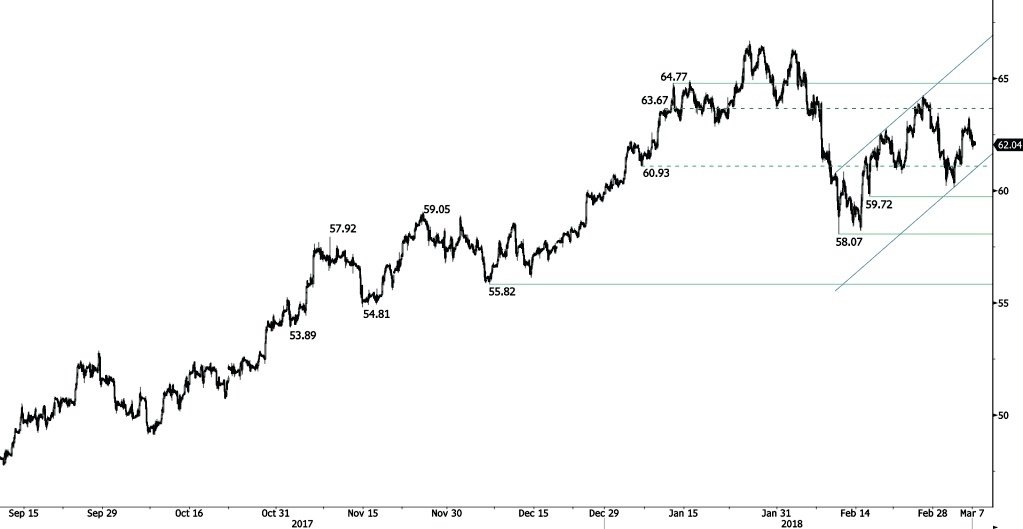
Crude oil upward trend is fading after reaching the 64 range. The pair is currently trading between hourly support and resistance given at 59.72 (15/02/2018 low) and 64.77 (11/01/2018 high). The technical structure suggests further short-term decline.
In the long-term, crude oil has recovered after its sharp decline last year. However, we consider that further weakness is very likely. For the time being, the pair lies in an upside trend since June 2017. Support lies at 42.20 (16/11/2016) while resistance is located at 77.83 (20/11/2014). Crude oil is trading largely above its 200 DMA.
SILVER Consolidation After Rising Momentum
Silver short-term hike fades, following a break of hourly resistance at 16.83 (28/12/2017 high). Hourly support and resistance are now given at 16.25 (01/12/2017 low) and 16.98 (15/02/2018 high). The short-term technical structure suggests short-term decrease.
In the long-term, the trend remains negative/sideways. Further downside is very likely. The pair is trading below its 200 DMA. Resistance is located at 21.58 (10/07/2014 high). Strong support can be found at 11.75 (20/04/2009).

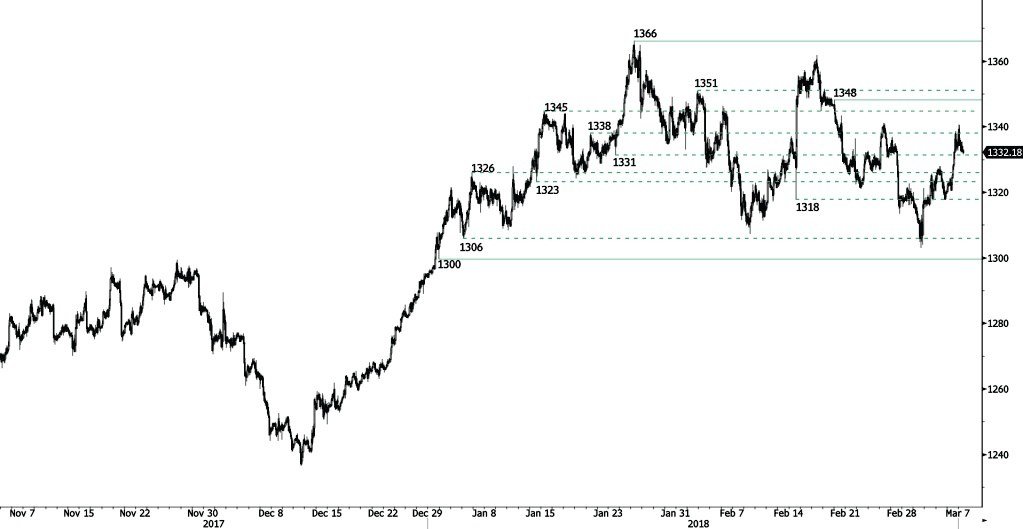
GOLD Increase Maintained
Gold continues its rise following recent decrease at the 1323 range, breaking hourly resistance at 1338 (19/01/2018 high) and approaching hourly resistance at 1348 (20/02/2018 high). Hourly support at 1300 (29/12/2017 low) is gaining distance. The shortterm technical structure suggests further rise.
In the long-term, the technical structure suggests that there is a growing upside momentum. A break of 1'392 (17/03/2014) is required to confirm it. A major support can be found at 1'045 (05/02/2010 low).
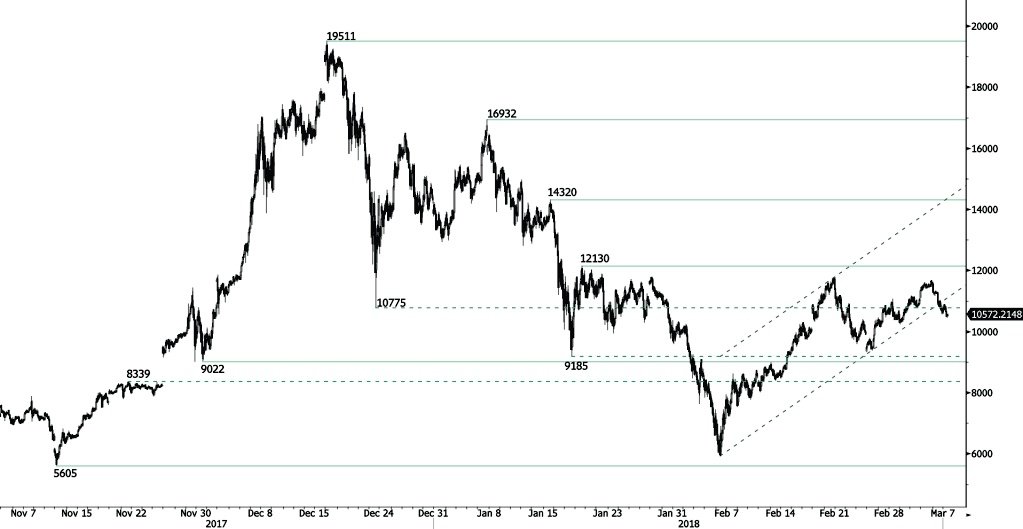
BITCOIN Bearish Pressures Increase
Bitcoin is losing upward momentum, exiting uptrend channel and approaching the 10000 range. Hourly support and resistance remain at 9022 (30/11/2017 low) and 12130 (18/01/2018 high). The short-term technical structure suggests further decrease.
In the long-term, the digital currency has had an exponential growth but also presented important downturns. There is decent likelihood that the currency could stabilize between 7'000 - 12'000 in 2018. Bitcoin is trading above its 200 DMA (7000 range).
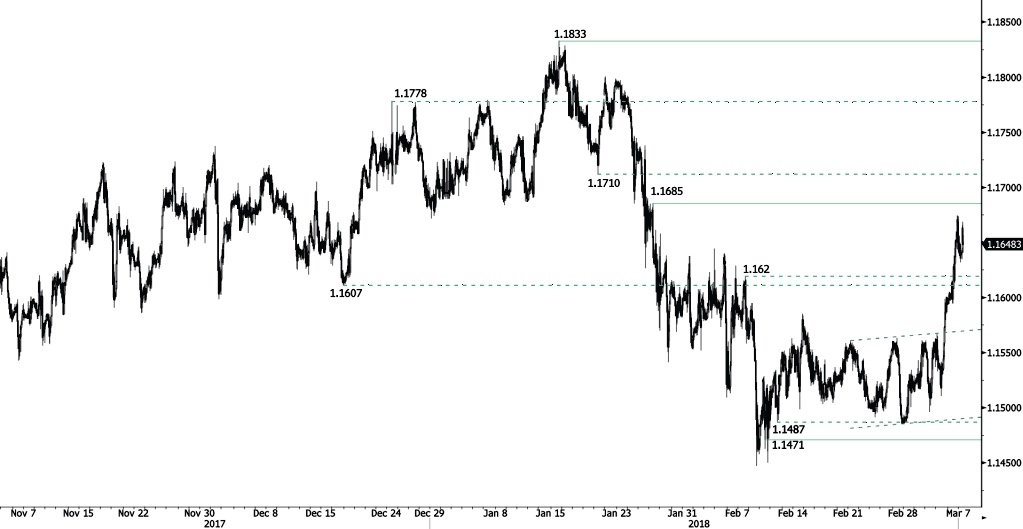
EUR/CHF Bullish Trend Continues
EUR/CHF bullish momentum is maintained, the pair broke hourly resistance at 1.162 (07/02/2018) and approaches hourly resistance at 1.1685 (26/01/2018 high). Hourly support at 1.1471 is distanced (09/02/2018 low). The technical structure suggests further short-term increase.
In the longer term, the technical structure has reversed. Strong resistance is given at 1.20 (level before the unpeg). Yet, the ECB's slowing QE program is likely to cause buying pressures on the euro, which should weigh in favour of the EUR/CHF. Support can be found at 1.0234 (20/04/2015 low).
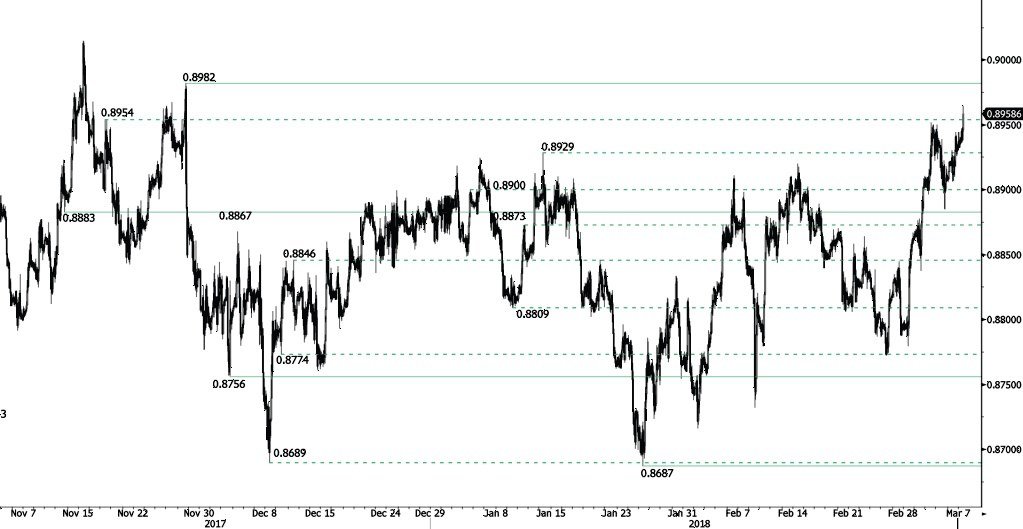
EUR/GBP Strengthening
EUR/GBP increases further, breaking hourly resistance at 0.8954 (17/11/2018) and approaching hourly resistance given at 0.8982 (28/11/2018 high). Hourly support at 0.8883 (13/11/2017 low) is distanced. The short-term technical structure suggests further increase.
In the long-term, the pair has largely recovered from 2015 lows. The technical structure suggests further upside pressure. Strong resistance can be found at 0.9500 (psychological level) while support remains at 0.8304 (05/12/2016 low). The pair is trading above its 200 DMA.
Euroarea Q4 GDP finalized at 0.6% qoq, unrevised
Euroarea (EA19) Q4 GDP: 0.6% qoq, 2.7% yoy, 2.3% over 2017
EU28 Q4 GDP growth: 0.6% qoq, 2.6% yoy, 2.4% over 2017
In Q4, Estonia ranked top at +2.2%, followed by Slovenia at +2.0% and Lithuania at +1.4%
Greece and Croatia were both at bottom at +0.1%, followed by Italy and Latvia at +0.3%
Regarding the components:
- EA19: Household consumption expenditure +0.2%, gross fixed capital formation +0.9%, exports +1.9%, imports +1.1%
- EU28: Household consumption expenditure +0.2%, gross fixed capital formation +0.9%, exports +1.7%, imports +1.3%