Sample Category Title
Forex Analysis: US500 And Gold
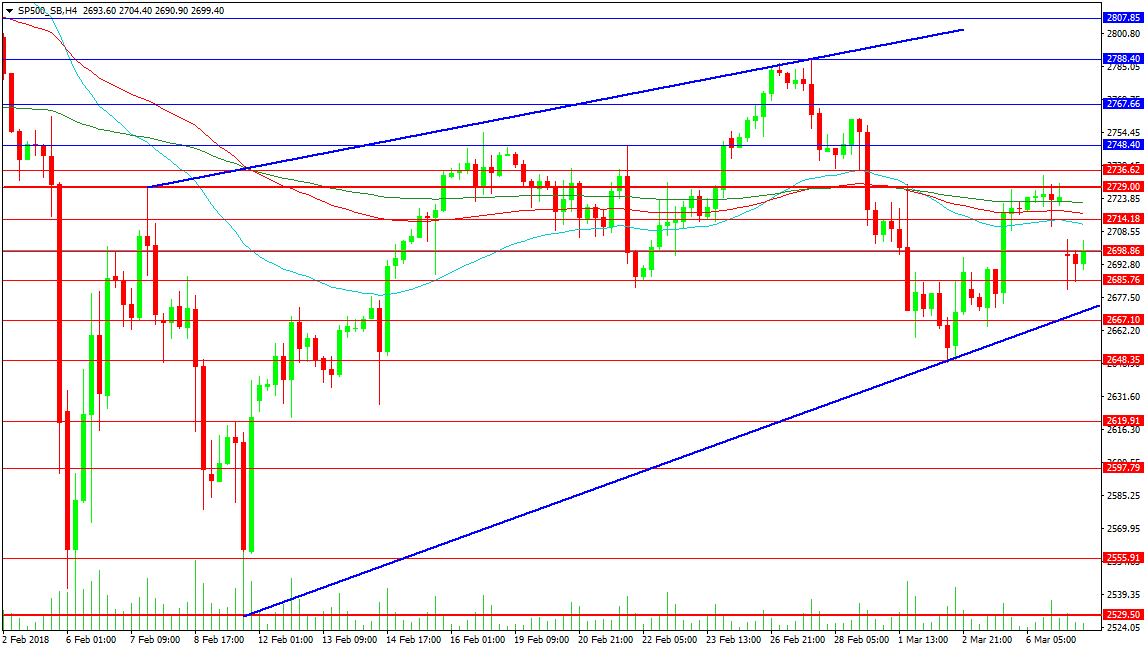
The US index has taken a fall lower with worries over trade tariffs. Today, it is opening with a gap down after the US Chief Economic Advisor to President Trump resigned last night. This raises the risk of a trade war taking place. The price has found support around the 2680.00 area and has a rising trend line adding support at 2671.50. A fall below this trend line suggests that the 2650.00 area could be targeted, with recent lows at 2647.30. A move under this area creates a lower low and can start taking out bullish stops down to 2600.00. Bearish traders are targeting the lows of 2018, around 2529.00 initially, with 2500.00 below.
Resistance can be found at 2700.00, with 2714.18 above, supported by the 4-hour moving averages in a tight band between 2711.00 and 2721.75. The next resistance comes at 2729.00 and 2736.62. Breaks higher above this area would create a higher high, which would be confirmed with a move through 2788.40, with trend line resistance at 2810.00.
 Gold
Gold
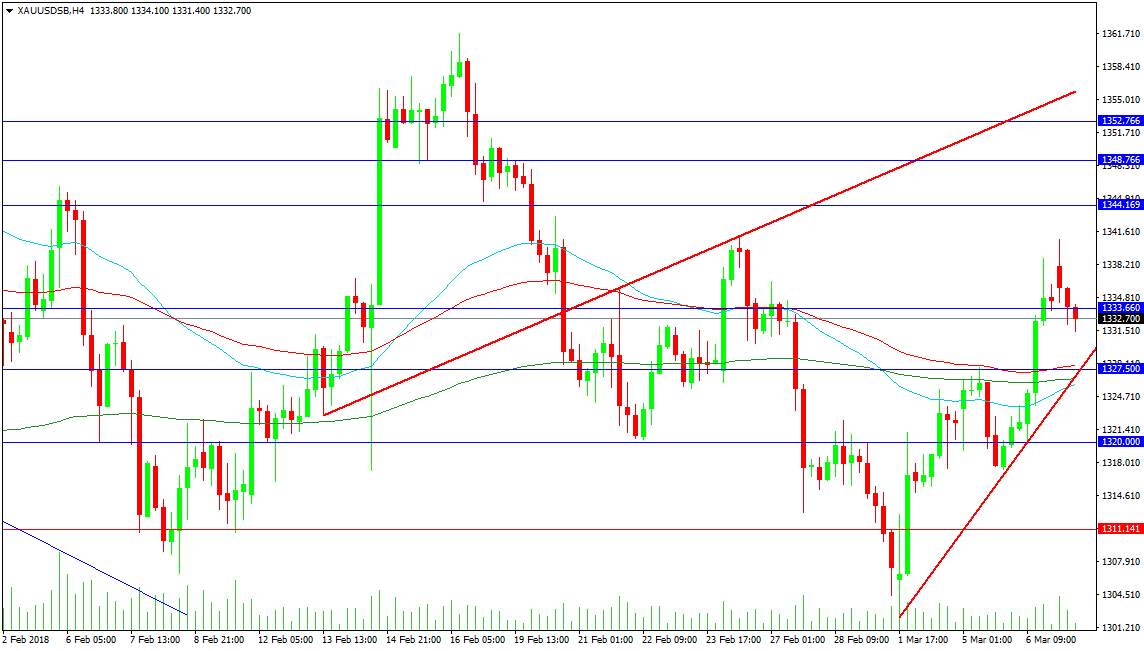
With risk-off sentiment in the markets and a flight to safety taking place, the precious metal has seen a modest recovery from the 1300.00 support area. This has resulted in a bullish move to test resistance at 1340.00, with price pulling back to support at 1331.50. Further support is firming up in the 1327.50 area as the moving averages in the 4-Hour timeframe turn higher and the supporting trend line of the bullish move rises up. Further support is seen at 1320.00 and the 1311.14 level. As mentioned, 1300.00 is a strong area extending down as far as 1290.00.
Resistance comes at the 1333.60 area, which price is currently struggling with. A break above this week’s highs targets the 1344.17 level, followed by the 1350.00 area and red trend line resistance at 1355.70. Above here, resistance is found at 1361.5 and 1365.00.
EUR/USD Analysis Diminishes Trading Range
The Asian session was relatively calm for EUR/USD on Tuesday. This lack of movement shifted significantly in favour of bulls mid-session when the rate surged 80 pips within a couple of hours. This surge was seemingly caused by uncertainty over global trade wars that weighted heavily on the US Dollar.
The Euro still managed to push higher in subsequent hours up to the monthly R1 at 1.2437; however, falling short from the upper boundary of the one-week channel up.
Even though technical indicators have been pushed in the overbought territory, they continue flashing bullish signals. Thus, the Euro might still approach the upper channel line of a six-week channel and the weekly R2 at 1.2480 before reversing to the downside. A possible southern target for today is the 1.2350 mark.
GBP/USD Analysis Likely Tended North
Following a rather quite morning on Tuesday, the Sterling took advantage of the weaker US Dollar later in the day and eventually dashed through the strong resistance of the monthly and weekly PPs and the 200-hour SMA circa 1.3870. Further advance did not follow, as the pair entered a minor period of consolidation.
Despite technical indicators flashing bearish signals, it is likely that the breached resistance succeeds at supporting the rate near 1.3860. This level also coincides with the 55-hour SMA and the prevailing one-week tend-line.
By and large, it is expected that the Sterling pushes higher within the following trading sessions until a downward-sloping trend-line and the 38.20% Fibo retracement is reached near 1.3950.
USD/JPY Analysis Lingers Near 2017 Low
The US Dollar was edging lower along the 100-hour SMA on Tuesday. The Yen, however, managed to strengthen 45 pips during the Asian session, as risk-averse traders responded negatively to the resignation of Trump's economic advisor Gary Cohn that have heightened concerns over a trade war.
The pair has since remained stable, lingering slightly above the 2017 low of 105.35. If looking at today's session, some downside potential is still apparent for the pair. Even if the aforementioned low is breached, the Greenback should be stopped by a downward-sloping trend-line near 105.10.
In terms of resistance, a possible near-term target is the 200-hour SMA, the weekly PP and the upper boundary of a three-month channel circa 106.25.
XAU/USD Analysis Moves In Line With Patterns
The yellow metal took advantage of the weaker US Dollar on Tuesday, thus managing to surge by 1.44% and reaching the 1,340.00 mark late in the evening. The pair breached the prevailing four-week channel down along the way, at the same time providing the second upper confirmation of a more junior pattern.
Technical indicators are in favour of a fall in this session that should be targeted towards the combined support of the 200-, 55– and 100-hour SMAs near 1,325.00. The general direction, however, should be tended north this week, seemingly along the lines of the aforementioned junior channel, in order to test the most senior pattern circa 1,355.00.
Meanwhile, gains should be capped near the weekly R1 at 1,350.00 today.
Risk-Off Sentiment Persists As Market Awaits Trump Trade Tariffs
Trade war weighs on markets
Global equities remain under pressure on Wednesday despite positive developments in the Korean peninsula, which suggests that market participants are more focus on the formalisation of Trump new trade tariffs. The Nikkei ended the session down 0.77%, Hong Kong Hang Seng was off 1.03%, while Singapore's STI fell 2.03%.
South Korea and North Korea are planning a meeting at the end of April. The news came on the back of the announcement that Kim Jong Un, the North Korean leader, was willing to give up on its nuclear programme, should the safety of the regime will be guarantee. Maybe the inconsistency and unpredictability of Kim Jong Un is keeping investors on their toes.
In the US, the resignation of Gary Cohn as director of National Economic Council suggests that Trump is actually moving forward with its trade war. Therefore, the market remains broadly in risk-off mode as the Japanese yen and the Swiss franc extended gains against the greenback. The former was up 0.50%, while the latter rose 0.35%. For now, it is hard to know where to stand, as there is a lot of moving pieces on the political side. On the other side of the Atlantic, the single currency kept grinding higher against the US dollar, with the most traded currency pair hitting 1.2434 during the European morning. We remain positive on the currency pair with the 1.2550 as next target.
Canada to maintain monetary policy intact
In the context of growing tensions with its first commercial partner, fighting on the front of NAFTA's new terms and conditions and recently adding up tariffs on aluminum (10%) and steel (25%), Bank of Canada Governor Stephen Poloz faces the unique choice of maintaining monetary policy unchanged during tomorrow's monetary policy meeting in Wellington, Ottawa. Currently given at 1.25%, BoC's lending rate benchmark is not expected to rise until the second half of 2018 (last hike in January 16th, 2018).
Though market volatility remained lively in previous days, Canadian S&P/TSX index remained stable, valued at 15'545 (+1.05% since Monday, March 2nd 2018), supported by major sectors and particularly Health Care, Materials, Energy and Financials while the only laggard remained Industrials, strongly impacted by Bombardier (-4.80%) and Canada National Railway (-1.83%) underperformance. Materials stocks outperform broader market due to weaker USD (Gold and Silver rise) backed by decreasing fears of trade wars. On currency side however, we see further weakness emanating from CAD against major currencies. USD/CAD, EUR/CAD and GBP/CAD trade at 1.2929 (+5.41%), 1.6063 (+4.67%) and 1.7962 (+2.65%) since February 1st, 2018.
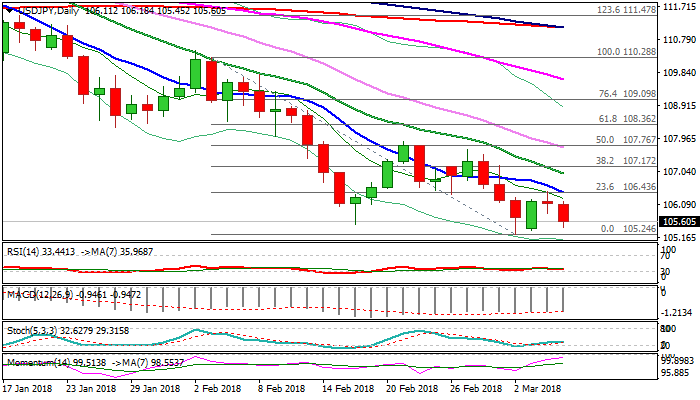
Technical Outlook: USDJPY – Fresh Bearish Acceleration After Recovery Stall Revives Bearish Bias
The pair accelerated lower on Wednesday after resignation of Trump’s advisor Cohn, pressured dollar and sparked fresh risk aversion, increasing demand for safe-haven yen.
Fresh weakness was signaled by recovery stall at 106.44 Fibo 23.6% barrier on Tuesday and daily trading shaped in long-legged Doji, with subsequent fall, completing reversal.
Near-term focus turns lower after limited correction, eyeing low at 105.24 (02 Mar) and psychological 105 support, with break lower to spark stronger bearish acceleration.
Negative stance is reinforced by firm bearish setup of daily studies, favoring continuation of larger downtrend on break below 105.24 / 00 pivots.
Near-term action is pressured by thick hourly cloud (105.85/106.08) which guards strong barrier and upper pivot at 106.44 (Fibo 23.6% of 110.28/105.24 fall, reinforced by descending 10SMA).
Only firm break above 106.44 would sideline downside risk and signal further recovery.
Res: 105.85, 106.18, 106.44, 106.96
Sup: 105.45, 105.24, 105.00, 104.64
Daily Wave Analysis: Are EUR/USD, GBP/USD Developing Bullish Wave 1?
Currency pair EUR/USD
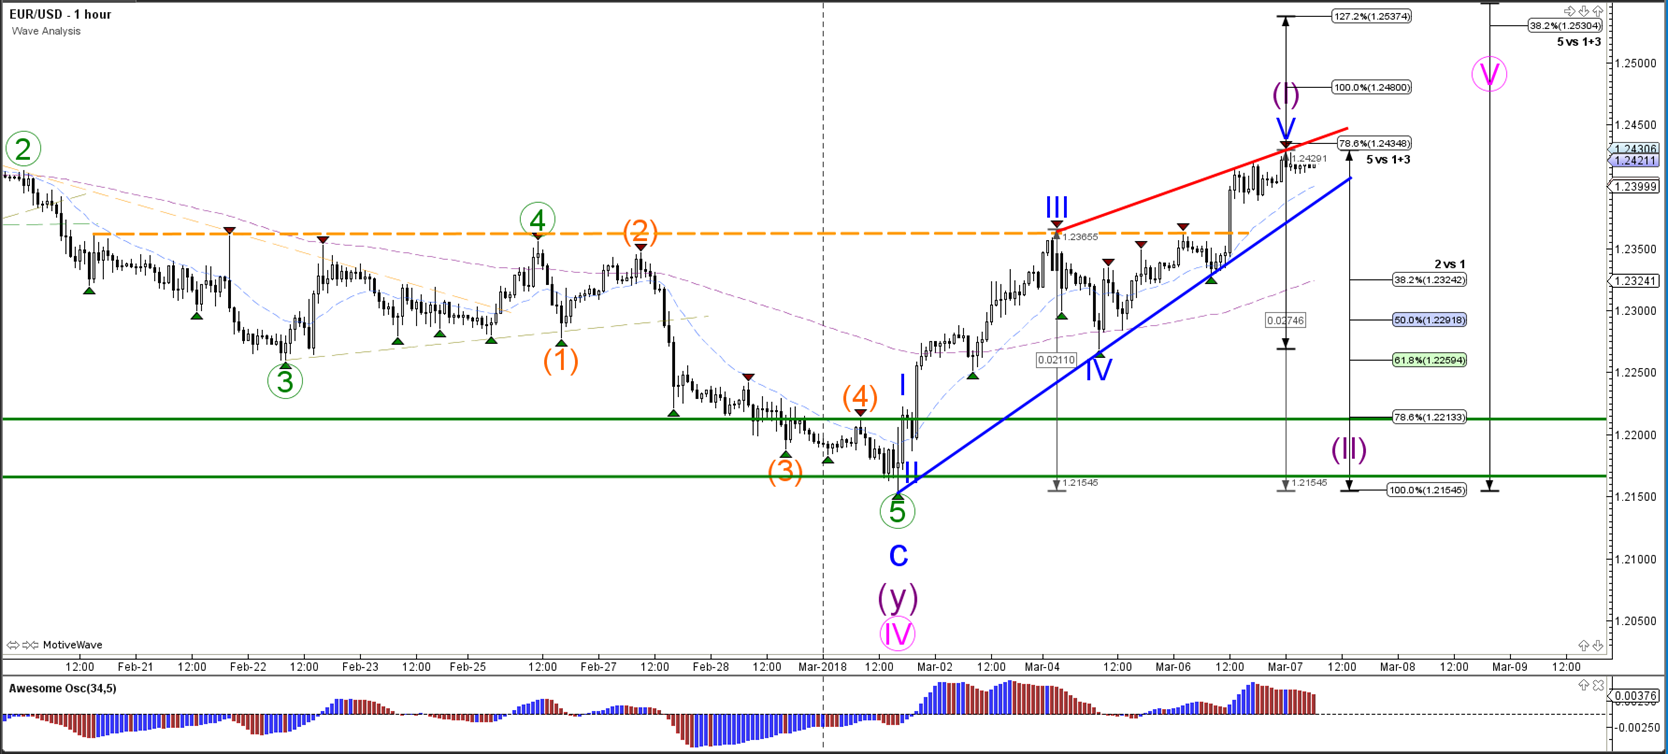
The EUR/USD bullish momentum continued yesterday with a bullish breakout above resistance (dotted orange). A break below the support trend line (blue) could see price retest the left shoulder (purple lines) which could create a potential inverted head and shoulders pattern.
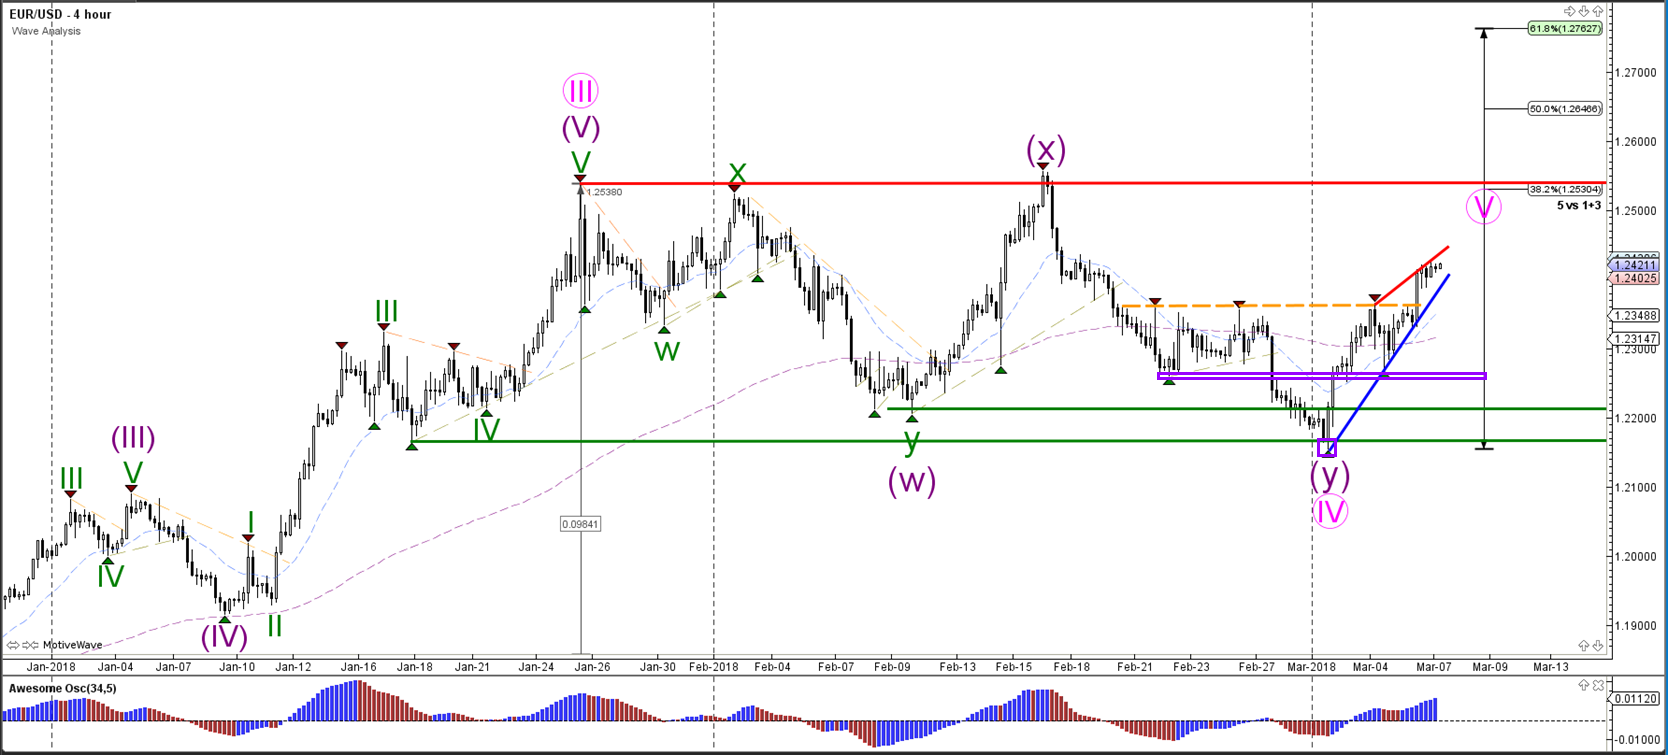 The EUR/USD is probably in a wave 5 (blue) of wave 1 (purple). A break above the 78.6% Fib target could price extend the wave 5 to higher Fib levels whereas a bearish break could see price retest wave 2.
Currency pair GBP/USD
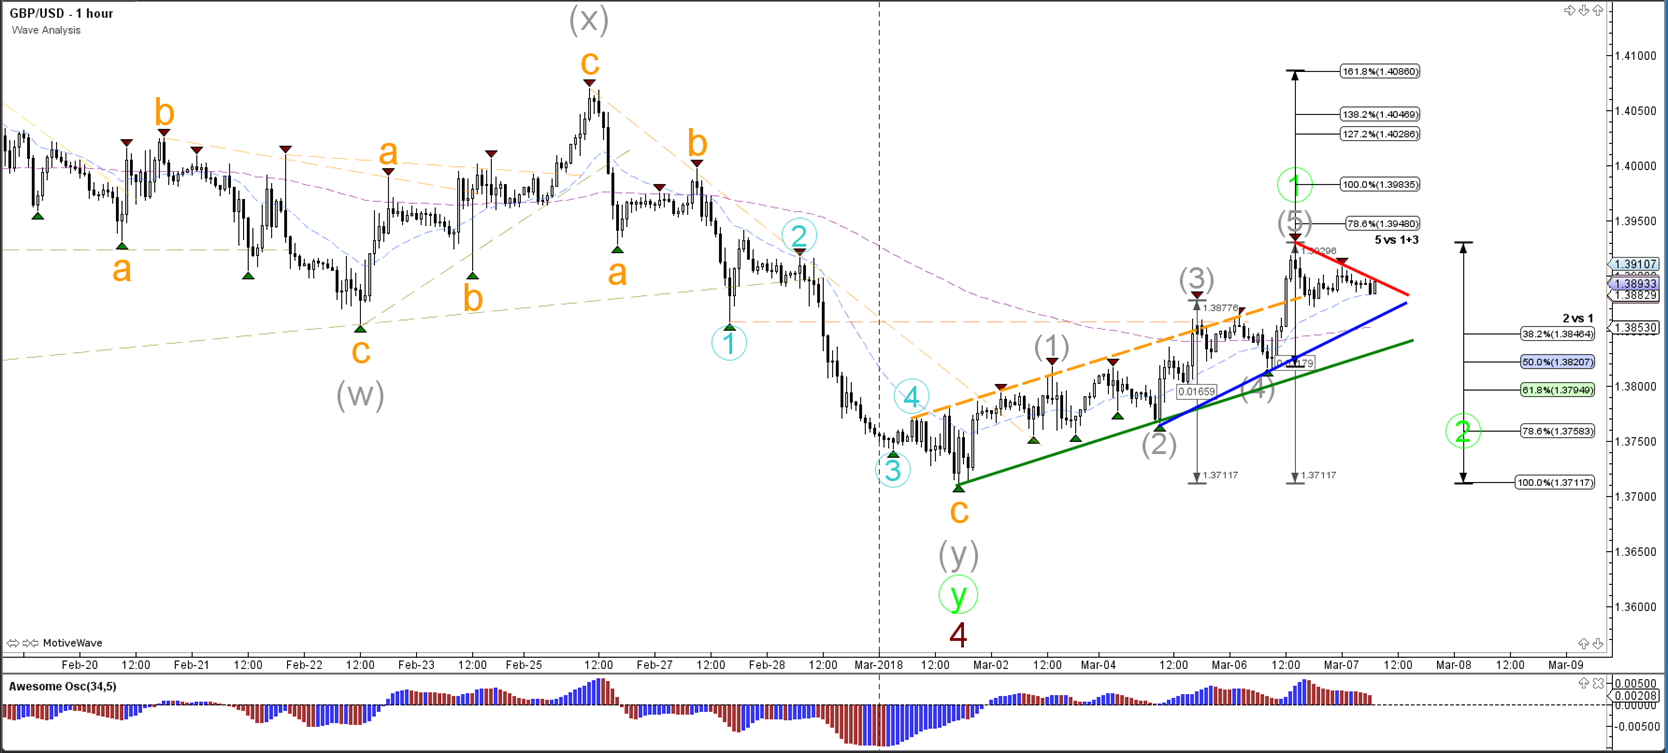
The GBP/USD bullish bounce seems to be showing strong momentum, which makes a wave 1 (green) more likely at the moment. A bullish break above resistance (red) could confirm wave 5 (brown).
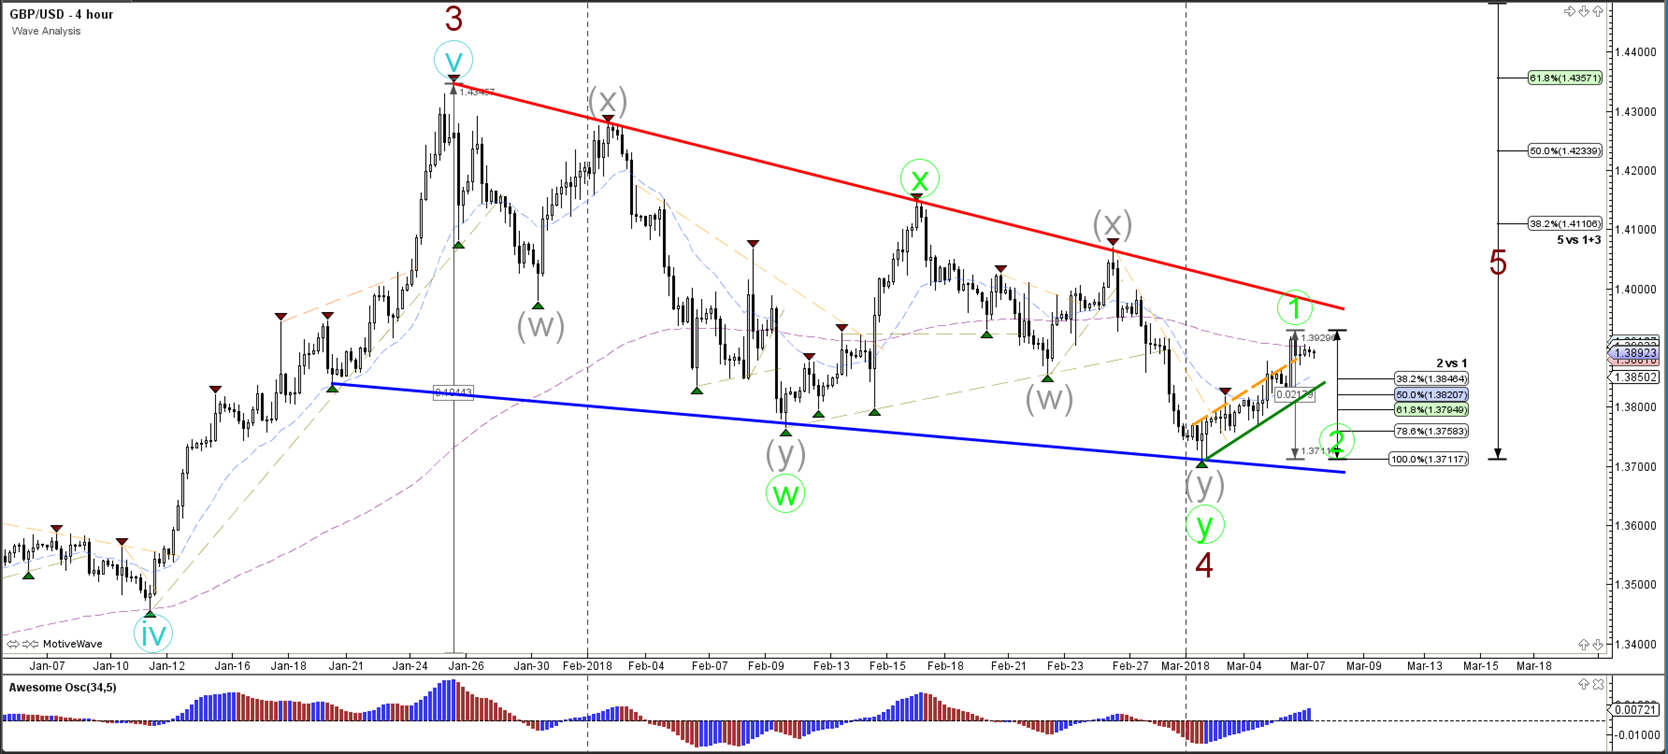
The GBP/USD has either completed a 5th wave (grey) and will correct lower when it breaks support or it could break for one more higher high. A break below the 100% Fib of wave 2 vs 1 invalidates the wave 2.
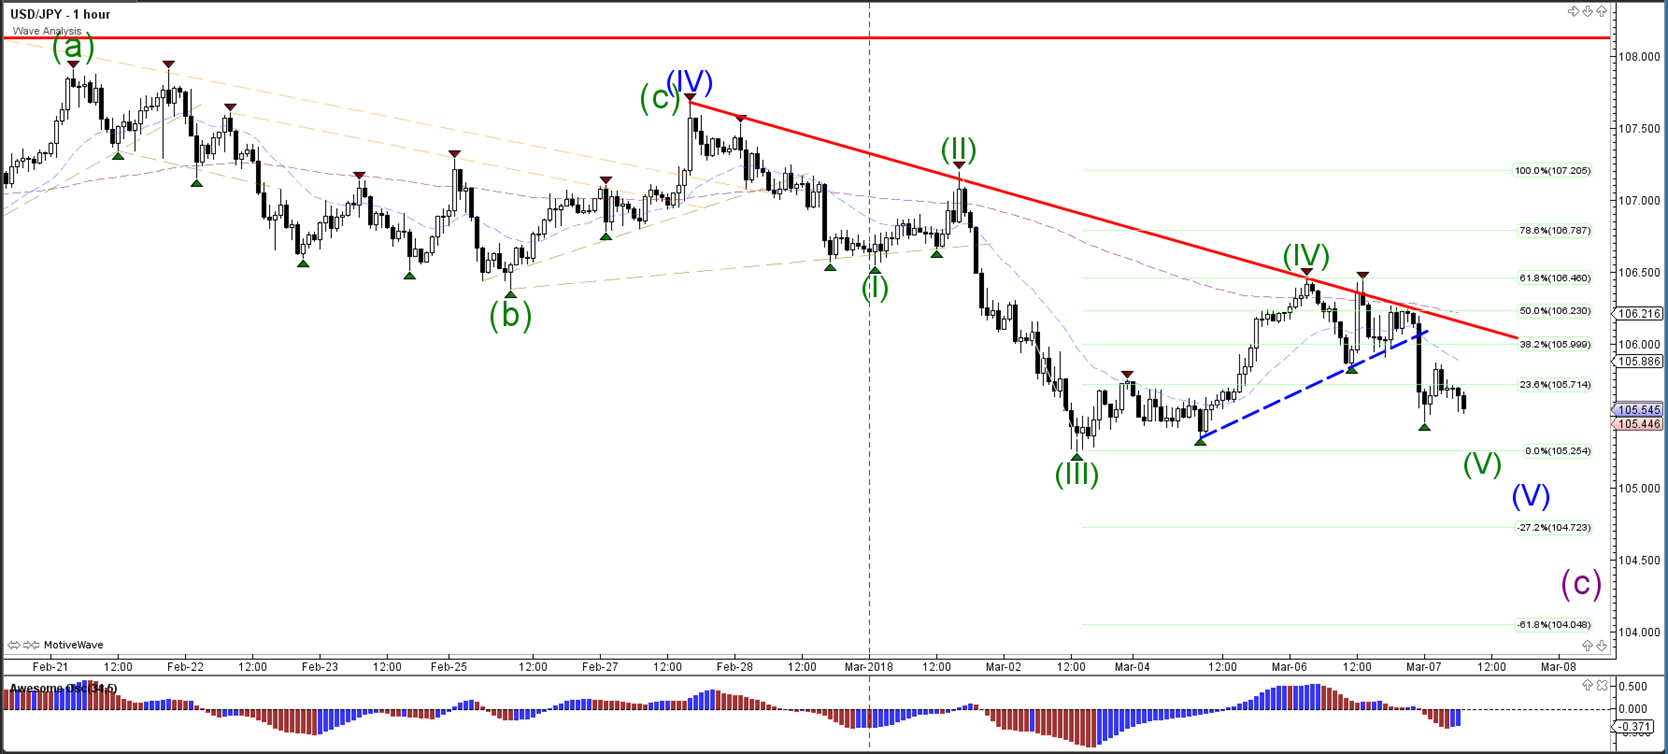
Currency pair USD/JPY
The USD/JPY did not manage to break above the resistance trend line (red) and therefore could still be in a wave 5 (blue).
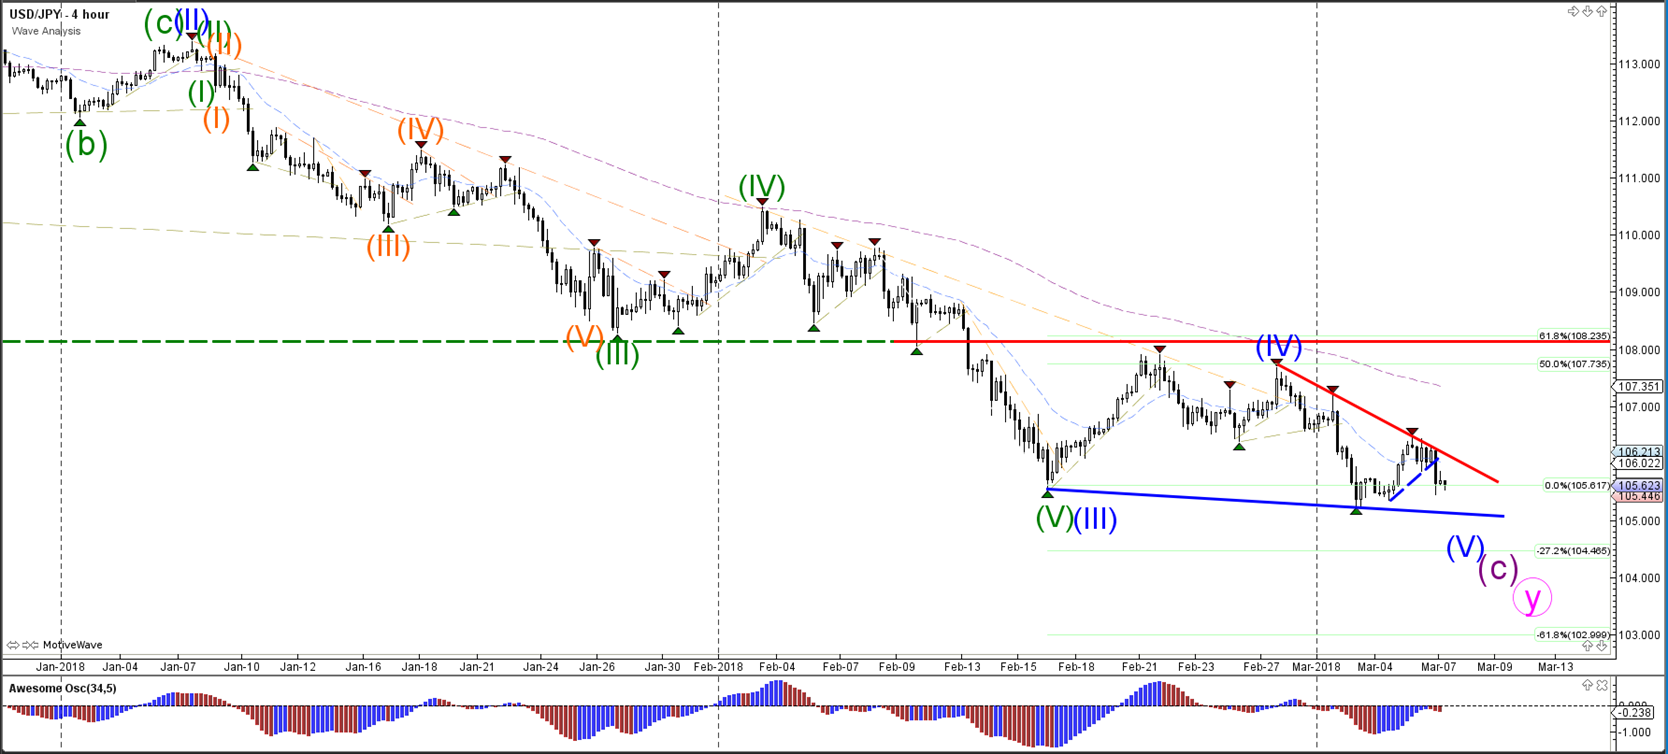
A bearish reversal took place at the resistance trend line and price seems to be building one more wave 5.
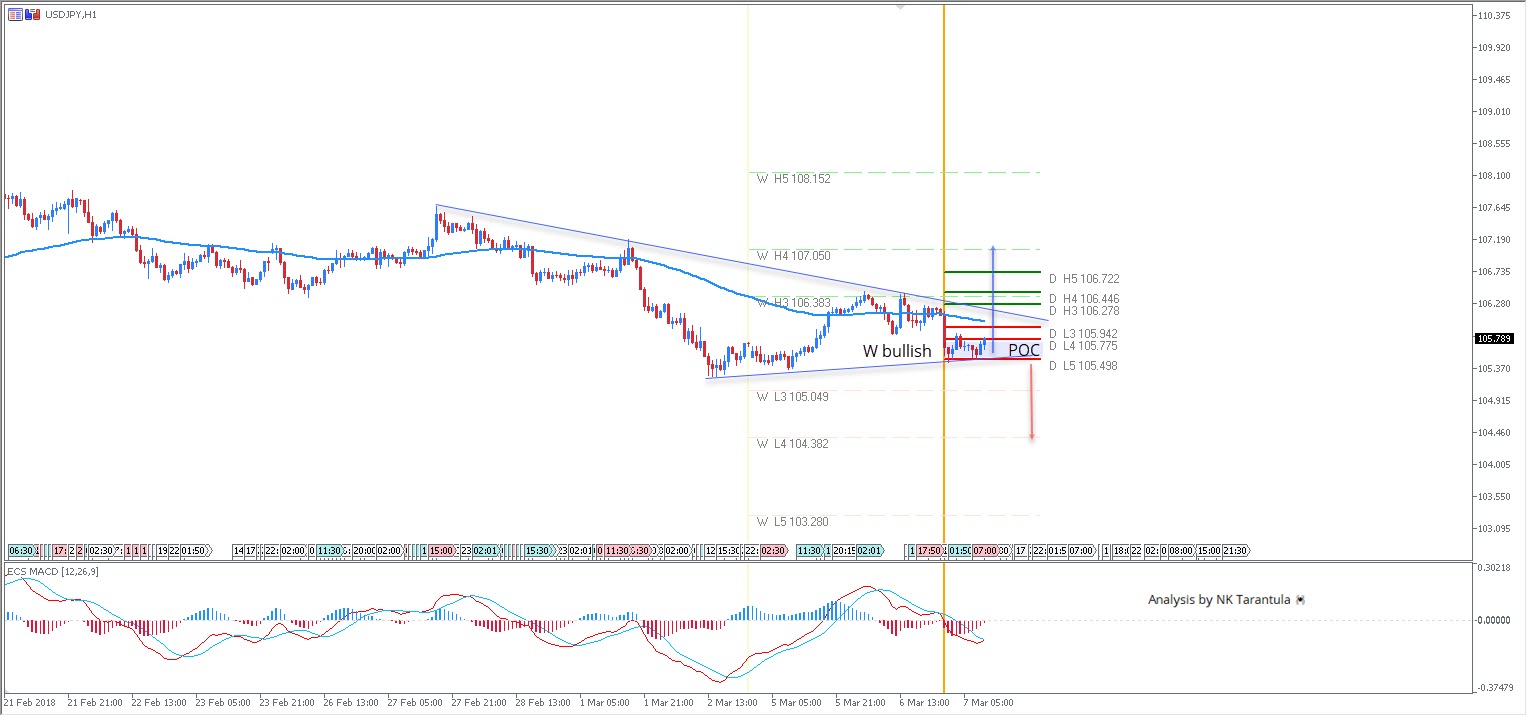
USD/JPY W Bullish Pattern At Daily Support
The USD/JPY dropped heavily to its session lows after Trump cancelled Thursday's Tariff meeting. Now we can see that the price is exactly at the POC zone and it is either "make it or break it".The price might spike from 105.75-60 zone to the upside. In that case targets are 105.94 and 106.25. Only above 106.25 targets are 106.44 and 106.72. H1 momentum or 4h close above 106.75 aims for 107.05.A drop below 105.45 should target 105.04. If we see a daily close below 105.00 then 104.38 is next target.
W H3 - Weekly Camarilla Pivot (Weekly Interim Resistance)
W H4 - Weekly Camarilla Pivot (Strong Weekly Resistance)
M H4 - Monthly Camarilla Pivot (Very Strong Monthly Resistance)
M L3 – Monthly Camarilla Pivot (Monthly Support)
M L4 – Monthly H4 Camarilla (Monthly Strong Daily Support)
POC - Point Of Confluence (The zone where we expect price to react aka entry zone)
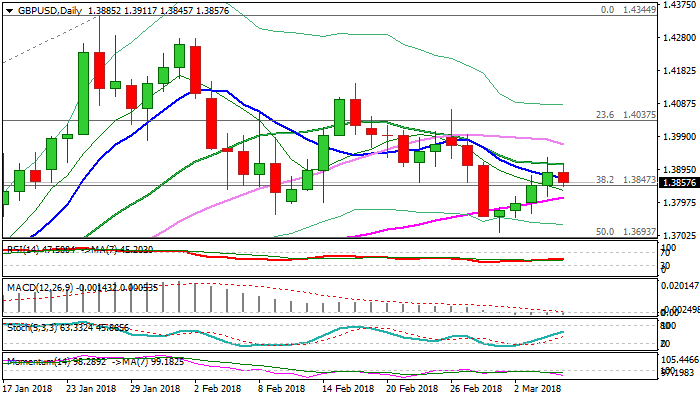
Technical Outlook: GBPUSD Looks For Break Through 20 Or 55SMA’s For Fresh Direction Signal
Cable holds in red in early European trading on Wednesday, accelerating lower after upside attempts were rejected under Tuesday's new recovery high and capped by 20SMA (1.3911).
Fresh risk aversion on Trump advisor Cohn's resignation dragged sterling lower after for straight bullish days.
Near-term action is holding between 20SMA (0.3911) and rising 55SMA (1.3813), with fresh direction signal to be generated on break of either side.
Sideways-moving 20SMA which repeatedly capped recovery marks pivotal resistance, while ascending 55SMA underpinned bullish acceleration in past two days and marks lower trigger.
Lift above 20SMA is needed to open way for final push towards next key barriers at 1.3932 (Fibo 61.8% of 1.4070/1.3711) and 1.3960 (daily cloud top), break of which would generate stronger bullish signal.
Conversely, loss of 55SMA would signal an end of corrective phase from 1.3711 and shift near-term bias lower.
Mixed setup of daily MA's and firmly negative momentum studies provide no clear direction signals, which could be provided on break through initial pivots.
Res: 1.3911, 1.3932, 1.3960, 1.3996
Sup: 1.3845, 1.3813, 1.3766, 1.3740