
Sample Category Title
Canadian Retail Sales Posted Its Biggest Drop Since March 2016 In December
For the 24 hours to 23:00 GMT, the USD rose 0.07% against the CAD and closed at 1.2704.
The Canadian Dollar fell against the USD, after Canada's retail sales suffered an unexpected drop in December.
Data indicated that Canada's retail sales surprisingly declined 0.8% on a monthly basis in December, dipping by the most in nearly 2 years and confounding market estimates for a flat reading. Retail sales had climbed by a revised 0.3% in the previous month.
In the Asian session, at GMT0400, the pair is trading at 1.2717, with the USD trading 0.1% higher against the CAD from yesterday's close.
The pair is expected to find support at 1.2674, and a fall through could take it to the next support level of 1.2632. The pair is expected to find its first resistance at 1.2757, and a rise through could take it to the next resistance level of 1.2798.
Ahead in the day, all eyes would be on Canada's consumer price inflation data for January.
The currency pair is showing convergence with its 20 Hr moving average and trading above its 50 Hr moving average.

EUR/USD Daily Outlook
Daily Pivots: (S1) 1.2276; (P) 1.2314 (R1) 1.2369; More....
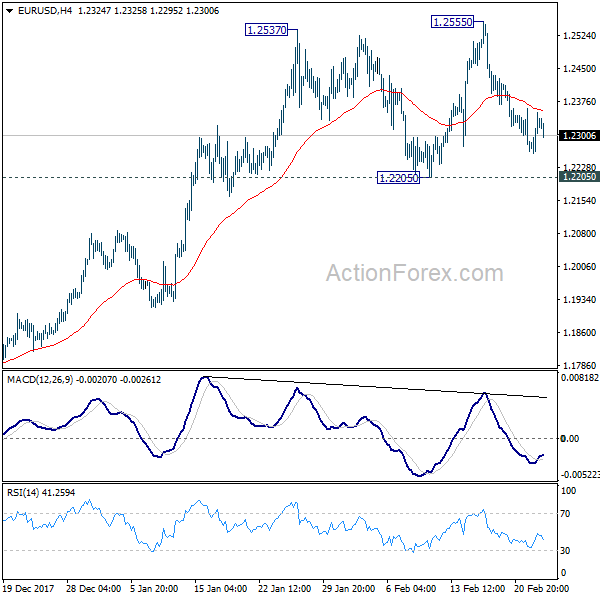
Intraday bias in EUR/USD remains neutral at this point as it's staying in range of 1.2205/2555. On the upside, break of 1.2555 will revive the bullish case of up trend resumption and target 100% projection of 1.0569 to 1.2091 from 1.1553 at 1.3075. However, break of 1.2205 will confirm rejection by 1.2516 key fibonacci level and trend reversal.
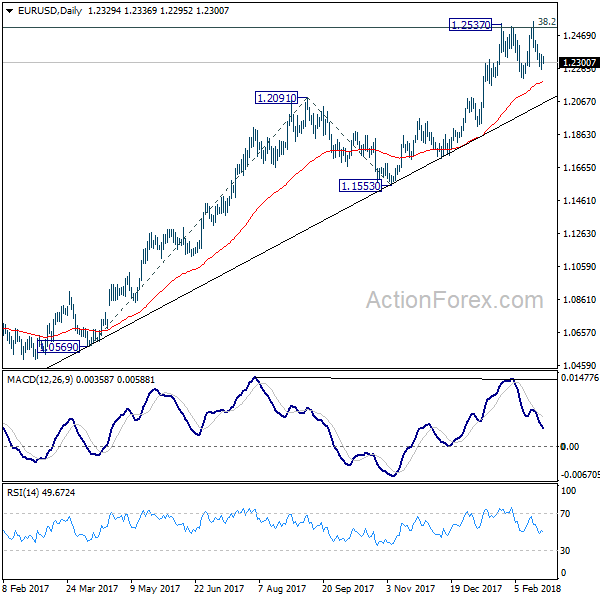
In the bigger picture, key fibonacci level at 38.2% retracement of 1.6039 (2008 high) to 1.0339 (2017 low) at 1.2516 remains intact despite attempts to break. Hence, rise from 1.0339 medium term bottom is still seen as a corrective move for the moment. Rejection from 1.2516 will maintain long term bearish outlook and keep the case for retesting 1.0039 alive. However, sustained break of 1.2516 will carry larger bullish implication and target 61.8% retracement of 1.6039 to 1.0339 at 1.3862.
GBP/USD Daily Outlook
Daily Pivots: (S1) 1.3878; (P) 1.3933; (R1) 1.4010; More....
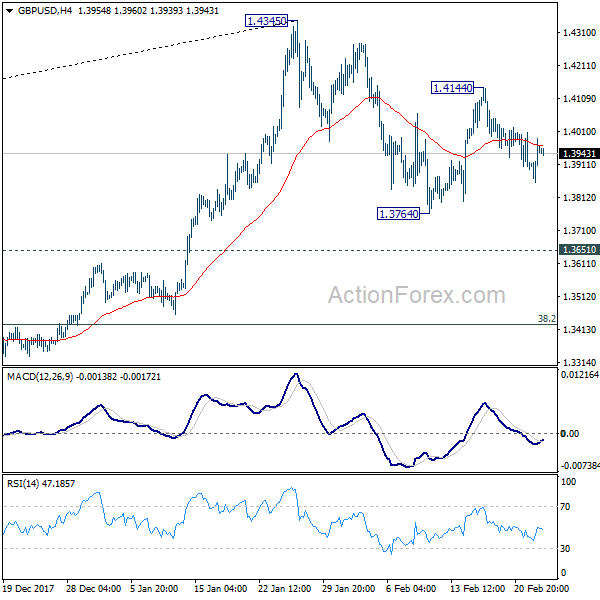
Intraday bias in GBP/remains neutral at this point. On the upside, break of 1.4144 will extend the rebound from 1.3764 and target a test on 1.4345 resistance. Break there will resume larger up trend and target long term trend line resistance (now at 1.5105). On the downside, below 1.3764 will extend the correction from 1.4345 to 1.3651 resistance turned support instead.
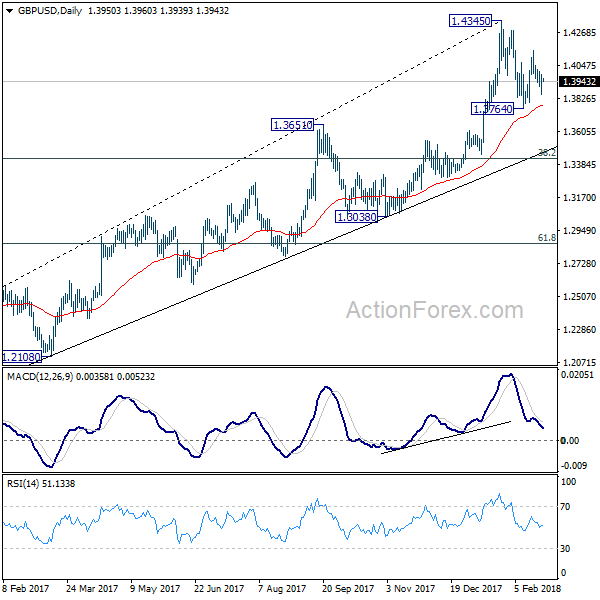
In the bigger picture, as long as 1.3038 support holds, medium term outlook in GBP/USD will remains bullish. Rise from 1.1946 is at least correcting the long term down from 2007 high at 2.1161. Further rally would be seen back to 38.2% retracement of 2.1161 (2007 high) to 1.1946 (2016 low) at 1.5466. However, GBP/USD fails to sustain above 55 month EMA (now at 1.4279) so far. Break of 1.3038 support, will suggests that rise from 1.1946 has completed and will turn outlook bearish for retesting this low.
USD/CHF Daily Outlook
Daily Pivots: (S1) 0.9298; (P) 0.9354; (R1) 0.9382; More...
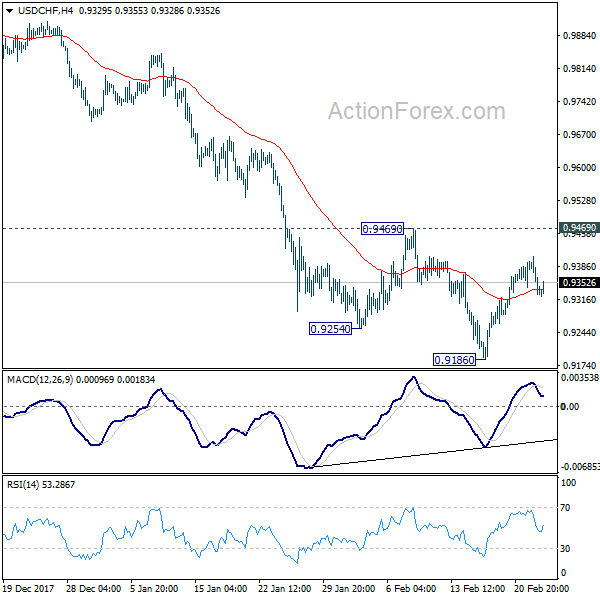
Intraday bias in USD/CHF remains neutral as it's bounded in consolidation from 0.9186. With 0.9469 resistance intact, near term outlook stays bearish. Break of 0.9186 will extend the larger down trend to 0.9115 medium term projection level next. However, considering bullish convergence condition in 4 hour MACD, break of 0.9469 will indicate near term reversal and turn outlook bullish for 55 day EMA (now at 0.9527) and above.
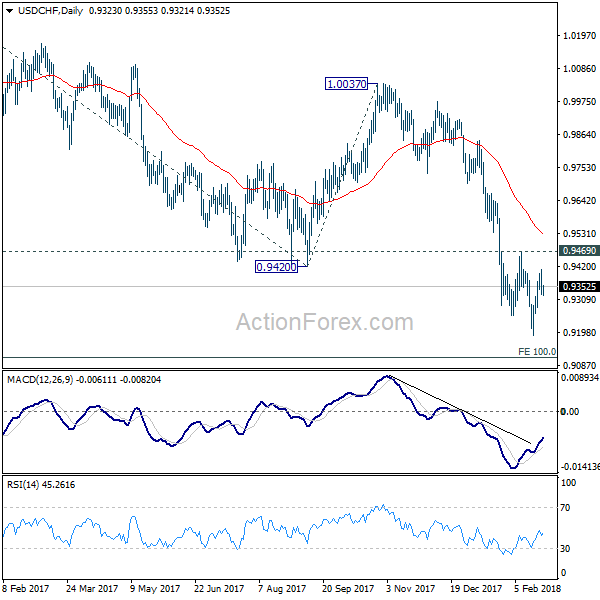
In the bigger picture, fall from 1.0342 is developing into a medium term down trend. Deeper decline should be seen to 100% projection of 1.0342 to 0.9420 from 1.0037 at 0.9115. Break will target 161.8% projection at 0.8545. In any case, sustained trading above 55 day EMA is needed to be the first sign of medium term reversal. Otherwise, outlook will stay bearish even in case of strong rebound.
USD/JPY Daily Outlook
Daily Pivots: (S1) 106.31; (P) 107.03; (R1) 107.48; More...
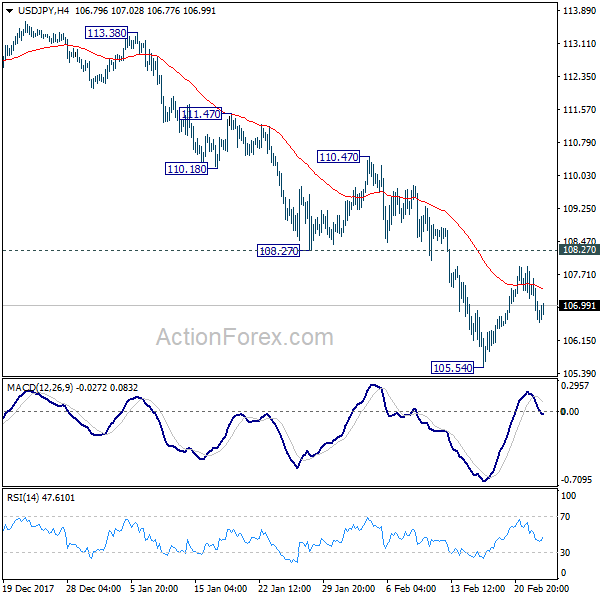
Intraday bias in USD/JPY remains neutral as consolidation from 105.54 is extending. Outlook remains bearish with 108.27 resistance intact and deeper fall is expected. Break of 105.54 will extend the larger fall from 118.65 and target 100% projection of 118.65 to 108.12 from 114.73 at 104.20 next. However, break of 107.72 will be the first sign of near term reversal and will target 110.47 resistance for confirmation.
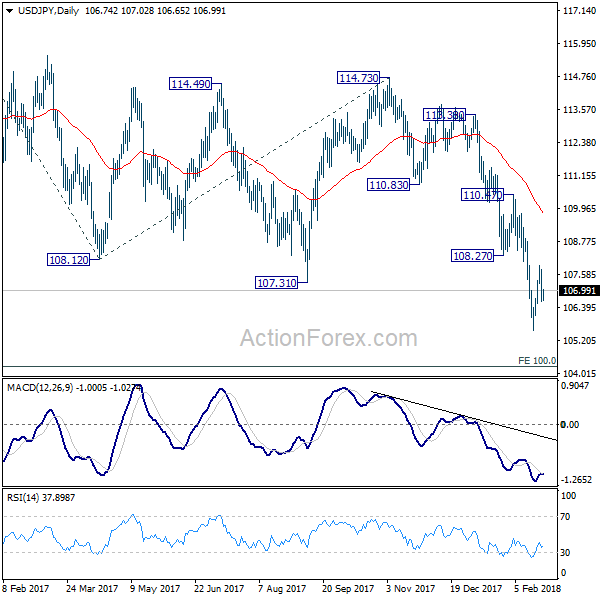
In the bigger picture, current development argues that the corrective pattern from 118.65 is extending. The solid break of 61.8% retracement of 98.97 to 118.65 at 106.48. now suggests that the pattern from 125.85 high is possibly extending. Deeper fall could be seen through 98.97 key support (2016 low). This bearish case will now be favored as long as 110.47 resistance holds.
AUD/USD Daily Outlook
Daily Pivots: (S1) 0.7804; (P) 0.7832; (R1) 0.7873; More...
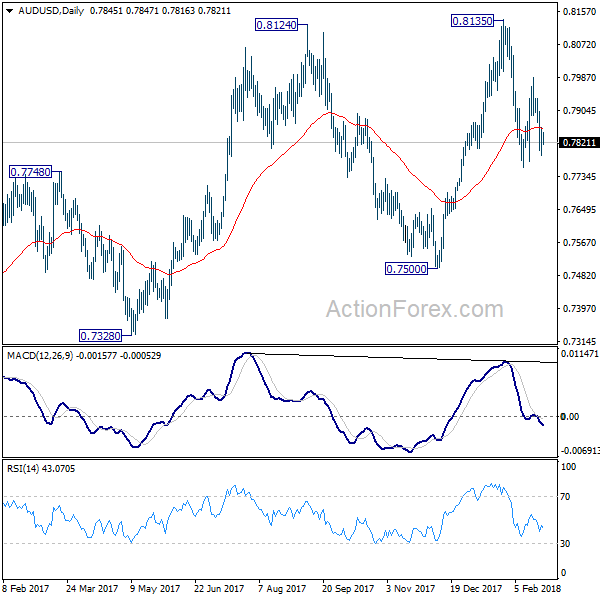
No change in AUD/USD's outlook as it's still bounded in range of 0.7758/7988. Intraday bias remains neutral. On the downside, below 0.7758 will resume the fall from 0.8135 and target 0.7500 key near term support. On the upside, above 0.7988 will extend the rebound to retest 0.8135.At this point, there is no strong case for a range breakout yet and 0.7500/8135 could hold for a while.
In the bigger picture, medium term rebound from 0.6826 is seen as a corrective move. It might still extend higher but we'd expect strong resistance from 38.2% retracement of 1.1079 to 0.6826 at 0.8451 to limit upside to bring long term down trend resumption. On the downside, break of 0.7500 support will now be an important signal that such corrective rebound is completed.

Dollar Confined in Range, Loonie to Look into CPI
Outlook in the forex markets remain basically unchanged. Dollar is trading as the strongest major currency for the week. However, it remains bounded in recent range against others. Current rebound is viewed as a corrective move and there is no change in the bearish down trend yet. Yen and Sterling are following as the second and third strongest. Meanwhile, commodity currencies are trading broadly lower. In particular, Canadian Dollar is broadly pressured after yesterday's weak retail sales data. The loonie will turn to CPI release today for more guidance.
Fed Kaplan: Three hikes a reasonable base case
Dallas Fed Robert Kaplan said that the tax cut may deliver "too much of a good thing" as fiscal stimulus". And, it's "wise" to take back some of the monetary accommodation. He believed three rate hikes year is a "reasonable" base case. Nonetheless, that could change if employment and inflation developments exceed his expectations.
ECB Smets: FX volatility a point of attention
ECB Governing Council member Jan Smets said that the "volatility on the foreign exchange markets remains a point of attention" fro the central bank. Nonetheless, he emphasized that the strength of Euro is not as problem as long as it's supported by fundamentals. He added that "only if, as we said last time after our monetary policy meeting in Frankfurt, this volatility becomes excessive, when certain levels are breached because of overshooting, because of a devaluation policy to increase competitiveness, can problems occur."
Most Analysts saw USD/JPY best at 110-114
According to a Reuters poll between February 16-22, 22 out of 34 economists expected BoJ to keep interest rate at zero throughout 2018. Most expected BoJ to keep year yield target at zero this year. 28 out of 36 expected the central bank to keep ETF purchase at around JPY 6T while 8 expected the amount to be cut later this year or afterwards. Regarding the exchange rate, 20 of 34 saw USD/JPY at 110-114 as optimal for the economy. 8 saw 105-109 while 3 said 115-119. Another three said 120 or above.
On the data front
New Zealand retail sales rose more than expected by 1.7% qoq in Q4. Japan national CPI core was unchanged at 0.9% yoy in January, corporate service price rose 0.7% yoy. German GDP final and Eurozone CPI final will be the main feature in the European session. Canadian CPI will be the focus later in the day.
USD/CAD Daily Outlook
Daily Pivots: (S1) 1.2667; (P) 1.2709; (R1) 1.2748; More....
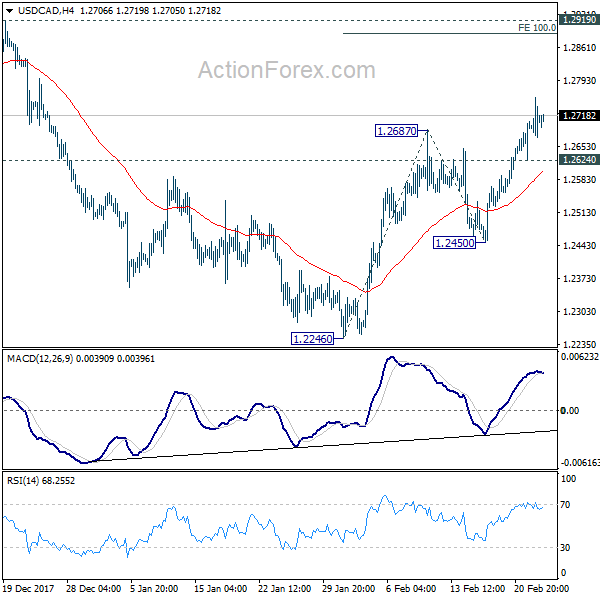
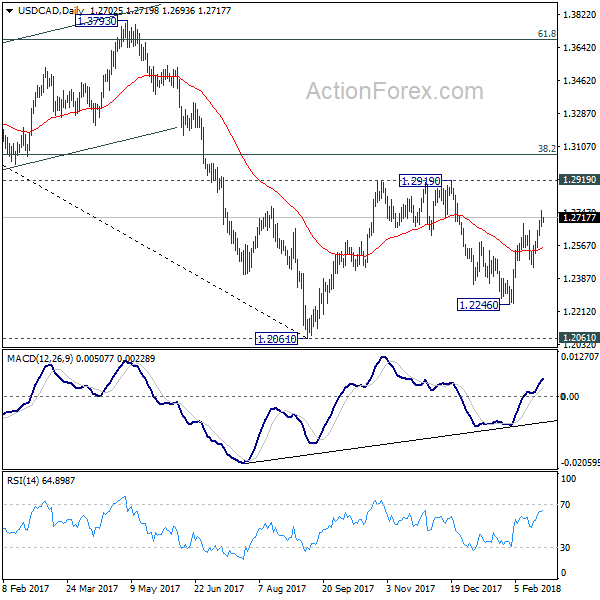
Intraday bias in USD/CAD remains on the upside as rebound from 1.2246 would target 100% projection of 1.2246 to 1.2687 from 1.2450 at 1.2891, which is close to 1.2919 key resistance. We'd be cautious on strong resistance from there to limit upside. On the downside, below 1.2624 minor support will turn intraday bias neutral first. But further rally would be mildly in favor as long as 1.2450 support holds.
In the bigger picture, the rebound from 1.2246 is mixing up the medium term outlook. Nonetheless, USD/CAD is staying below falling 55 week EMA (now at 1.2776), hence, the bearish case is in favor. That is, fall from 1.4689 is not completed yet. Sustained break of 1.2061 key support will carry larger bearish implication and target 61.8% retracement of 0.9406 to 1.4689 at 1.1424. However, firm break of 1.2919 will revive the case of medium term reversal and turn outlook bullish.
Economic Indicators Update
| GMT | Ccy | Events | Actual | Forecast | Previous | Revised |
|---|---|---|---|---|---|---|
| 21:45 | NZD | Retail Sales Ex Inflation Q/Q Q4 | 1.70% | 1.30% | 0.20% | 0.30% |
| 23:30 | JPY | National CPI Core Y/Y Jan | 0.90% | 0.80% | 0.90% | |
| 23:50 | JPY | Corporate Service Price Y/Y Jan | 0.70% | 0.80% | 0.80% | |
| 7:00 | EUR | German GDP Q/Q Q4 F | 0.60% | 0.60% | ||
| 10:00 | EUR | Eurozone CPI M/M Jan | -0.90% | 0.40% | ||
| 10:00 | EUR | Eurozone CPI Y/Y Jan F | 1.30% | 1.40% | ||
| 10:00 | EUR | Eurozone CPI Core Y/Y Jan F | 1.00% | 1.00% | ||
| 13:30 | CAD | CPI M/M Jan | 0.50% | -0.40% | ||
| 13:30 | CAD | CPI Y/Y Jan | 1.50% | 1.90% | ||
| 13:30 | CAD | CPI Core - Common Y/Y Jan | 1.60% | |||
| 13:30 | CAD | CPI Core - Median Y/Y Jan | 1.90% | |||
| 13:30 | CAD | CPI Core - Trim Y/Y Jan | 1.90% |
USD/CAD Daily Outlook
Daily Pivots: (S1) 1.2667; (P) 1.2709; (R1) 1.2748; More....
Intraday bias in USD/CAD remains on the upside as rebound from 1.2246 would target 100% projection of 1.2246 to 1.2687 from 1.2450 at 1.2891, which is close to 1.2919 key resistance. We'd be cautious on strong resistance from there to limit upside. On the downside, below 1.2624 minor support will turn intraday bias neutral first. But further rally would be mildly in favor as long as 1.2450 support holds.
In the bigger picture, the rebound from 1.2246 is mixing up the medium term outlook. Nonetheless, USD/CAD is staying below falling 55 week EMA (now at 1.2776), hence, the bearish case is in favor. That is, fall from 1.4689 is not completed yet. Sustained break of 1.2061 key support will carry larger bearish implication and target 61.8% retracement of 0.9406 to 1.4689 at 1.1424. However, firm break of 1.2919 will revive the case of medium term reversal and turn outlook bullish.
USD/JPY Is Facing Tough Challenge On Upside
Key Highlights
- The US Dollar recovered recently, but it failed to move above the 107.90 resistance against the Japanese Yen.
- There is a major bearish trend line forming with current resistance at 107.40 on the 4-hours chart of USD/JPY.
- The pair is under bearish pressure and it may perhaps retest the 106.00 support.
- The US Initial Jobless Claims for the week ending Feb 17, 2018 declined from the last revised reading of 229K to 222K.
USDJPY Technical Analysis
Earlier this week, the US Dollar started a recovery and moved above 107.00 against the Japanese Yen. However, the USD/JPY pair could not break the 107.90-108.00 resistance and moved down.
Looking at the 4-hour chart, the pair failed to trade above a major bearish trend line with current resistance at 107.40. The pair traded as high as 107.94 and is currently moving lower.
It traded below the 23.6% Fib retracement level of the last wave from the 105.54 low to 107.94 high. It seems like the pair is under pressure and it could extend the current downside move.
It already tested the 50% Fib retracement level of the last wave from the 105.54 low to 107.94 high. Therefore, if it breaks the 106.70 support level, it could move back towards the 106.00 support.
On the upside, an initial resistance is around 107.20. However, the most important hurdle for buyers is near the bearish trend line with current resistance at 107.40. As long as the pair is below 107.40, it may remain in a negative zone.
Recently, the US Initial Jobless Claims for the week ending Feb 17, 2018 was released by the US Department of Labor. The market was looking for no change in the claims from 230K.
However, the actual result was better, as there was a decline in claims to 222K. Moreover, the last reading was revised down to 229K.
The report added:
The previous week’s level was revised down by 1,000 from 230,000 to 229,000. The 4-week moving average was 226,000, a decrease of 2,250 from the previous week’s revised average. The previous week’s average was revised down by 250 from 228,500 to 228,250.
Overall, the US Dollar seems to be struggling to gain upside momentum. USD/JPY must break the 107.40 level to start a fresh upside recovery.
Market Morning Briefing: The Euro-Yen Saw A Low Near 131.30
STOCKS
Dow (24962.48, +0.66%) moved up sharply about 166 points yesterday, contrary to our expectation of testing lower levels of 24500-24000. Overall trade within 25500-24500 region looks possible in the coming sessions.
Dax (12461.91, -0.07%) has dipped lower in line with our expectation. A test of 12300 is possible on the downside before the index again starts to inch upwards targeting 12600 in the medium term. Overall the index is likely to remain range bound.
Nikkei (21814.31, +0.36%) is trading higher contrary to our expectation of a test of support near 21200-21000. As mentioned earlier, the index now has some scope on the upside towards 22500 while above 21000. Near term looks bullish.
Shanghai (3279.52, +0.34%) breaks above 3260/70 levels mentioned yesterday and could now be headed towards 3300-3350 in the early sessions next week. Near term is likely to be bullish.
Stability around the support levels on both Nifty (10382.70, -0.14%) and Sensex (33819.50, -0.07%) is retained just now but the immediate supports re unable to produce a sharp bounce from current levels. Could this indicate an eventual break below current levels in the near to medium term? Maybe. An end in the current stable and range bound trade would lead to some sharp movement on either direction. While immediate supports lacks strength, our preference would be on the downside.
COMMODITIES
WTI (62.81) and Brent (66.34) have risen sharply and are trading higher today. A report from the EIA states that the crude oil inventories at 420.5mln barrels are in the lower half of the seasonal average and is likely to stimulate optimism. The prices could see a rise today followed by some dip in the next week.
As mentioned yesterday, 1320 is an important near term support for Gold (1329) and while that holds, Gold is likely to move back towards 1350-1360 levels in the near term. A break below 1320 if seen and sustains, could be vulnerable for the metal increasing chances of testing 1315-1310 by end of next week.
Copper (3.22) is likely to trade in the 3.15-3.30 region for the near term.
FOREX
The Dollar Index (89.836) after testing resistance on daily candles near 90.1-90.2 yesterday didn’t rise to test higher resistance on weekly candles near 90.3-90.4.The Dollar Index has ranged between the broad 88.,5-90.5 zone for the last 3 weeks and if the same ranging continues next week, downside target could be support on daily and weekly candles near 88.25-88.50. The EU CPI data release later today and the US Consumer Confidence and US GDP data release next week could be further market movers for the major currencies next week.
Euro (1.2318) saw a low near 1.226 yesterday and tested lower support near 1.2275-1.2265 on the daily candles (which was also seen as crucial support on weekly candles). We had written about chances of a false break of support on weekly candles towards 1.221-1.223, but that didn’t take place, and the Euro is now seeing a bounce. It has been ranging in the broad 1.22-1.255 zone for the last 3 weeks and if the ranging continues, we could again see a test of 1.25 sometime late next week.
The Dollar-Yen (106.89) has dipped from resistance near 107.9-108.0 on the daily candles and could again move down towards 105.5 – seen as support on weekly candles. Yesterday we wrote about the Dollar Yen having seen 4 continuous weeks of upmove on the last 2 occasions when it tested support on weekly candles. It is now looking less likely that the same will get repeated, as the Dollar Yen could continue to stay bearish over the next 1-2 weeks.
The Euro-Yen (131.68) saw a low near 131.30 yesterday and is now trading at levels near 131.6-131.8 indicating that a bounce might be underway. Strength in Euro towards 1.24 and in Yen towards 106 would mean that the Euro yen stays above support on daily candles near 131.30.
Pound (1.3953) saw a low of 1.3857 yesterday but now seems to be bouncing from support on daily candles near 1.39. There is still some possibility of it moving down again next week towards lower support near 1.38 – seen both on daily and 3 day candles.
Dollar-Rupee (65.045): The near-term outlook (one-three days) is unclear. Equal chances of rise towards 65.20 and of fall towards 64.90-80-70.
INTEREST RATES
US 10 Year Yield (2.9335), US 30 year Yield (3.2179), US 5 year yield (2.6687), US 2 year yield (2.254) : As the US bond auctions continue, all 4 yields continue to hover around their long term resistances. There has been a slight dip in the 10 Year yield from yesterday’s highs near 2.95%, which might indicate that there could be a further dip below 2.9% next week.
As mentioned yesterday as well, after this week’s volatility in yields, we might well see another few sessions of consolidation next week. A decisive breach of long term resistances towards 3% for the 10 Year yield still looks to be few weeks away.
(Long term resistance levels for the 4 yields earlier mentioned are as follows: 2.85-2.90, 3.20, 2.7 and 2.2 respectively - we have been expecting these levels to hold in this month.)
Japan 10 year yield (0.05%) has come down towards 0.05% after seeing highs near 0.095% in late Jan, reflecting the fact that investors might be moving towards Japanese bonds in these times of volatility.