Sample Category Title
BITCOIN Weakening Further
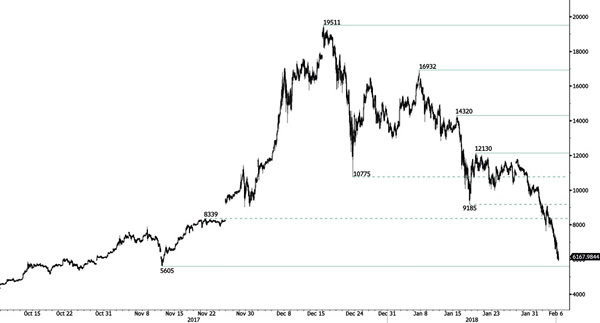
Bitcoin is trading lower. Hourly support at 5'605 (13/11/2017 low) approaches while resistance is located at 12'130 (18/01/2018 high). The short-term technical structure suggests further decline.
In the long-term, the digital currency has had an exponential growth but also presented important downturns. There is decent likelihood that the currency could stabilize between 7'000 - 12'000 in 2018. Bitcoin is trading slightly above its 200 DMA (6'000 range).
EUR/CHF Recovery Continues
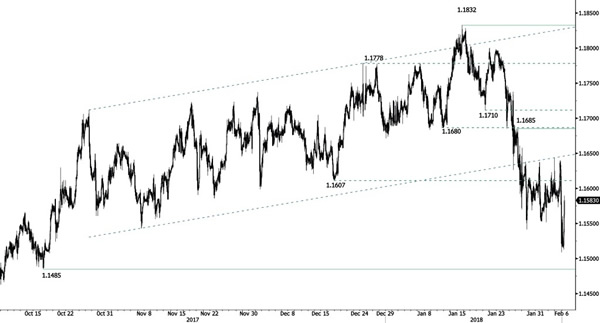
EUR/CHF buying pressure continues. Hourly resistance is given at 1.1685 (26/01/2018 high). Expected to show further short-term upside moves.
In the longer term, the technical structure has reversed. Strong resistance is given at 1.20 (level before the unpeg). Yet, the ECB's slowing QE program is likely to cause buying pressures on the euro, which should weigh in favour of the EUR/CHF. Supports can be found at 1.0184 (28/01/2015 low) and 1.0082 (27/01/2015 low).
EUR/GBP Bullish Momentum
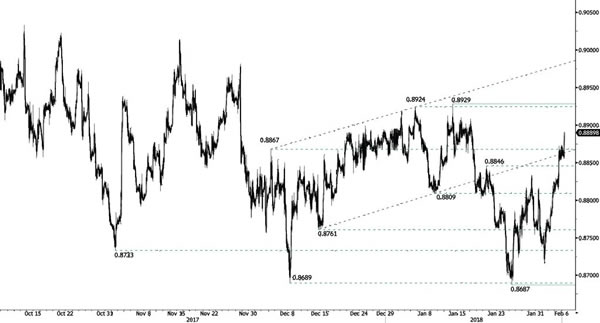
EUR/GBP is trading higher and heads towards hourly resistance at 0.8929 (12/01/2018 high). Hourly resistance at 0.8846 (19/02/2018) is now reached. The technical structure suggests further short-term upside move.
In the long-term, the pair has largely recovered from lows in 2015. The technical structure suggests an upside momentum. The pair is trading above the range of its 200 DMA. Strong resistance can be found at 0.9500 (psychological level).
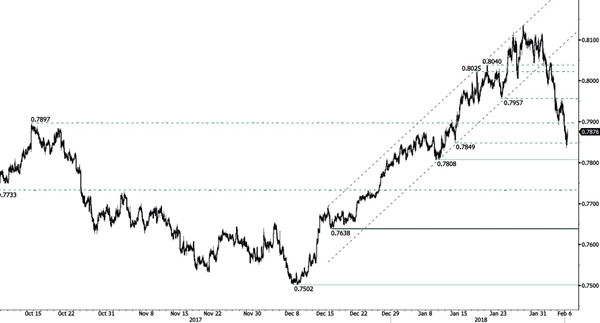
AUD/USD Bouncing Up After Plummeting
AUD/USD is slowly recovering from its recent decline. Support at 0.7849 (12/01/2018 low) is now broken. The technical structure suggests short-term increase.
In the long-term, the trend is turning positive, yet fails reaching key resistance at 0.8164 (14/05/2015 low). Key support stands at 0.6009 (31/10/2008 low). A break of the key resistance at 0.8164 (14/05/2015 high) is needed to invalidate our long-term bearish view.
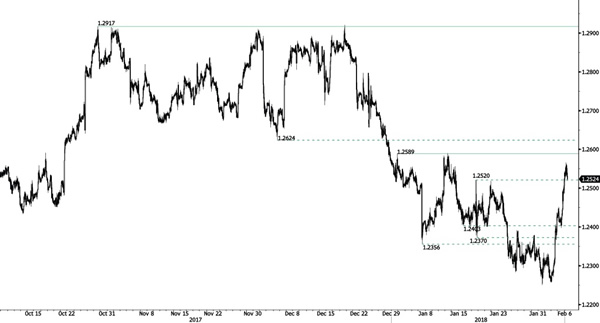
USD/CAD Edging Lower
USD/CAD is weakening after having broken hourly resistance at 1.2520 (17/01/2018 high). Resistance is now given at 1.2589 (01/01/2018). The technical structure indicates that further short-term weakness is expected.
In the longer term, the pair is trading between resistance point at 1.3805 (05/05/2017 high) and support at 1.2128 (18/06/2015 low). Strong resistance is given at 1.4690 (22/01/2016 high). The pair is likely to head lower. The pairs is trading below 200 DMA.
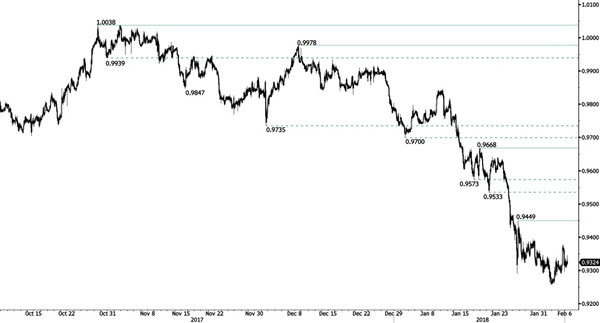
USD/CHF Pushing Higher
USD/CHF is strengthening. Hourly resistance is at 0.9449 (25/01/2018 high). Expected to show further short-term upside move.
In the long-term, the pair is still trading in range since 2011 despite some turmoil when the SNB unpegged the CHF. Support at 0.9259 (24/08/2015 low) is attainable. Key support remains at 0.9072 (07/05/2015 low) while resistance at 1.0344 (15/12/2016 high) is distanced. The technical structure favours a long term bullish bias since the unpeg in January 2015.
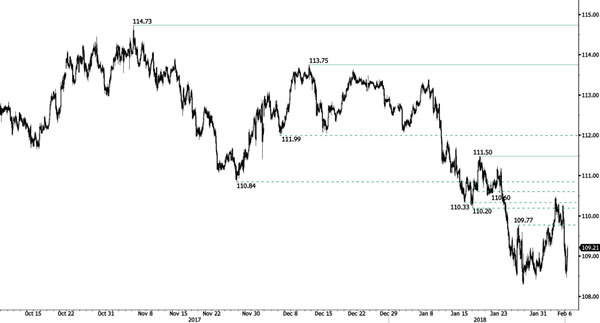
USD/JPY Recovering After Sharp Decline
USD/JPY is rising back following weakness and trades above 109. Hourly resistance remains at 111.50 (18/01/2018 high). The technical structure suggests further short-term upside moves.
We favor a long-term bearish bias. Support is now given at 107.32 (08/09/2017 low). A gradual rise towards the major resistance at 125.86 (05/06/2015 high) seems unlikely. Expected to decline further support at 101.20 (09/11/2016 low).
GBP/USD Slight Ascent Following Free Fall
GBP/USD is bearish pressure pushed the pair at the range of 1.40. The technical structure suggests further potential downside move. Hourly support at 1.3916 (23/01/2018 low) is approaching.
The long-term technical pattern is reversing. The Brexit vote had paved the way for further decline but the pair is now moving up to 2016 highs. A long-term support given at 1.1841 (07/10/2017 low) and a strong resistance at 1.5018 (24/06/2016 high) are identified.
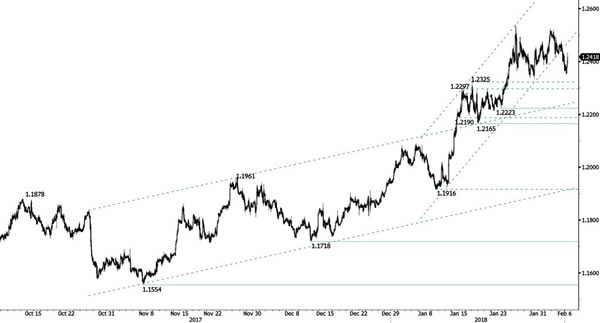
EUR/USD Bouncing Again
EUR/USD is trading mixed. The pair is now retracing and lies well above 1.2325 (17/01/2018 high). Hourly support is given at 1.2223 (23/01/2018 low). The technical structure suggests further short-term upside moves.
In the longer term, the momentum is turning largely positive. We favor a continued bullish bias. Key resistance is holding at 1.2856 (15/10/2014 high) while strong support lies at 1.1554 (08/11/2017 low).
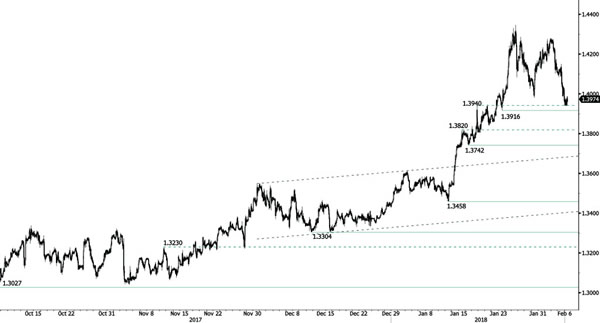
Technical Outlook: GBPUSD – Further Downside While Risk-Off Rules, 1.40 To Ideally Cap Upticks
Recovery attempts from new two-week low at 1.3937, posted after strong fall in past two days, stays so far under broken 1.40 support which reverted to solid resistance (psychological barrier/broken Fibo 38.2% of 1.3457/1.4344 rally).
Pound is expected to remain under pressure on risk-off mode which emerged after strong fall in global stocks.
Close below 1.40 support on Monday was negative signal, with near-term techs now in bearish mode and supportive for further easing.
Completion of failure swing pattern on daily chart adds of growing bearish pressure.
Fresh bears would look for next target at 1.3900 (rising daily Kijun-sen/50% retracement of 1.3457/1.4344) and could extend towards 1.3800 support (rising 30 SMA/near Fibo 61.8%). Corrective actions should ideally stay capped under 1.40 handle, with extended upticks not ruled out and expected to stall under pivotal barrier at 1.4124 (broken 10SMA).
Res: 1.4000, 1.4025, 1.4043, 1.4091
Sup: 1.3937, 1.3900, 1.3850, 1.3800