
Sample Category Title
USD/CHF Mid-Day Outlook
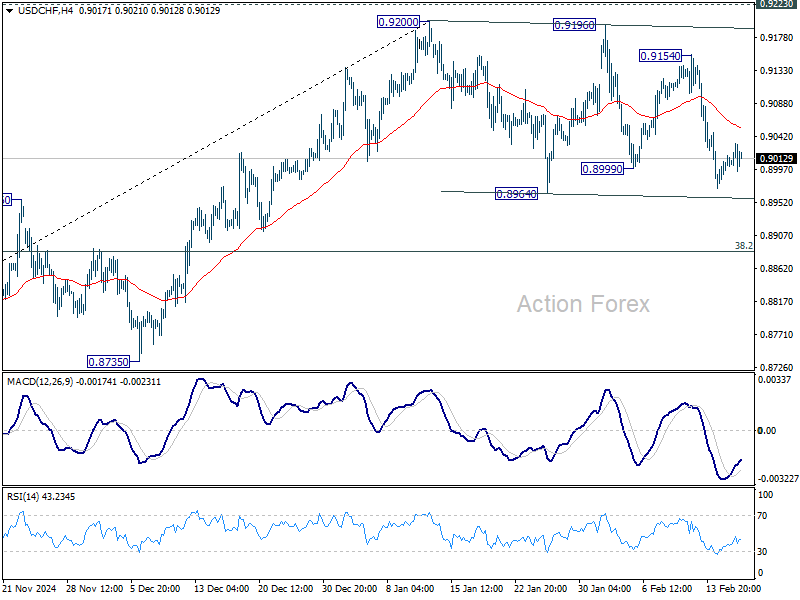
Daily Pivots: (S1) 0.8981; (P) 0.9000; (R1) 0.9026; More…
Intraday bias in USD/CHF remains neutral as consolidation from 0.9200 is still in progress. While deeper pull back might be seen, outlook will stay mildly bullish as long as 38.2% retracement of 0.8374 to 0.9200 at 0.8884 holds. On the upside, firm break of 0.9223 key resistance will carry larger bullish implication. However, sustained break of 0.8884 will indicate bearish reversal, and target 61.8% retracement at 0.8690 instead.
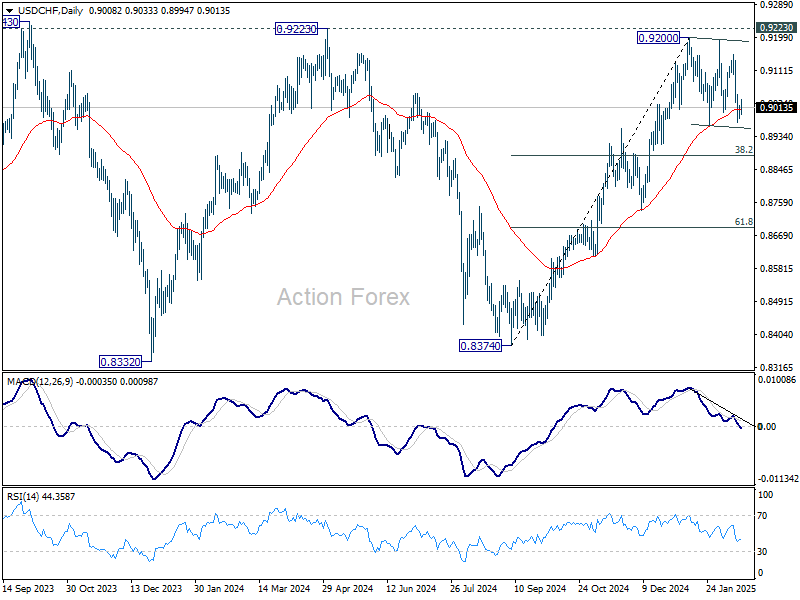
In the bigger picture, decisive break of 0.9223 resistance will argue that whole down trend from 1.0342 (2017 high) has completed with three waves down to 0.8332 (2023 low). Outlook will be turned bullish for 1.0146 resistance next. Nevertheless, rejection by 0.9223 will retain medium term bearishness for another decline through 0.8332 at a later stage.
USD/JPY Mid-Day Outlook
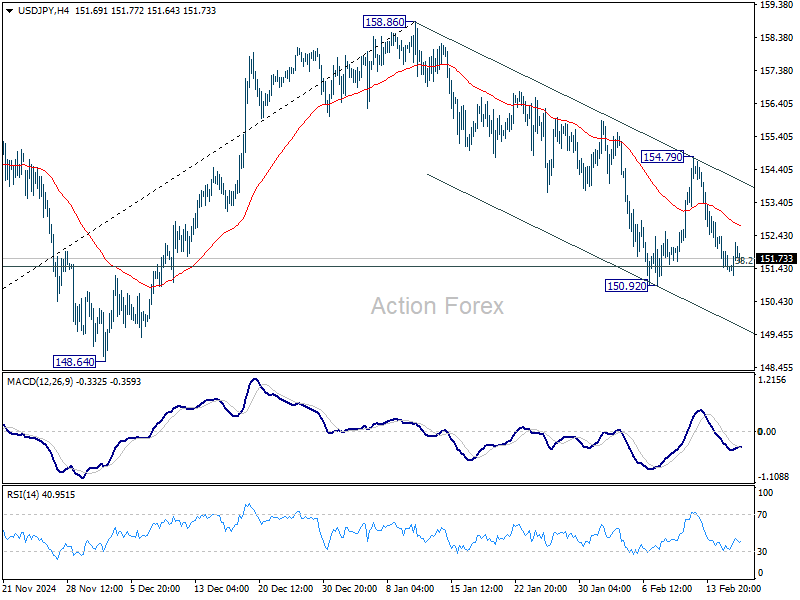
Daily Pivots: (S1) 151.05; (P) 151.75; (R1) 152.22; More...
Intraday bias in USD/JPY remains neutral for the moment. Attention is still on 38.2% retracement of 139.57 to 158.86 at 151.4. Strong rebound from there will maintain near term bullishness. On the upside, break of 154.79 will revive the case that correction from 158.86 has completed at 150.29. Further rise should be seen to retest 158.86 high. However, break of 150.92 and sustained trading below 151.49 will raise the chance of trend reversal, and target 148.64 support instead.
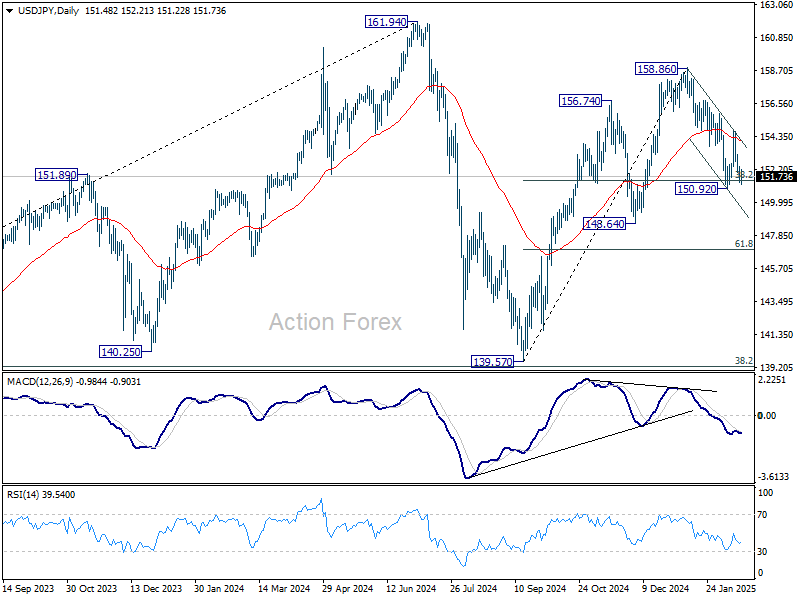
In the bigger picture, price actions from 161.94 are seen as a corrective pattern to rise from 102.58 (2021 low). In case of another fall, strong support should be seen from 38.2% retracement of 102.58 to 161.94 at 139.26 to bring rebound. However, sustained break of 139.26 would open up deeper medium term decline to 61.8% retracement at 125.25.
Canadian Inflation Moves Higher in January
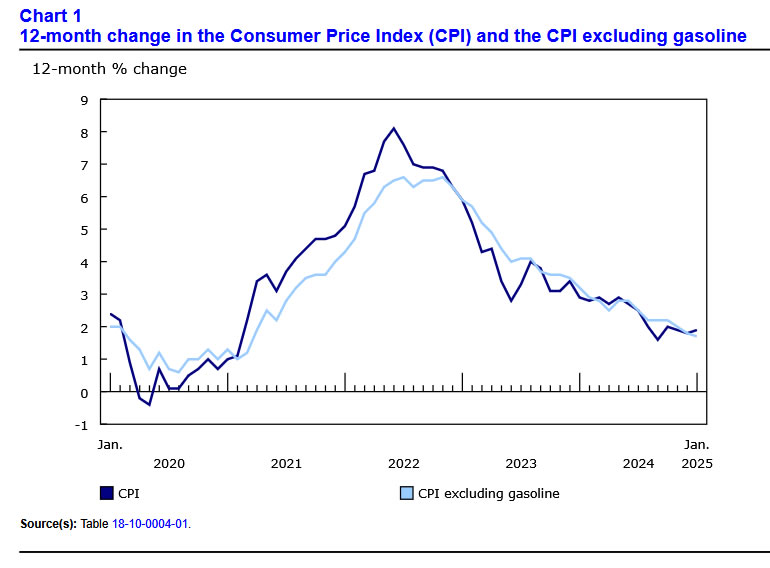
Headline CPI inflation increased in January to 1.9% year-on-year (y/y), slightly above expectations for a 1.8% y/y print and more than the 1.8% y/y reading from December.
The Bank of Canada's preferred "core" inflation measures also increased to 2.7% y/y, from 2.6% y/y in December.
Energy prices were the main driver of higher inflation, with gasoline up 8.6% y/y and natural gas up 4.8% y/y. Car prices also moved higher by 2.3% y/y, the first increase in 8 months.
The impact of the GST/HST break continues to act as a downward force on inflation. Restaurant costs dropped 5.1% y/y, while alcohol costs dropped 3.6% y/y.
Key Implications
Headline inflation remains close to the BoC's 2% target, but there are signs that price pressures could move higher in the months to come. The GST/HST holiday has officially ended and the downward pressure on overall inflation will unwind. Stripping out this impact, inflation would have been 2.5% y/y, 0.6 percentage points higher than the headline print. Additionally, the three-month annualized trend of core inflation has been tracking above 3%, signaling that core inflation should continue to grind higher.
The BoC is in a difficult place. Does it weigh the downside risks to the economy in the face of U.S. tariffs, or does it focus on recent economic strength and the impact this is having on inflation? Markets are still pricing for another 25 bp cut in March, but price action this morning is paring back some of this. There is plenty of time between now and March 12th, and if the President's first few weeks are anything to go by, a lot could change before then.
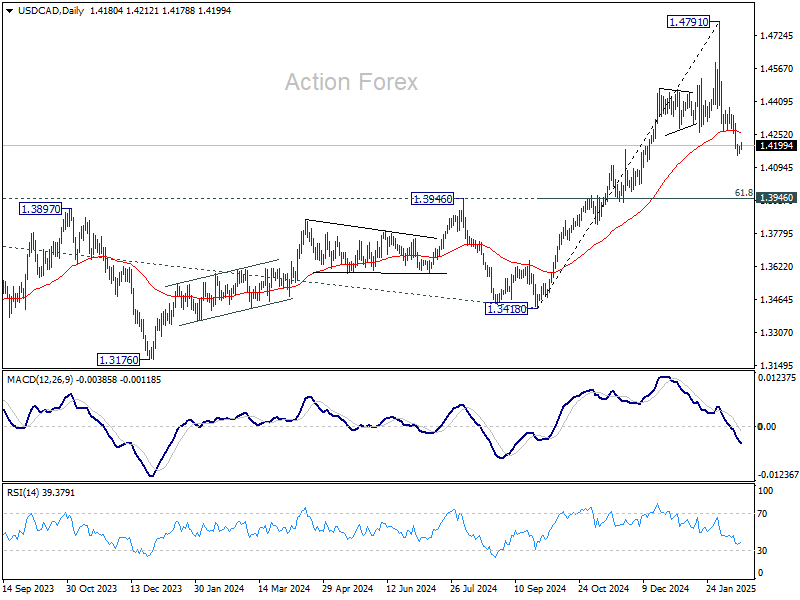
USD/CAD Mid-Day Outlook
Daily Pivots: (S1) 1.4165; (P) 1.4179; (R1) 1.4199; More...
USD/CAD is staying in tight range above 1.4150 temporary low and intraday bias remains neutral. Deeper decline will remain in favor as long as 1.4378 resistance holds. Fall from 1.4791 is correcting whole rise from 1.3418. Break of 1.4150 will target 1.3946 cluster support (61.8% retracement of 1.3418 to 1.4791 at 1.3942).
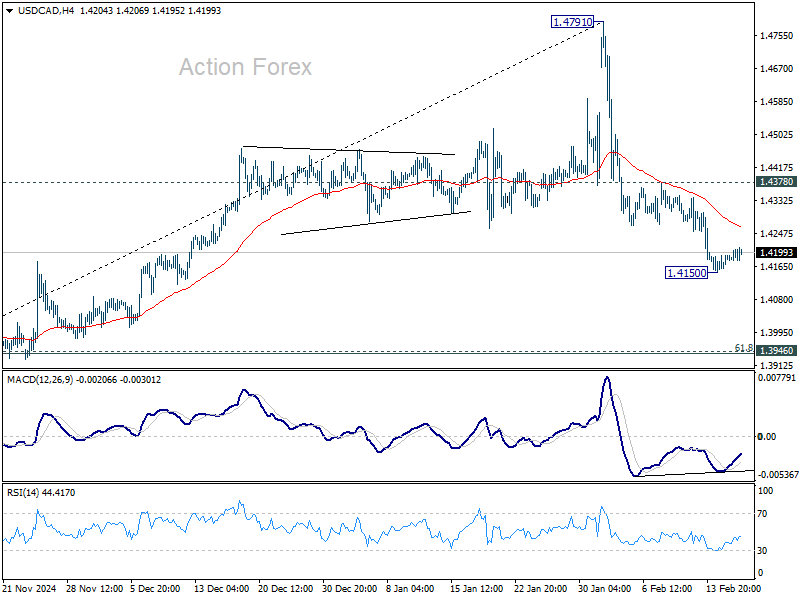
In the bigger picture, long term up trend is tentatively seen as resuming with prior breach of 1.4667/89 key resistance zone (2020/2015 highs). Next target is 100% projection of 1.2401 to 1.3976 from 1.3418 at 1.4993. This will remain the favored case as long as 1.3976 resistance turned holds (2022 high), even in case of deep pullback.
Muted Forex Action as Traders Overlook Data, Await RBNZ Cut
Forex markets remained subdued today, with muted reactions to key economic data. Dollar held broadly higher as traders focused on the US-Russia peace talks, where both sides agreed to continue discussions on ending Russia’s invasion of Ukraine. However, meaningful progress is unlikely without direct involvement from Ukraine and European nations, keeping market uncertainty elevated.
Canadian Dollar traded mixed following slightly stronger-than-expected core inflation data. Despite this, with headline CPI below 2% and CPI common just above 2%, BoC is still expected to gradually lower rates toward neutral levels.
British Pound showed little reaction to strong UK labor market data, including strong wage growth. BoE Governor Andrew Bailey commented that the figures did not alter the central bank’s outlook, keeping rate expectations steady. Similarly, Euro ignored a notable improvement in German economic sentiment, which suggests the economy may finally be stabilizing.
Australian Dollar remains supported following RBA’s cautious rate cut, with the central bank signaling that the easing cycle will proceed gradually and may not be as deep as previously expected.
Looking ahead, RBNZ rate decision is the primary focus in the upcoming Asian session, where markets anticipate a 50bps rate cut, bringing the OCR down to 3.75%, moving closer to neutral levels. A key point of interest will be whether RBNZ signals a slowdown in the pace of easing, and traders will analyze economic projections for insights into the terminal rate.
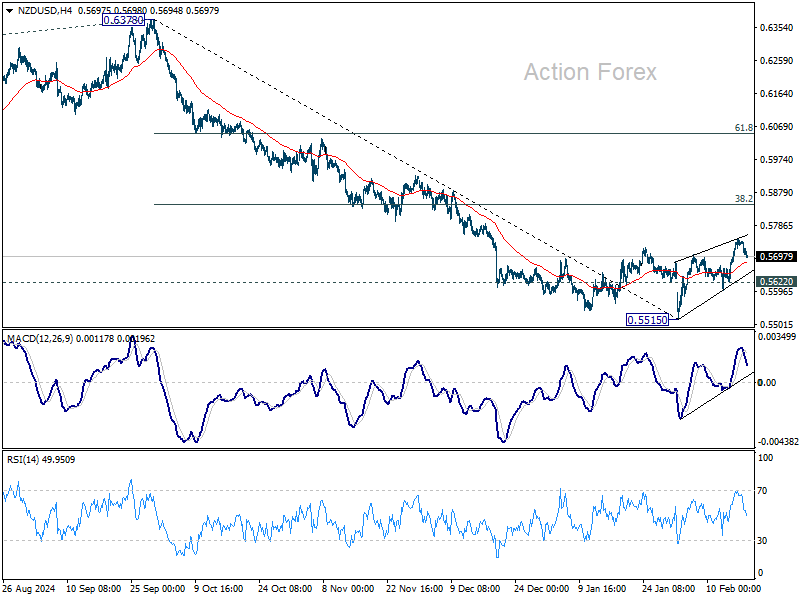
Technically, NZD/USD's rebound from 0.5515 is seen as a correction to the fall from 0.6378. While another rise cannot be ruled out, upside should be limited by 38.2% retracement of 0.6378 to 0.5515 at 0.5848. Break of 0.5622 minors support will argue that the corrective bounce has completed, and bring retest of 0.5515 low.
In Europe, at the time of writing, FTSE is up 0.16%. DAX is up 0.24%. CAC is up 0.31%. UK 10-year yield is up 0.032 at 4.570. Germany 10-year yield is up 0.012 at 2.504. Earlier in Asia, Nikkei rose 0.25%. Hong Kong HSI rose 1.59%. China Shanghai SSE fell -0.93%. Singapore Strait Times rose 0.53%. Japan 10-year JGB yield rose 0.0435 to 1.436.
Canada’s CPI rises to 1.9% in Jan, core inflation ticks up
Canada’s headline CPI increased from 1.8% yoy to 1.9% yoy in January, in line with expectations. The rise was driven by higher energy costs, particularly gasoline and natural gas, while GST/HST tax break introduced in December helped offset broader price pressures.
Food prices fell -0.6% yoy, marking the first annual decline since May 2017, led by a record -5.1% yoy drop in restaurant food prices.
On a monthly basis, CPI rose 0.1% mom, rebounding from December’s -0.4% mom decline.
Core inflation strengthened, with CPI median rising to 2.7% yoy from 2.6% yoy, CPI trimmed increasing to 2.7% yoy from 2.5% yoy, and CPI common edging up to 2.2% yoy from 2.0% yoy.
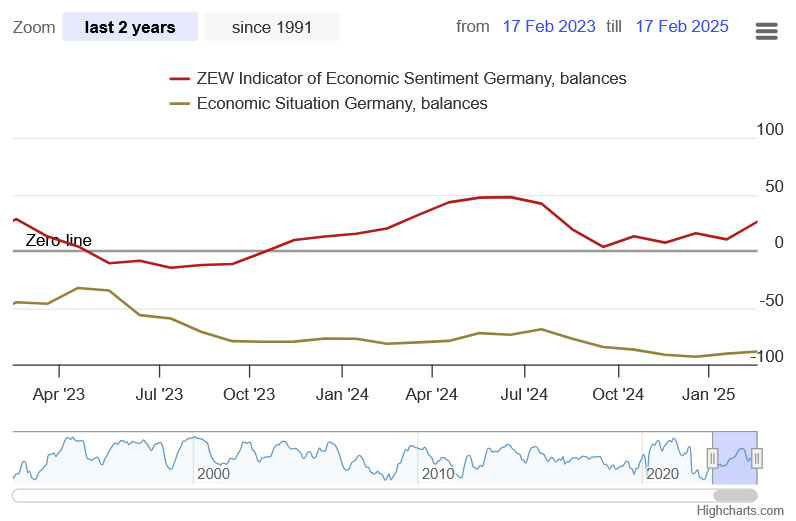
German ZEW jumps to 26 in Feb, optimism ahead of elections
German ZEW Economic Sentiment Index surged from 10.3 to 26.0 in February, surpassing expectations of 20.2 and reflecting growing optimism about Germany’s economic outlook. Current Situation Index also showed a slight improvement, rising from -90.4 to -88.5, beating forecasts of -89.0.
Eurozone ZEW Economic Sentiment rose from 18.0 to 24.2, falling short of the anticipated 25.4, while the Current Situation Index climbed by 8.5 points to -45.3.
According to ZEW President Achim Wambach, the sharp rise in expectations is likely driven by hopes for a "new German government capable of action" ahead of the federal election, alongside expectations for a rebound in private consumption over the next six months.
UK wages growth accelerates in Dec, payrolled employment rose 21k in Jan
The latest UK labor market data presents a mixed picture, with payrolled employment rising by 21k (0.1% mom) in January, but the Claimant Count increasing by 22 to 1.75 million. Meanwhile, median monthly pay reached £2,467, reflecting a 5.7% yoy increase, reinforcing concerns about wage-driven inflation pressures.
Looking at the broader employment trend, data for the three months to December showed that the employment rate edged up by 0.1 percentage point to 74.9%, while the unemployment rate also ticked higher by 0.1 percentage point to 4.4%.
Wage pressures remain elevated, with average earnings including bonuses accelerating from 5.5% yoy to 6.0% yoy, and earnings excluding bonuses rising from 5.6% yoy to 5.9% yoy.
RBA cuts rates, but warns against easing too much too soon
RBA lowered its cash rate target by 25bps to 4.10%, as widely anticipated, but signaled a cautious approach to further easing.
In its statement, the central bank emphasized that monetary policy will remain restrictive even after today’s reduction, warning that if rates are “eased too much too soon”, disinflation progress could stall and inflation could settle above the midpoint of the target range.
RBA acknowledged that some upside risks to inflation “appear to have eased”, and disinflation may be unfolding “a little more quickly than earlier expected”. However, it maintained that “risks on both sides” remain.
While today’s cut reflects the central bank’s confidence in recent progress, policymakers remain “cautious about the outlook”, reinforcing the idea that future easing will be data-dependent rather than pre-committed.
In the new economic projections:
- Headline CPI is now projected to rise to 3.7% by the end of 2025, before gradually easing to 2.8% by the end of 2026 (raised from 2.5%), and settling at 2.7% by mid-2027.
- Trimmed mean CPI is expected to remain at 2.7% throughout 2025, 2026, and mid-2027.
- Unemployment rate forecast was lowered to 4.2% across the projection horizon
- Year-average GDP growth was revised down by 0.1% to 2.1% for 2025, while 2026 remains unchanged at 2.3%, with growth expected to hold steady at 2.3% into 2026/2027.
- Cash rate assumptions suggest an average rate of 3.6% in 2025, followed by 3.5% in 2026.
USD/CAD Mid-Day Outlook
Daily Pivots: (S1) 1.4165; (P) 1.4179; (R1) 1.4199; More...
USD/CAD is staying in tight range above 1.4150 temporary low and intraday bias remains neutral. Deeper decline will remain in favor as long as 1.4378 resistance holds. Fall from 1.4791 is correcting whole rise from 1.3418. Break of 1.4150 will target 1.3946 cluster support (61.8% retracement of 1.3418 to 1.4791 at 1.3942).
In the bigger picture, long term up trend is tentatively seen as resuming with prior breach of 1.4667/89 key resistance zone (2020/2015 highs). Next target is 100% projection of 1.2401 to 1.3976 from 1.3418 at 1.4993. This will remain the favored case as long as 1.3976 resistance turned holds (2022 high), even in case of deep pullback.
Canada’s CPI rises to 1.9% in Jan, core inflation ticks up
Canada’s headline CPI increased from 1.8% yoy to 1.9% yoy in January, in line with expectations. The rise was driven by higher energy costs, particularly gasoline and natural gas, while GST/HST tax break introduced in December helped offset broader price pressures.
Food prices fell -0.6% yoy, marking the first annual decline since May 2017, led by a record -5.1% yoy drop in restaurant food prices.
On a monthly basis, CPI rose 0.1% mom, rebounding from December’s -0.4% mom decline.
Core inflation strengthened, with CPI median rising to 2.7% yoy from 2.6% yoy, CPI trimmed increasing to 2.7% yoy from 2.5% yoy, and CPI common edging up to 2.2% yoy from 2.0% yoy.
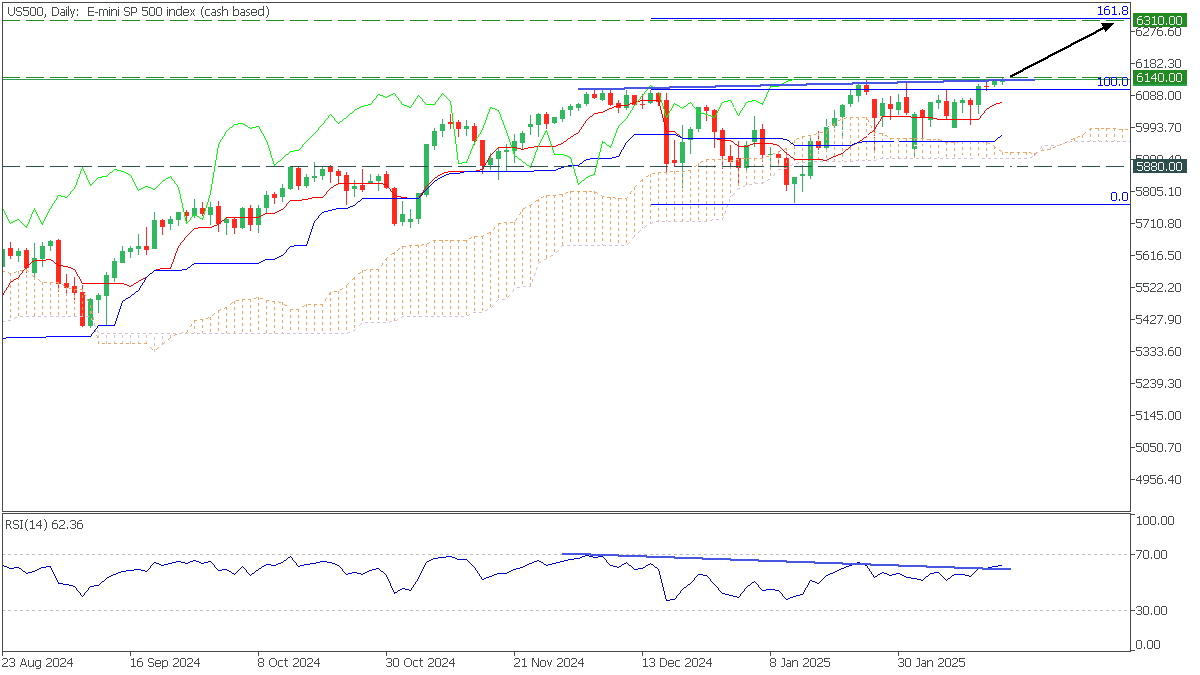
US500: Way to a New Record
US500, Daily
In the Daily timeframe, the US500 hit an all-time high, testing the trendline. Tenkan rose above Kijun on Ichimoku Kinko Hyo, and the RSI divergence broke upward, indicating bullish dominance.
- We can consider buying US500 on consolidation above the trendline and 6140 with a target of 6310;
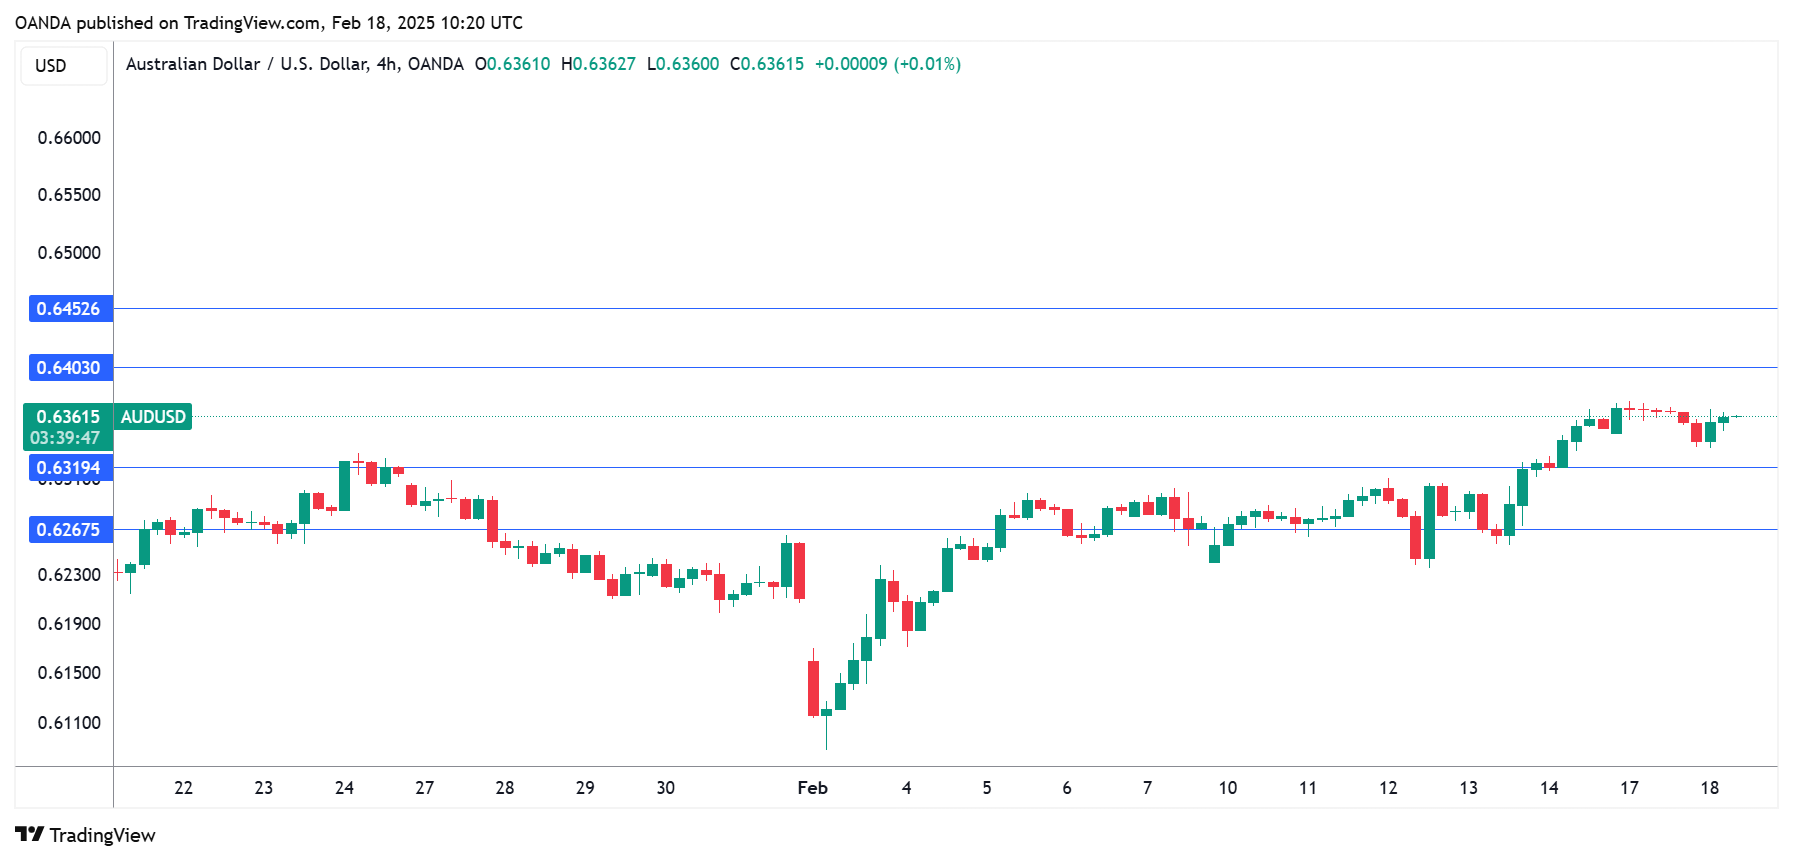
RBA Finally Lowers Rates, Aussie Shrugs
The Australian dollar is drifting on Tuesday after three straight days of gains. In the European session, AUD/USD is trading at 0.63671, up 0.09% on the day.
RBA lowers rates to 4.1%
The Reserve Bank of Australia cut the cash rate by a quarter-point on Tuesday to 4.10%. The decision was widely expected and the Australian dollar has shown little reaction. Still, the move is a milestone, as the RBA delivered its first rate cut in over four years. The central bank has maintained rates at 4.35% for over a year, as it remained concerned about the upside risk of inflation, even as headline CPI has fallen back within the 2%-3% target.
The rate statement was on the hawkish side, with RBA members stating that while the decision “recognises the welcome progress on inflation, the Board remains cautious on prospects for further policy easing”. This was a message to the market not to expect a series of rate cuts this year and to expect the easing cycle to be short-lived. The statement noted that the labor market has been “unexepectedly strong” and uncertainty remained about domestic economic activity and inflation.
The RBA rate cut also carries significant political implications. Prime Minister Anthony Albanese’s Labor government is in a tight election race and Albanese will be try to use the rate cut to his advantage and argue that the move is a result of the government’s economic policies.
Australia releases wage growth on Wednesday. The wage price index for the fourth quarter is expected to remain at 0.8% q/q and dip to 3.2% y/y from 3.2% in the third quarter.
AUD/USD Technical
- There is resistance at 0.6402 and 0.6452
- 0.6318 and 0.6268 are the next support levels
German ZEW jumps to 26 in Feb, optimism ahead of elections
German ZEW Economic Sentiment Index surged from 10.3 to 26.0 in February, surpassing expectations of 20.2 and reflecting growing optimism about Germany’s economic outlook. Current Situation Index also showed a slight improvement, rising from -90.4 to -88.5, beating forecasts of -89.0.
Eurozone ZEW Economic Sentiment rose from 18.0 to 24.2, falling short of the anticipated 25.4, while the Current Situation Index climbed by 8.5 points to -45.3.
According to ZEW President Achim Wambach, the sharp rise in expectations is likely driven by hopes for a "new German government capable of action" ahead of the federal election, alongside expectations for a rebound in private consumption over the next six months.
AUD/USD Trades Near Year’s High After RBA Decision
Today, the Reserve Bank of Australia (RBA) eased monetary policy, cutting the interest rate from 4.35% to 4.10%, according to Forex Factory.
As reported by Reuters:
→ This marks the first easing since the 2020 pandemic;
→ RBA Governor Michele Bullock stated that market expectations for two more cuts this year are “ambitious”;
→ The bank’s leadership remains cautious about further easing prospects.
While analysts had accurately predicted the February rate cut, AUD/USD saw volatility without a significant move, possibly because market participants are more focused on Trump’s tariff plans, which could impact global trade and Forex markets.
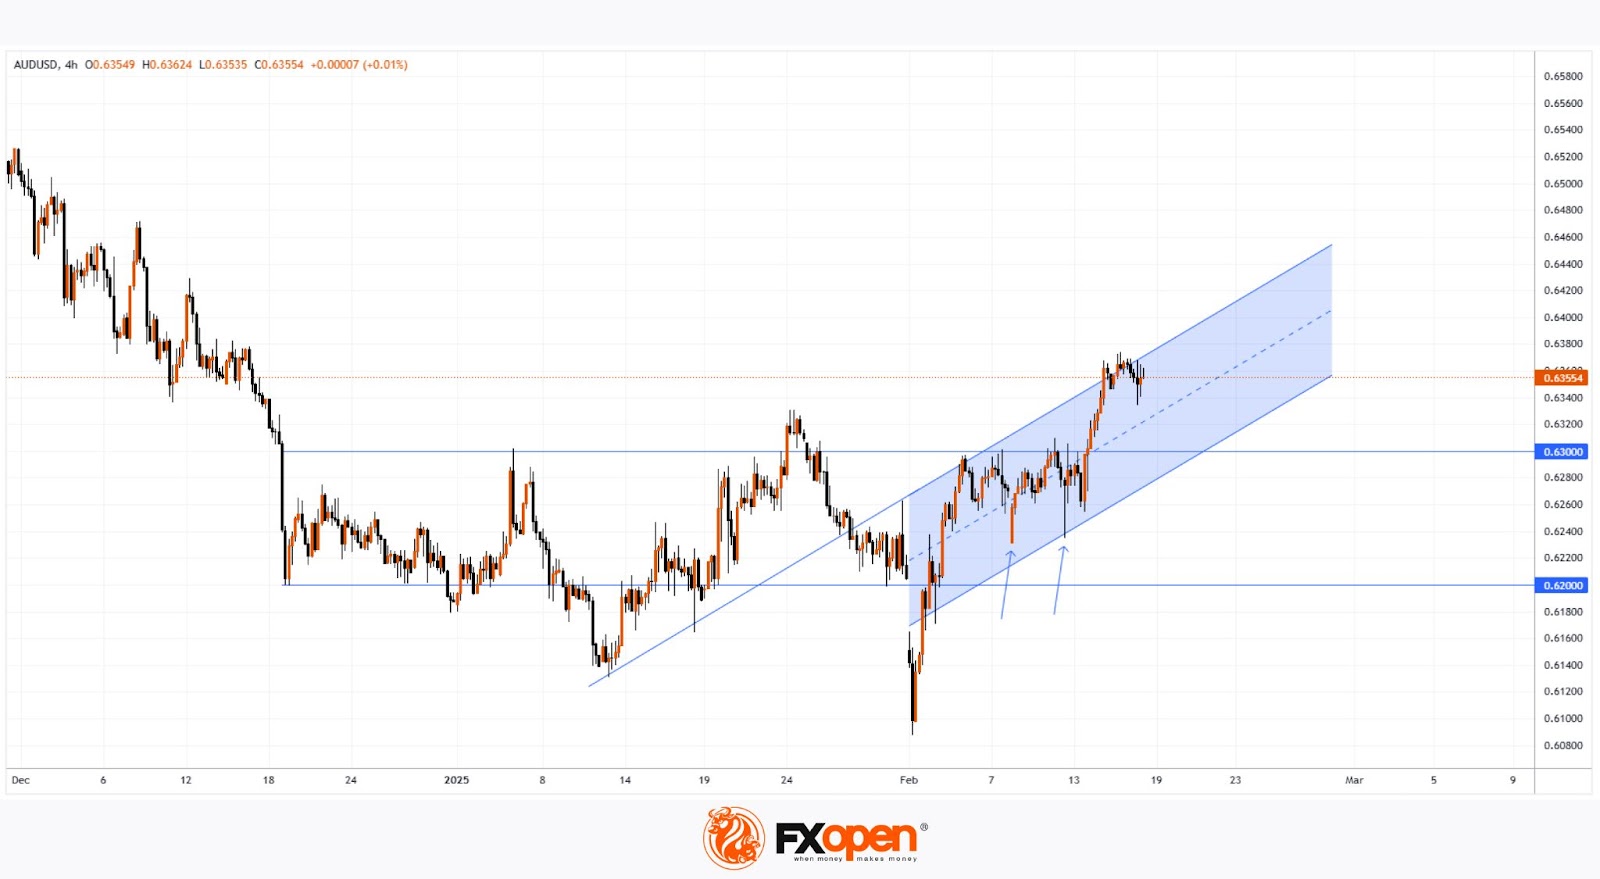
Technical Analysis of AUD/USD Today
Since mid-December, the AUD/USD pair has mostly traded within the 0.6200–0.6300 range, except for early February’s sharp drop when Trump’s tariff policies shook currency markets.
However, demand appears resilient:
→ After plunging to around 0.6100, the price quickly rebounded into the range;
→ Arrows highlight rapid recoveries after short-term dips;
→ A blue ascending trend channel is forming on the chart.
These factors suggest growing appeal for the Australian dollar, with the 0.6300 level potentially acting as support going forward.
Trade over 50 forex markets 24 hours a day with FXOpen. Take advantage of low commissions, deep liquidity, and spreads from 0.0 pips. Open your FXOpen account now or learn more about trading forex with FXOpen.
This article represents the opinion of the Companies operating under the FXOpen brand only. It is not to be construed as an offer, solicitation, or recommendation with respect to products and services provided by the Companies operating under the FXOpen brand, nor is it to be considered financial advice.