
Sample Category Title
A Slight Bearish Bias on Core Bonds and Neutral on EUR/USD
Markets
Spotlights were on Europe yesterday. US financial markets were closed for President’s Day while French president Macron summoned a handful of European leaders as well as EC president von der Leyen and Nato chief Rutte. The goal was not so much to announce big defense initiatives – Europe’s buy-in at the negotiation table with Russia – as it was to show the EU’s decisiveness and speediness when it is once again cornered. Actual decisions, however, require all 27 member states to be part of the discussions. Funding as always will be one of the key topics. Options include an escape clause that keeps defense spending out of the fiscal equation so that countries can still abide by the 3% deficit rule or re-purposing existing funds (e.g. unused resources of the pandemic recovery fund). Eventually, though, we think we will end up in a Next Generation EU-style joint borrowing on the European level. Resistance from some of the staunchest opposition indeed appears to be easing. Either way, setting up a European defense architecture is going to require massive investments with a significant part of that being recurring. German bunds underperformed vs swap with yields rising between 2.7 and 7 bps in a bear steepening move. French OATs declined as well, pushing up rates 1.7-5.2 bps. UK gilts outperformed (+0.4-3.2 bps). The country is already spending 2%+ on defense, making the additional effort relatively smaller compared to European peers. The euro closed lower, against the dollar (EUR/USD <1.05) but more so against sterling. EUR/GBP turned to the 0.83 big figure ahead of some economic data scheduled for release starting today. The labour market report was strong on all accounts – 6% wage growth, a lower-than-expected unemployment rate and consensus-topping employment gains. EUR/GBP 0.83 is cracking. The US Treasury market reopened in Asia by adding several basis points across the curve. Fed governor Waller said inflation didn’t show any real progress in recent months. A similar pattern emerged in 2024 which was then followed by easing price pressures after all that paved the way for the first rate cuts later in the year. Waller said this may be the case again in 2025 but until that’s clear, he favours to keep rates steady. Today’s eco calendar has not that much to offer but the geopolitical one does. US secretary of state Rubio, national security adviser Waltz, and Witkoff, Trump’s special envoy to the Middle East, will be meeting Russia’s foreign policy advisor Ushakov and foreign minister Lavrov in Riyadh. It’s the high-level first in-person meeting since the invasion in 2022. We keep a slight bearish bias on core bonds and are neutral on EUR/USD. While the prospect of a ceasefire and eventual end to the war is positive for the euro, there are too many uncertainties as well as other topics including tariffs that are holding the common currency back.
News & Views
After holding its policy rate at 4.35% since November 2023, the Reserve bank of Australia (RBA) today made a first step in easing policy restriction as it cut the policy rate by 25 bps to 4.10%. The RBA assesses that inflation has fallen substantially as higher interest rates have been working to bring aggregate demand and supply closer in balance. Underlying inflation reached 3.2% in the December quarter, a little faster than expected. Demand growth has been subdued and wage pressures have eased, giving the Board more confidence that inflation is moving sustainably to the 2-3% RBA target. However, the RBA still holds a cautions stance on further easing as risks to inflation are seen to the upside. In this respect, RBA refers to unexpectedly strong labour data of late. The RBA also slightly upwardly revised to path for underlying inflation over 2026 (2.7% EoY from 2.5%) and warns on a high degree of uncertainty both on growth and inflation. Policy will remain restrictive after today’s decision. At the press conference, governor Bullock explicitly said that the RBA can’t declare victory on inflation yet and that today’s decision doesn’t imply that further cuts are coming. For that more evidence on inflation is needed. The 3-y government bond yield rises about 6 bps (3.93%). AUD/USD trades unchanged at 0.636 despite overall USD strength.
According to (outgoing) member of the Hungarian central bank (MNB) Gyula Pleschinger, the MNB has no room to cut its policy rate this year. At the same time he also sees it unthinkable for the MNB to hike rates. Pleschinger indicated that the new MNB leadership under the former Finance Minister Mihaly Varga will remain focused on the bank’s price stability mandate. Pleschinger expects inflation to restart declining in February after the surprise uptick (1.5% M/M and 5.5% Y/Y) in January to return to 4.0% by the end of the year.
UK wages growth accelerates in Dec, payrolled employment rose 21k in Jan
The latest UK labor market data presents a mixed picture, with payrolled employment rising by 21k (0.1% mom) in January, but the Claimant Count increasing by 22 to 1.75 million. Meanwhile, median monthly pay reached £2,467, reflecting a 5.7% yoy increase, reinforcing concerns about wage-driven inflation pressures.
Looking at the broader employment trend, data for the three months to December showed that the employment rate edged up by 0.1 percentage point to 74.9%, while the unemployment rate also ticked higher by 0.1 percentage point to 4.4%.
Wage pressures remain elevated, with average earnings including bonuses accelerating from 5.5% yoy to 6.0% yoy, and earnings excluding bonuses rising from 5.6% yoy to 5.9% yoy.
US-Russian Peace Talks in Saudi Arabia Take Centre Stage
In focus today
Today, markets eagerly await US and Russian officials meeting in Saudi Arabia for peace talks initiated by US President Donald Trump last week. The negotiation does not include Ukraine and Ukrainian President Zelensky has stated that any negotiations about Ukraine without its participation would be invalid.
On the data front, the German ZEW index for February is released. In January, we got a positive surprise as the assessment of the current economic situation increased after six months of decline. It will be interesting to see if this rebound, which was also reflected in the PMI and Ifo, persisted into February.
This morning in the UK, we get the labour market report for December/January. Wage growth remains a key input factor for the BoE and private sector wage growth showed a pick-up last month. On the other hand, the labour market continues its gradual loosening with labour demand cooling.
Meanwhile in Sweden, today's focus is on the detailed CPI report for January (08.00 CET). The flash inflation reading turned out much higher than we, the market and the Riksbank had expected. The big surprise was on underlying inflation (CPIF ex energy), which could be a worrying sign of a broader inflation pressure. The details will bring important information on the implications for inflation throughout 2025 as well as the implications for the Riksbank.
Economic and market news
What happened overnight
In Australia, the Reserve Bank of Australia lowered the cash rate target by 25bp to 4.1% as expected. This was the first rate cut since 2020 with the Board remaining cautious on further policy easing. Inflation is moderating and outlook remains uncertain.
What happened yesterday
In Europe, crisis talks in Paris among European leaders underscored the commitment to increase security and a peace through strength approach to safeguarding Ukraine. However, cooperation with Washington remains crucial for securing peace. NATO Chief Mark Rutte expressed Europe's readiness to lead in providing security guarantees for Ukraine, while Dutch Prime Minister Dick Schoof emphasized the urgency of supporting Ukraine. Despite the U.S. decision to engage Russia in negotiation without European allies, British Prime Minister Keir Starmer indicated readiness to send peace-keeping troops, contingent on a U.S. security commitment. Meanwhile European defence shares hit new highs amid expectations of increased defence spending and Denmark is considering a DKK 50bn fund to scale up Danish defence this and next year.
In Sweden, the monthly labour force survey is due at 08.00 CET. We expect to see a stabilization of the current weak labour market, but without any marked improvement in the unemployment figure. Such an outcome would be in line with last week's PES report that showed an unchanged unemployment rate and a return of layoffs to their historical average after being at elevated levels in early autumn.
Equities: Equities inched higher yesterday, but in thin volumes as US was closed for holiday. European markets added another 0.5%, thereby reaching the eighth all-time high this year. Defence stocks surged for a second day with Swedish SAAB jumping a full 16% (30% in a week!). A defence rally but not a defensive one, as cyclicals generally beat defensives, growth/quality beating value but small caps lagging. VIX however worth noting, snapping the improvement from last week by rising this morning. Nonetheless, US futures are slightly higher this morning.
FI: The main story in the European fixed income market is the increase public spending on defence and aid to Ukraine. EU is looking into various options to fund the increased spending through either joint financing or suspending the EU fiscal rules like we saw during the Covid-19 crisis. The response in the bond market was higher yields across the EGBs, but with tighter spreads between periphery and semi-core EGBs relative to core EGBs. Hence, we are not seeing much flight-to-quality despite the higher rates and the pressure on fiscal policy, which would normally result in a wider BTPS-Bund spread and OAT-Bund spread.
FX: The JPY was the clear outperformer in the G10 space in a relatively quiet start to the week, as Japan's economy grew much stronger than expected in Q4 2024. With US markets closed for Presidents Day, EUR/USD remained steady just below 1.05. USD/CAD has stabilized just below 1.42 over the past couple of sessions - today, the focus in CAD FX turns to the January inflation figures at 14:30 CET. EUR/GBP declined toward the 0.8300 mark during yesterday's session. The Riksbank's announcement that it will smooth an EU payment of SEK 7.9bn over two months should have a negligible market impact. EUR/SEK dropped below 11.22, while EUR/NOK fell below 11.64.
GBP/JPY Daily Outlook
Daily Pivots: (S1) 190.69; (P) 191.23; (R1) 191.83; More...
Intraday bias in GBP/JPY remains neutral at this point. Outlook is unchanged that corrective pattern from 180.00 is extending, possibly with rebound from 187.04 as another upleg. Above 193.04 will target 194.73 resistance first. Firm break there will solidify this case and target 198.94 next.
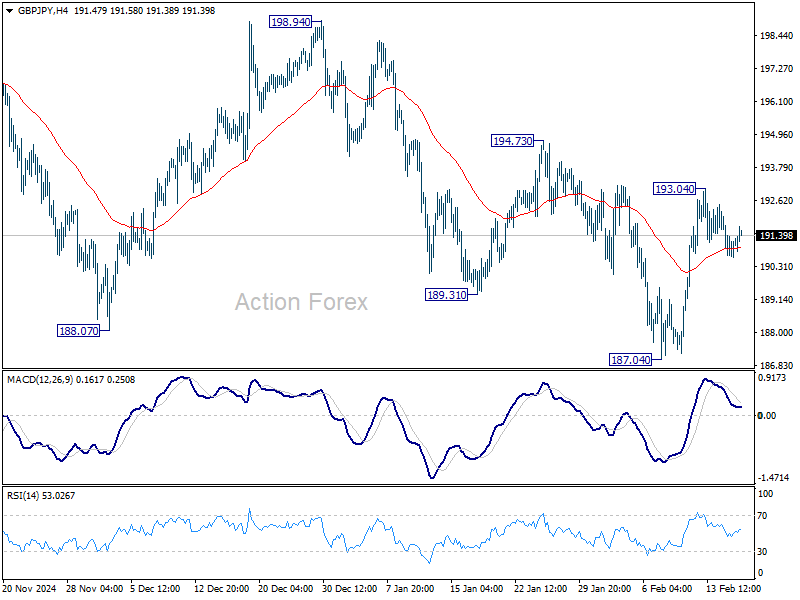
In the bigger picture, price actions from 208.09 are seen as a correction to rally from 123.94 (2020 low). Strong support should be seen from 38.2% retracement of 123.94 to 208.09 at 175.94 to contain downside. However, sustained break of 152.11 will bring deeper fall to 100% projection of 208.09 to 180.00 from 199.79 at 171.70, even still as a correction.
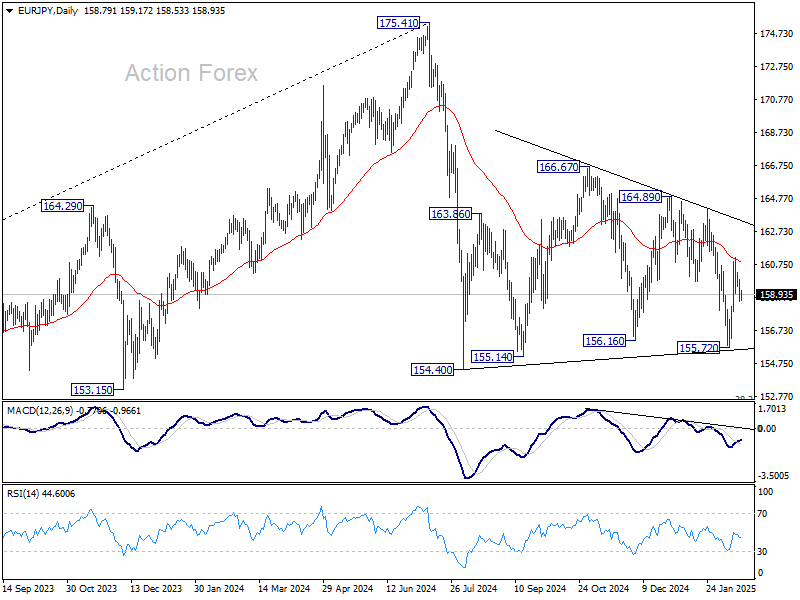
EUR/JPY Daily Outlook
Daily Pivots: (S1) 158.31; (P) 159.07; (R1) 159.61; More...
Intraday bias in EUR/JPY stays neutral at this point. Outlook is unchanged that sideway pattern from 154.40 is still extending with another upleg. On the upside, above 161.17 will target 164.07 resistance and then 164.89.
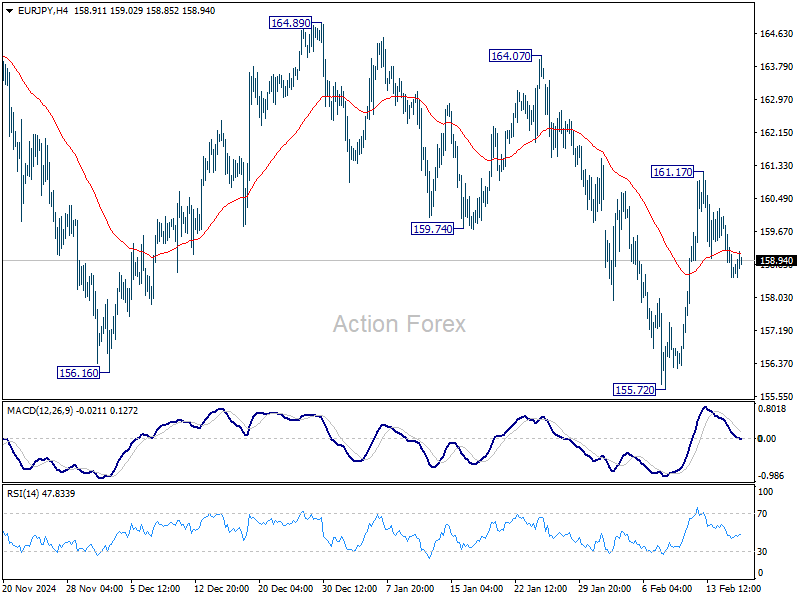
In the bigger picture, price actions from 175.41 are seen as correction to rally from 114.42 (2020 low). Strong support should be seen from 38.2% retracement of 114.42 to 175.41 at 152.11 to contain downside. However, sustained break of 152.11 will bring deeper fall even still as a correction.
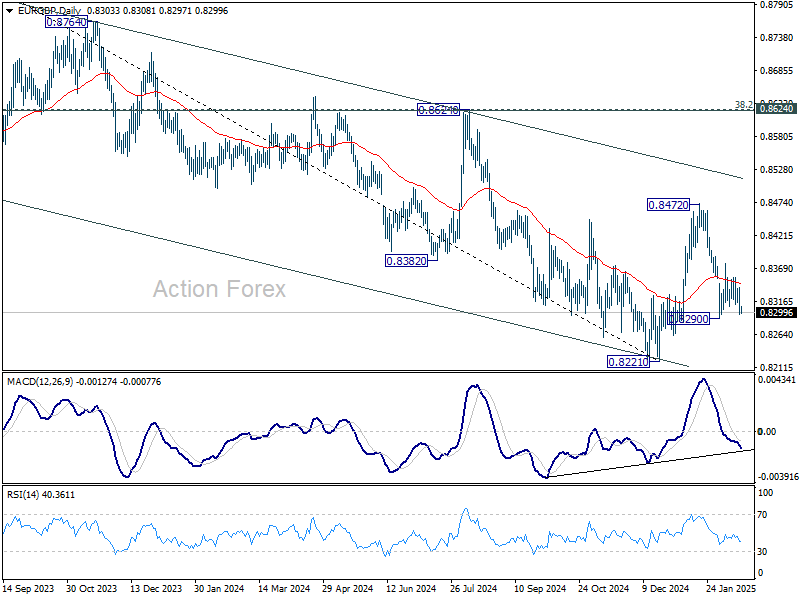
EUR/GBP Daily Outlook
Daily Pivots: (S1) 0.8288; (P) 0.8313; (R1) 0.8330; More...
Intraday bias in EUR/GBP stays neutral for the moment. Near term outlook is mixed. On the downside, break of 0.8290 will resume the fall from 08472 to retest 0.8221 low. On the upside, above 0.8376 minor resistance will bring stronger rally towards 0.8472.
In the bigger picture, rebound from 0.8221 medium term bottom could extend higher through 55 W EMA (now at 0.8435). However, medium term outlook will be neutral at best as long as 0.8624 cluster resistance zone (38.2% retracement of 0.9267 to 0.8221 at 0.8621) holds. Another decline through 0.8221 would remain mildly in favor.
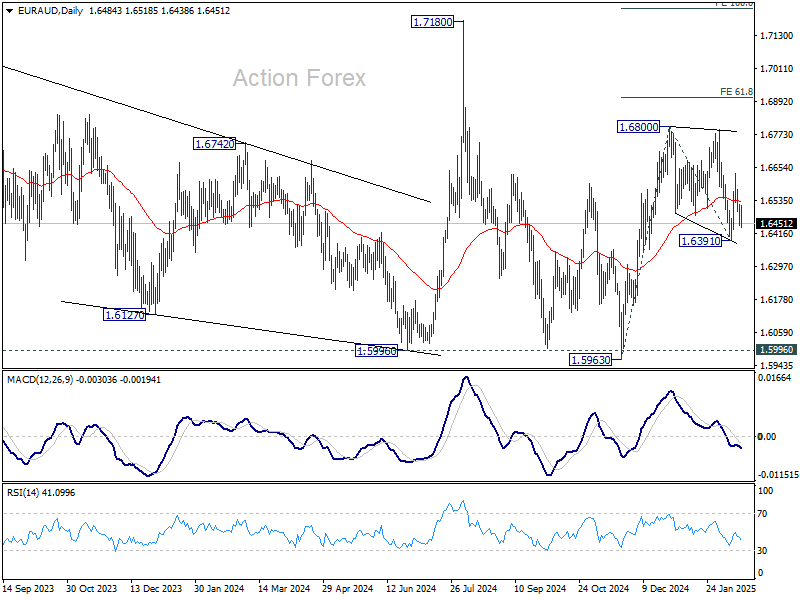
EUR/AUD Daily Outlook
Daily Pivots: (S1) 1.6445; (P) 1.6493; (R1) 1.6538; More...
Intraday bias in EUR/AUD stays neutral at this point. The favored case remains that consolidation pattern from 1.6800 has completed at 1.6391 already. On the upside above 1.6631 will bring retest of 1.6800 first. Firm break there will resume the rally from 1.5963 to 61.8% projection of 1.5693 to 1.6800 from 1.6391 at 1.6908. However, firm break of 1.6391 will invalidate this view and bring deeper fall.
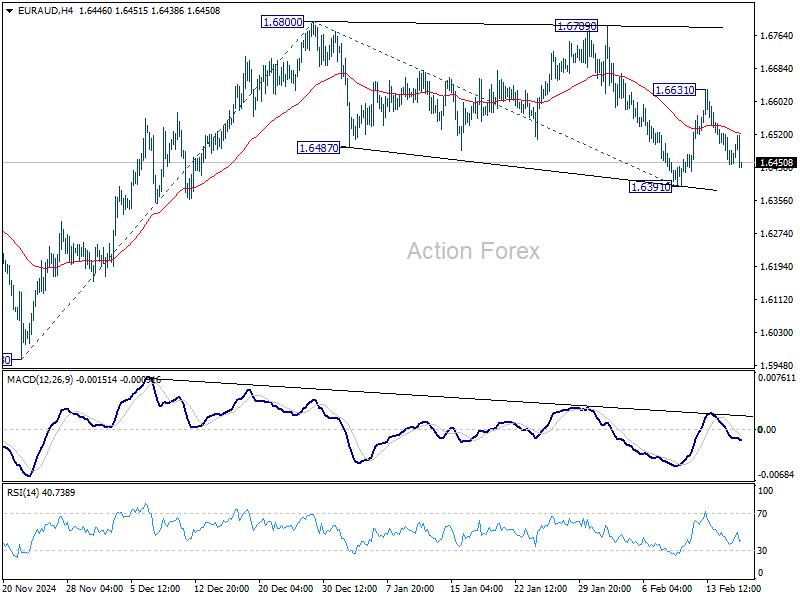
In the bigger picture, with 1.5996 key support (2024 low) intact, larger up trend from 1.4281 (2022 low) is still in favor to resume through 1.7180 at a later stage. Nevertheless, sustained break of 1.5996 will indicate that such up trend has completed and deeper decline would be seen.
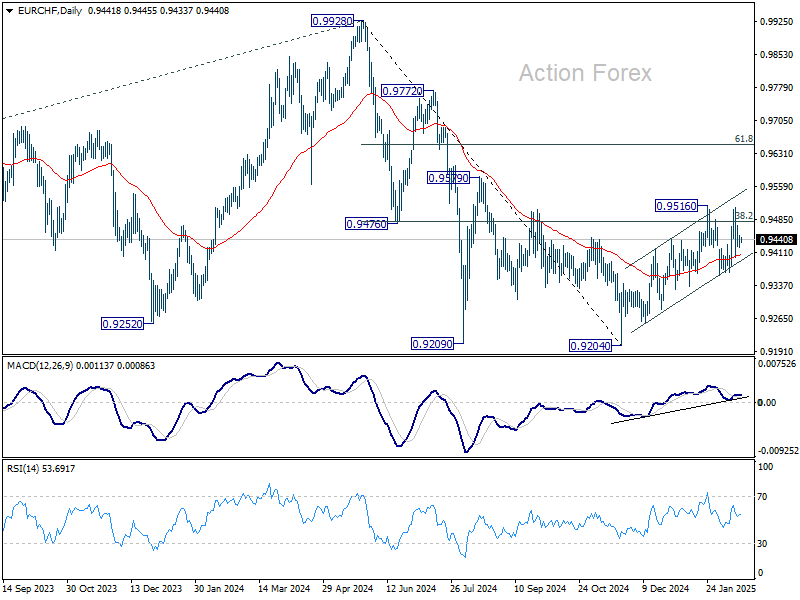
EUR/CHF Daily Outlook
Daily Pivots: (S1) 0.9421; (P) 0.9436; (R1) 0.9458; More....
Range trading continues in EUR/CHF and intraday bias remains neutral. On the downside, break of 0.9359 support will revive the case that choppy rise from 0.9204 is merely a correction and has completed. Deeper fall should then be seen back to retest 0.9204 low. However, firm break of 0.9516 and sustained trading above 0.9481 fibonacci level will carry larger bullish implication and extend the rise from 0.9204.
In the bigger picture, sustained trading above 38.2% retracement of 0.9928 to 0.9204 at 0.9481 should confirm that whole fall from 0.9928 has completed at 0.9204. Further rally should then be seen back to 61.8% retracement at 0.9651 and above. However, another rejection by 0.9481 will keep outlook bearish for extending larger down trend through 0.9204.
And So It Begins… RBA Cuts Cash Rate 25bp to 4.1%
As expected, RBA cuts cash rate 25bp to 4.1%. But a hawkish tone in the forecasts and rhetoric cements our view that RBA will move slowly from here.
As was widely expected, the RBA cut the cash rate today, by 25bp, to 4.1%. Inflation has declined faster than the RBA’s previous forecasts implied, with underlying inflation running at an annual rate consistent with the 2–3% target over the second half of 2024. Getting inflation sustainably back down to target was the Board’s highest priority. Given these data and the likely near-term outcomes they imply, it would be difficult to say that the goal is off-track. In fact, the RBA’s revised forecasts now have trimmed mean inflation constant (dare we say ‘sustained’) at 2.7% out to mid 2027. The post-meeting statement also acknowledges that inflation could be declining a bit faster than earlier expected.
Following today’s cut, the RBA assesses policy to still be restrictive. It recognised the progress made on getting inflation to target. It also acknowledged that upside risks to inflation had eased and that ‘there are signs that disinflation might be occurring a little more quickly than earlier expected.’
In a hawkish move, though, the press statement highlighted that there was a risk of easing ‘too much too soon’, in which case disinflation would ‘stall’ and inflation would ‘settle above the midpoint of the target range’ – exactly what their forecasts show trimmed mean inflation doing. The Board attributed this to ‘lingering tightness’ in the labour market. The prior easing in the labour market had ‘stalled’ over the second half of last year.
The hawkish tone is also an outworking of the 2023 RBA Review. Recall that the RBA Review recommended, and the latest Statement on the Conduct of Monetary Policy adopted – a framing of the inflation target that requires the RBA to set policy ‘such that inflation is expected to return to the midpoint of the target’, even though ‘all outcomes within the target range are consistent with the Reserve Bank Board’s price stability target’. The Board will therefore be more discomfited by the revised forecasts for trimmed mean inflation than they would have been prior to the Review. It also explains why in the post-meeting press conference, the Governor emphasised that people still needed to be patient to get inflation down – down by a whole 0.2ppts.
These forecasts are predicated on the cash rate following a path traced out by market expectations at the time of the forecast review for three rate cuts by year-end. In the post-meeting press conference, the Governor made it quite clear that the Board thinks that this is ‘far too confident’. We can therefore rule out back-to-back cuts and continue with our existing view that they will hold rates steady at the next meeting in April. But, just as inflation surprised the RBA on the downside recently, it could do so again.
A key driver of the hawkish tone is the RBA’s view of the labour market. The unemployment forecasts were revised down to level out at 4.2%. While the Governor declined to provide an estimate of the unemployment rate that is consistent with full employment, the structure in the forecasts suggests that the staff are still working on the assumption of a NAIRU around 4½%. The RBA’s framework (appropriately) goes beyond this single number and considers other variables such as underemployment and vacancies. The labour market has been tighter than expected, and yet inflation has fallen faster than the RBA expected. In the media conference, the Governor expressed hope that maybe Australia could sustain a lower unemployment rate with inflation at target. But the RBA is not willing to bet on such an outcome, even though a number of peer economies had a similar experience in the years leading up to the pandemic, with NAIRU estimates being revised down repeatedly.
Some other elements of the forecasts also appear quite hawkish. Forecasts for public demand growth were revised up, driven by recent state and federal budget updates. Consumption growth was revised down, but only a little and to a profile that looks to be still well above consensus. Overall growth was characterised as ‘returning to its trend rate’. But even allowing for the slower expected population growth, actual GDP forecasts look a little softer than past assumptions of potential output. The fragility of the labour market outlook to an early turn down in the current strong growth in employment in the healthcare and social assistance industry – the subject of an SMP Box – was barely acknowledged.
By explicitly characterising the stance of policy following the cut as restrictive, the Board is implicitly suggesting that, as long as inflation keeps declining, further rate cuts are on the cards. But they are not promising anything and expect it will be a long road still before they can declare victory on that last few tenths of a percentage point of inflation. The final paragraph of the post-meeting statement was unchanged.
Overall, this was a hawkish set of communications. While the inflation and labour cost data have turned out a bit better lately (and we will know more about the latter tomorrow), there was not a further evolution in the RBA’s thinking around the supply side. A moderate, almost grudging, path of easing is likely from here.
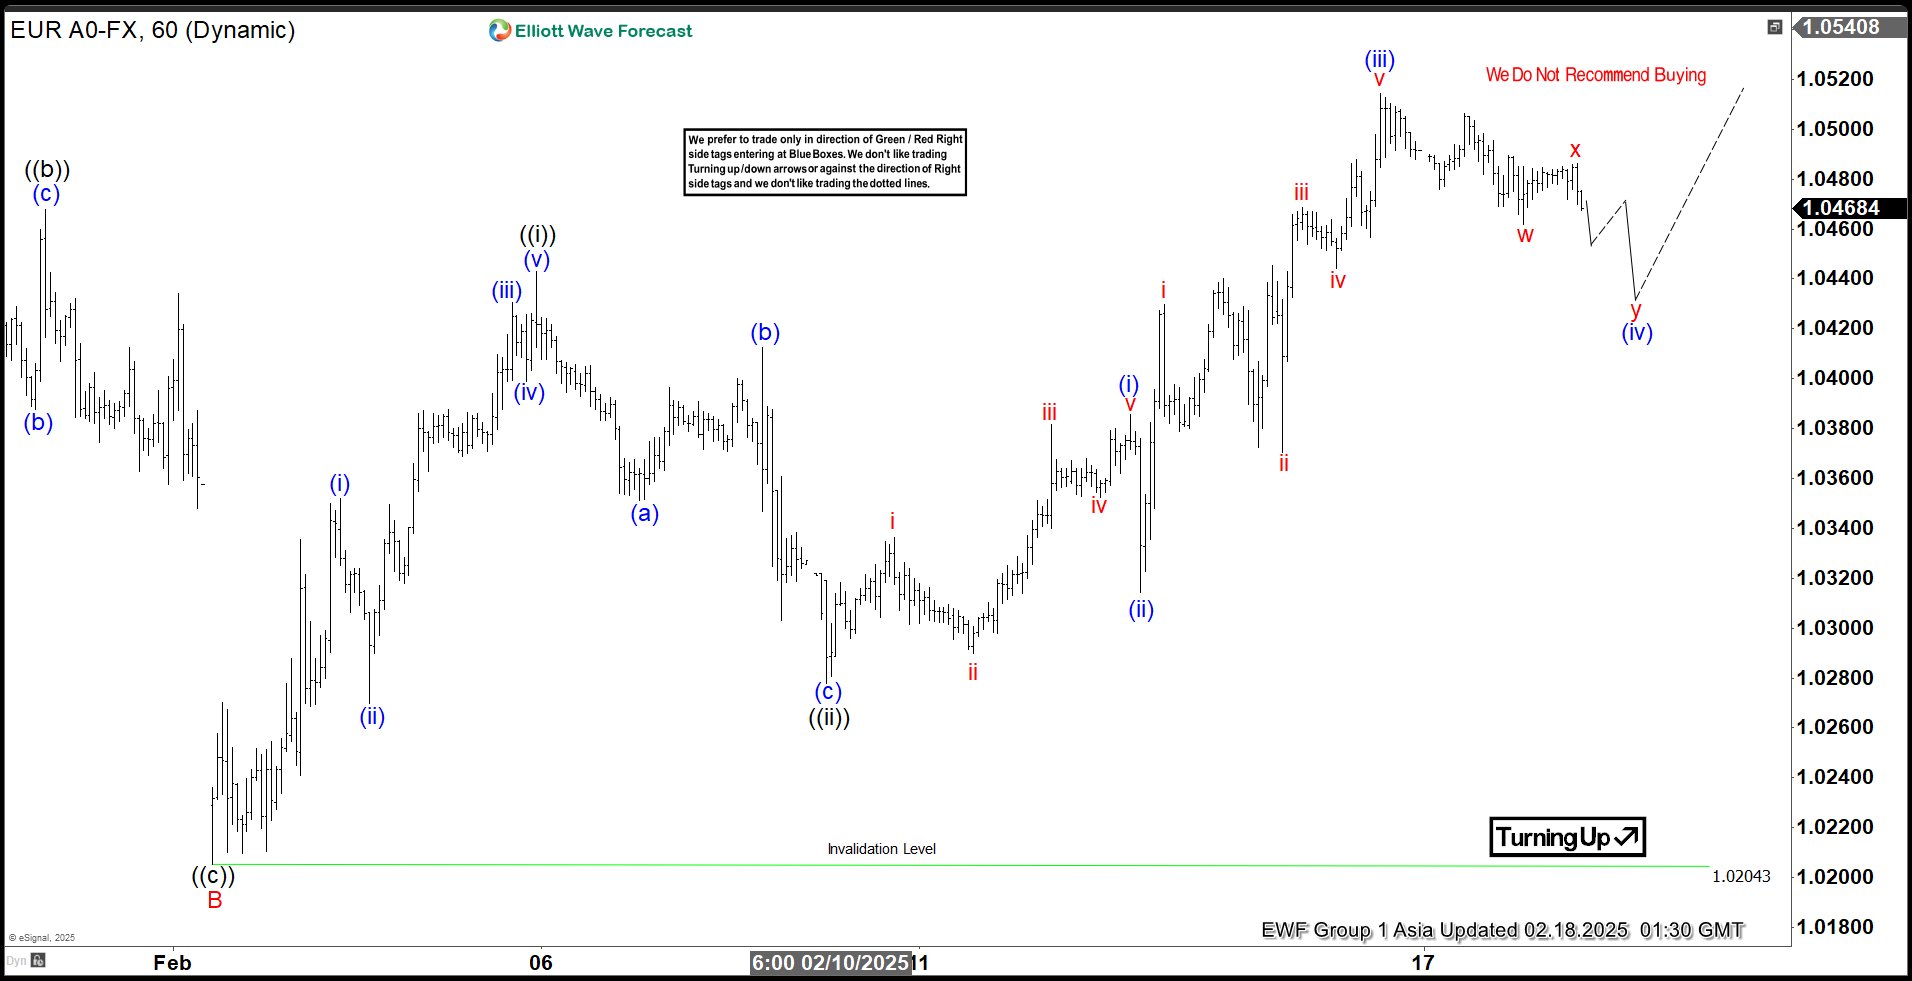
Elliott Wave View: EURUSD Looking to Extend Higher in 5 Waves
Short term Elliott Wave in EURUSD suggests rally from 1.13.2025 low is unfolding as a zigzag structure. Up from 1.13.2025 low, wave A ended at 1.0533 and pullback in wave B ended at 1.021. Wave C higher is in progress with internal subdivision as a 5 waves. Up from wave B, wave (i) ended at 1.035 and pullback in wave (ii) ended at 1.0269. Wave (iii) higher ended at 1.043 and pullback in wave (iv) ended at 1.0399. Wave (v) higher ended at 1.0442 which completed wave ((i)) in higher degree.
Pullback in wave ((ii)) unfolded as a zigzag structure. Down from wave ((i)), wave (a) ended at 1.035 and wave (b) rally ended at 1.041. Wave (c) lower ended at 1.0278 which completed wave ((ii)) in higher degree. Pair has resumed higher in wave ((iii)). Up from wave ((ii)), wave (i) ended at 1.0385 and pullback in wave (ii) ended at 1.031. Wave (iii) higher ended at 1.0514. Expect dips in wave (iv) to correct cycle from 2.12.2025 low before it resumes higher. Near term, as far as pivot at 1.0204 low stays intact, expect dips to find support in 3, 7, 11 swing for further upside.
EURUSD 60 Minutes Elliott Wave Chart
EURUSD Video
https://www.youtube.com/watch?v=5TPvTnPRF-4