
Sample Category Title
Analysis of XAU/USD Chart Reveals Bearish Signals
Today’s XAU/USD chart suggests that gold may be losing its appeal as a safe-haven asset, as increasing media reports of a potential meeting between US and Russian leaders could ease geopolitical tensions.
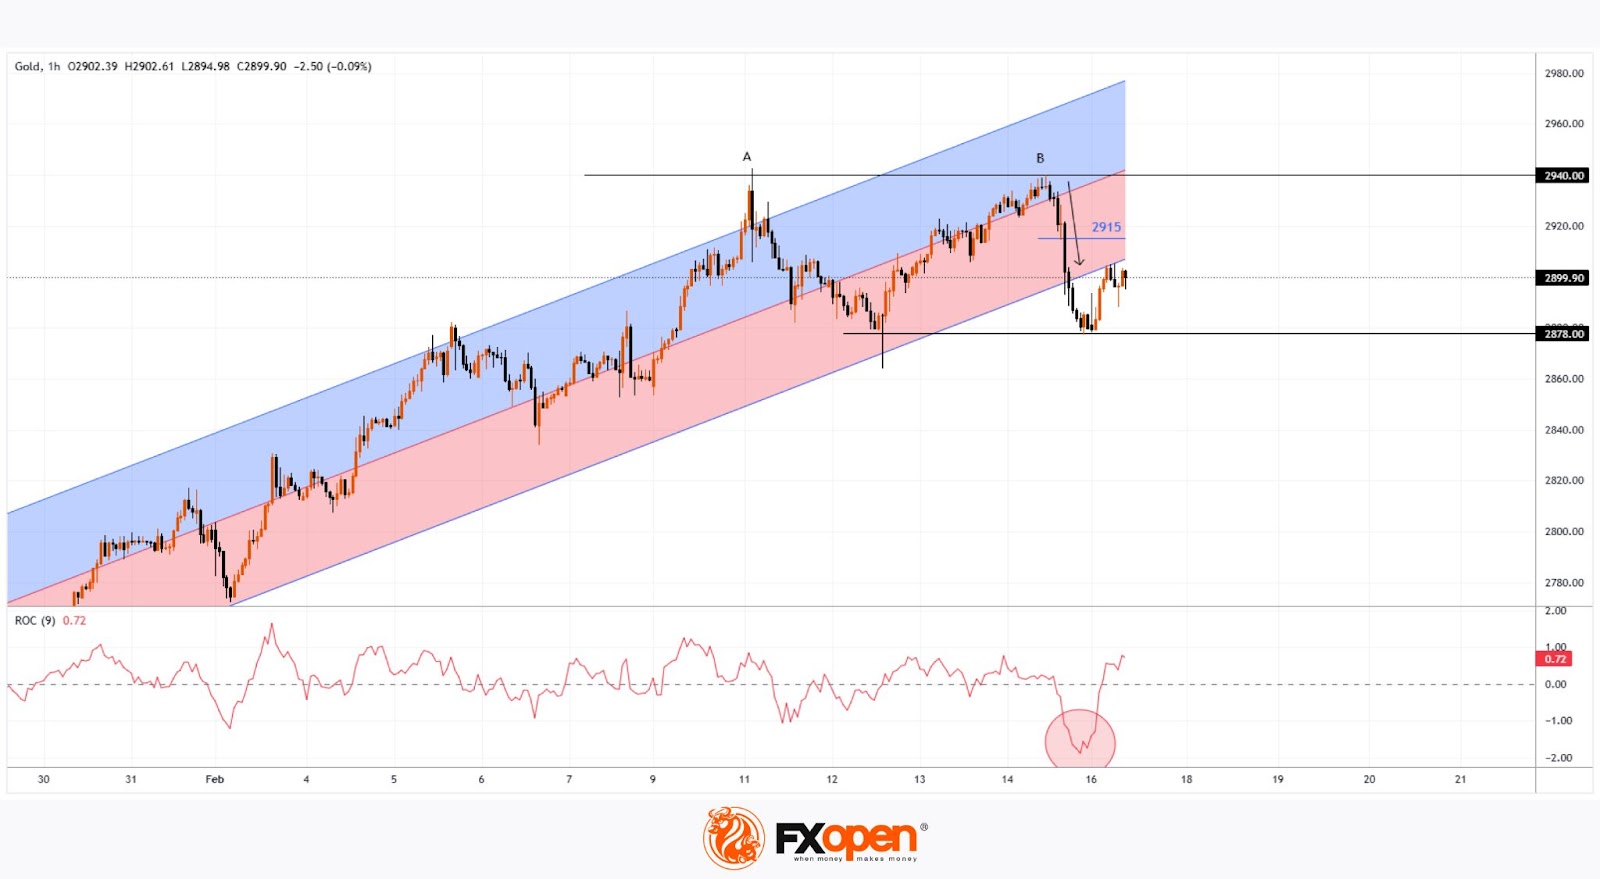
A sharp decline, indicated by the arrow, highlights the dominance of supply forces, resulting in several bearish signals on the XAU/USD price chart from a technical analysis perspective:
→ Firstly, this drop formed a bearish candlestick on the 4-hour chart with the highest trading volume on the COMEX exchange (part of the CME Group) – a key global centre for gold futures trading.
→ Secondly, a bearish double top pattern (A-B) is evident, with support at $2878 and resistance at $2940. A break below this support could see prices targeting $2816, in line with the pattern’s trading rules.
→ Thirdly, the local support observed on Friday at $2915 quickly gave way to selling pressure and may now act as resistance.
As a result, gold prices have fallen below the lower boundary of the regression channel that started in late January, while the Rate of Change indicator has dropped to its lowest point in 2025.
This could signal a significant shift in market sentiment towards gold in the medium term, potentially influenced by the Trump administration’s intentions to end the war in Ukraine.
For a long-term outlook on gold prices, we recommend reviewing gold price forecasts for 2025 and beyond.
Start trading commodity CFDs with tight spreads. Open your trading account now or learn more about trading commodity CFDs with FXOpen.
This article represents the opinion of the Companies operating under the FXOpen brand only. It is not to be construed as an offer, solicitation, or recommendation with respect to products and services provided by the Companies operating under the FXOpen brand, nor is it to be considered financial advice.
BoE’s Bailey sees ongoing gradual disinflation, warns of two-sided risks
BoE Governor Andrew Bailey reaffirmed today that the UK remains on "gradual disinflation" path, noting that the lingering effects of past economic shocks are slowly fading.
However, he emphasized that risks are “two-sided,” as highlighted in the BoE’s latest minutes, where differences within the committee surfaced.
On Q4 GDP data, which came in stronger than expected, Bailey downplayed its impact, stating that the economy has been “quite static” since late spring 2024.
Regarding the US government’s evolving stance on tariffs, Bailey expressed concerns about economic fragmentation, warning that such shifts could harm global growth.
However, he acknowledged that the inflationary impact from tariffs remains “ambiguous,” as it depends on factors such as “redirection of trade” and retaliatory measures.
He reiterated that risks exist on both sides, justifying the BoE’s use of “careful” alongside “gradual” in its policy guidance.
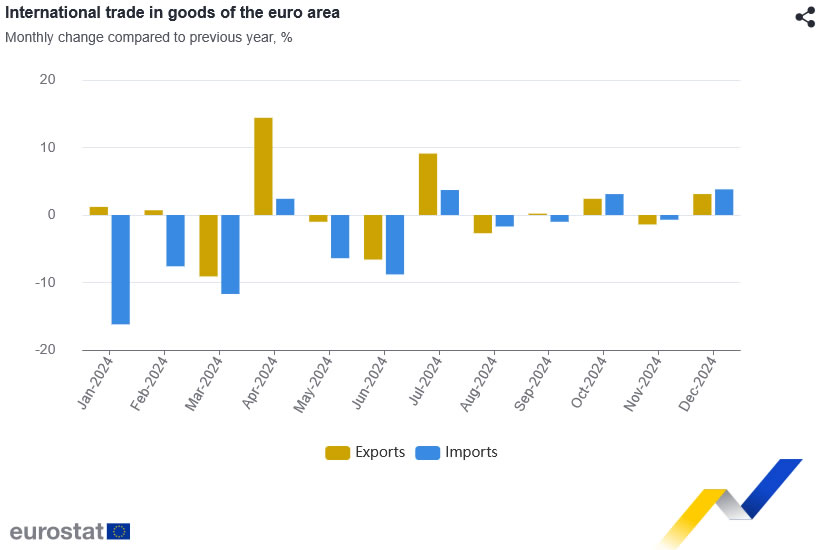
Eurozone goods exports rises 3.1% yoy in Dec, imports rises 3.8% yoy
Eurozone goods exports rose 3.1% yoy to EUR 226.5B in December. Goods imports rose 3.8% yoy to EUR 211.0B. Trade balance recorded EUR 15.5B surplus. Intra-Eurozone trade rose 1.7% yoy to EUR 191.5B.
In seasonally adjusted term, goods exports fell -0.2% mom to EUR 240.8B. Goods imports fell -0.8% mom to EUR 226.2B. Trade balance reported EUR 14.6B surplus, smaller than expectation of EUR 15.0B. Intra-Eurozone trade rose 0.6% mom to EUR 213.1B.
Euro Isn’t Sure Which Side to Pick Just Yet
Markets
Weaker-than-expected US retail sales triggered a rally in Treasuries. Yields declined between 4.1 and 6.2 bps in what was otherwise a dull trading session. German rates still finished marginally in the green, adding up to 2.5 bps at the front. UST outperformance dragged the dollar lower against all major peers. The trade-weighted USD index tumbled to the lowest level since mid-December (106.71). EUR/USD’s winning streak entered its fourth day with the pair closing just south of 1.05. Stock markets struggled for direction ahead of what is a long weekend for the US. Financial markets over there are closed for President’s Day. Lack of US investors usually means uninspired, muted trading but things could turn out different this time. The European session may be a very interesting one. Last week’s phone call between US president Trump and Russian counterpart Putin has served as a wake-up call. Both agreed to kickstart the peace talks with Trump aiming a ceasefire by Easter. Being left out of the negotiations and the US already having met Putin halfway before they even started – US Defense Secretary Hegseth suggested Ukraine should not join NATO and forfeit the areas currently under Russian control - European and Ukrainian officials fear for any future US-made deal. US VP Vance’s speech at the Munich Conference which according to watchers was an implicit tear-up of the transatlantic (military) alliance last Friday added to the sense of urgency. French president Macron summoned a handful of European leaders including from Germany and Italy but also the UK for a summit in Paris. The talks will be focused on what kind of security guarantees the EU can give to Ukraine now that US appetite for continued backing is sharply decreasing. For the outgoing German minister of Foreign Affairs Baerbock it means “We will launch a large package that has never been seen in this dimension before. Similar to the euro or the corona crisis, there is now a financial package for security in Europe. That will come in the near future.” A significant uptick in defense spending is underway, so much is clear. Bund futures point to higher yields at the open later today. The euro isn’t sure which side to pick just yet. EUR/USD is hovering near Friday’s closing levels. The geopolitical narrative alternates with the tariff one, illustrated by Trump considering reciprocal tariffs end last week, making direction FX trading tricky. For Europe, though, the conclusion of the new US administration’s military and economic view is clear (cf. infra). This week’s eco calendar features the February PMIs (Friday) and the UK labour market report (tomorrow) and CPI figures (Wednesday). German elections take place on Sunday.
News & Views
Economic activity in Japan in Q4 of 2024 grew 0.7% Q/Q (2.8% annualized), materially faster than expected (about 1.0%). The details of the report were a bit mixed. Consumption grew a modest 0.1% Q/Q, but still this was higher than expectations for a decline of 0.3% (after a strong 0.7% in Q3). Business investment grew 0.5% Q/Q, slightly less than expected. Inventories made a negative contribution to growth of -0.2%. At the same time, there was a strong positive contribution of net exports (0.7%). Admittedly, this was due to a substantial decline in imports (-2.1% Q/Q). Even as the domestic part of the Q4 growth story was a bit mixed, the data support the case for gradual further policy BoJ policy normalization after the bank raised its policy rate from 0.25% to 0.50% at the January meeting. The Japanese 10-y government bond yield this morning extends the established uptrend, touching 1.38%, the highest level since 2010. The yen also (slightly) outperforms this morning with USD/JPY easing to 151.55.
In an interview with the Financial Times on Friday, former ECB governor and Italian Prime Minister, Mario Draghi, gave a harsh analysis the vulnerabilities of EU economic growth. In particular, he sees two factors that need to be changed profoundly to raise the prospect of European growth going forward. Firstly, Draghi analyses that the EU faces a long-standing inability to tackle its supply constraints which he mainly sees from high internal barriers and regulatory hurdles. He considers them as far more damaging for growth than any tariffs that the US might impose. According to Draghi, the failure to lower internal barriers also contributed to Europe’s unusually high trade openness, that currently proves to be a vulnerability. As a second factor holding back EU growth, he mentions the region’s persistently weak demand, resulting in a recurring EU current account surplus. According to Draghi, weak demand has fed back into exceptionally weak total factor productivity. He also sees a significant deviation in the fiscal policy stance between the US and Europe as an important factor behind the relative weak EU/stronger US demand.
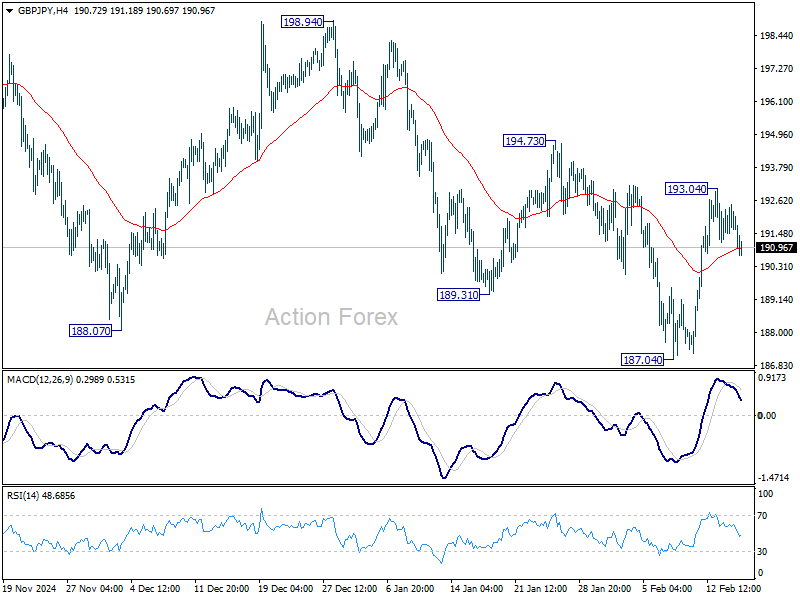
GBP/JPY Daily Outlook
Daily Pivots: (S1) 191.26; (P) 191.88; (R1) 192.29; More...
Intraday bias in GBP/JPY remains neutral for the moment. Overall, corrective pattern from 180.00 is extending, possibly with rebound from 187.04 as another upleg. Above 193.04 will target 194.73 resistance first. Firm break there will solidify this case and target 198.94 next.
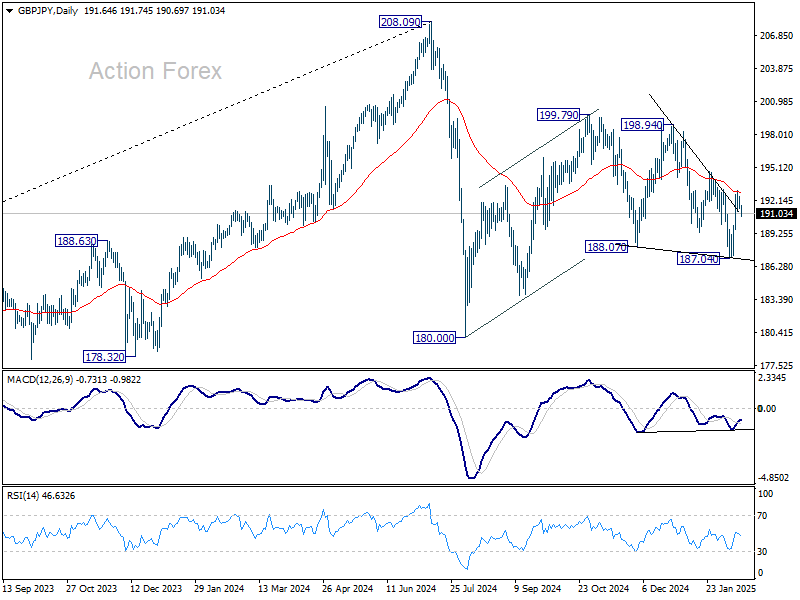
In the bigger picture, price actions from 208.09 are seen as a correction to rally from 123.94 (2020 low). Strong support should be seen from 38.2% retracement of 123.94 to 208.09 at 175.94 to contain downside. However, sustained break of 152.11 will bring deeper fall to 100% projection of 208.09 to 180.00 from 199.79 at 171.70, even still as a correction.
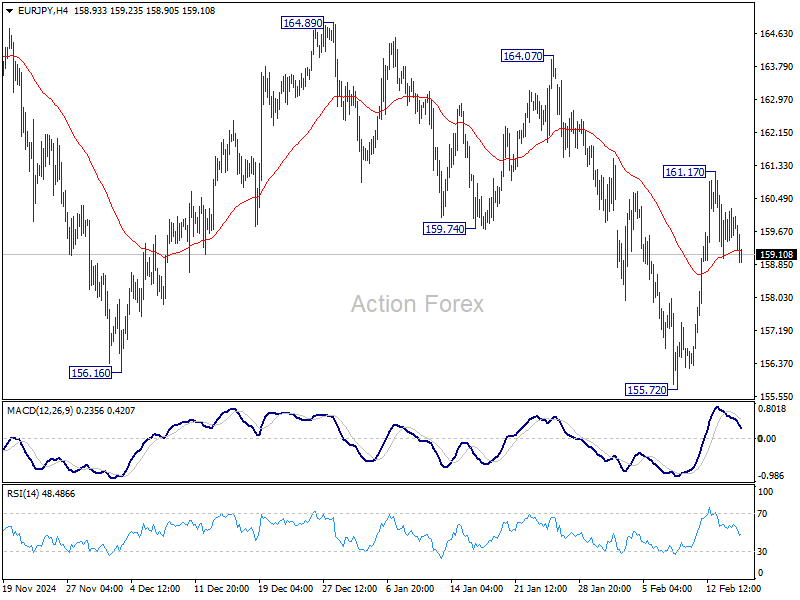
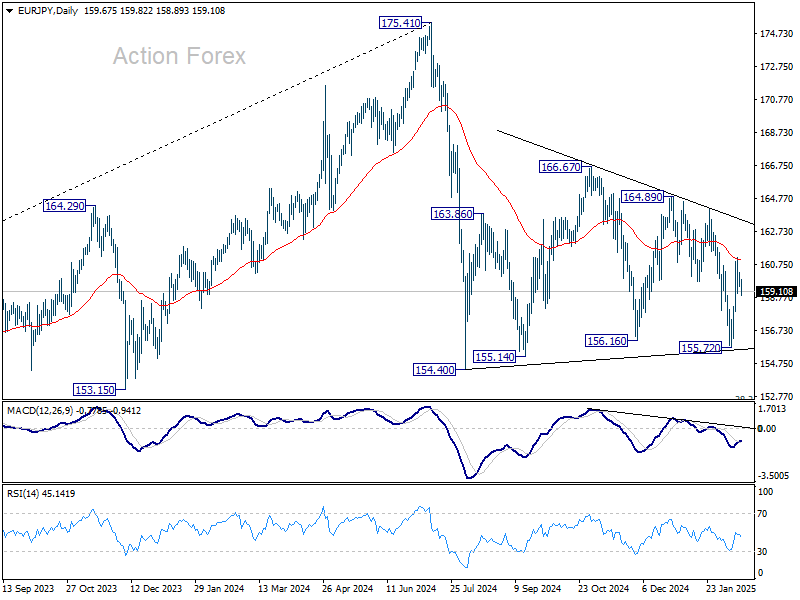
EUR/JPY Daily Outlook
Daily Pivots: (S1) 159.39; (P) 159.82; (R1) 160.22; More...
Intraday bias in EUR/JPY remains neutral for the moment. Overall, sideway pattern from 154.40 is still extending with another upleg. On the upside, above 161.17 will target 164.07 resistance and then 164.89.
In the bigger picture, price actions from 175.41 are seen as correction to rally from 114.42 (2020 low). Strong support should be seen from 38.2% retracement of 114.42 to 175.41 at 152.11 to contain downside. However, sustained break of 152.11 will bring deeper fall even still as a correction.
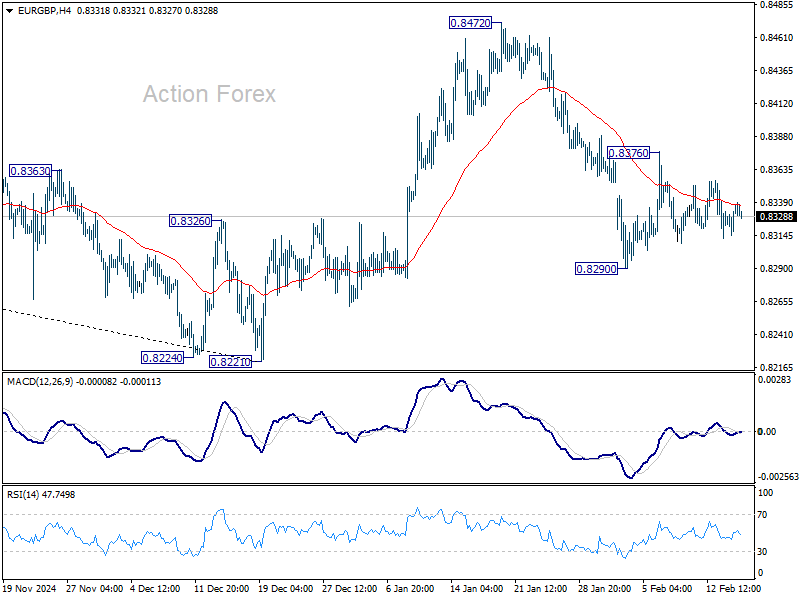
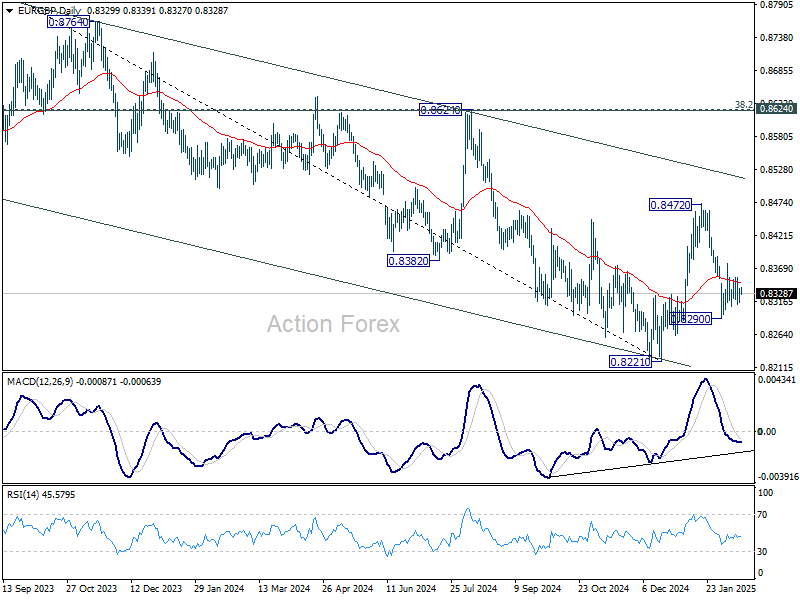
EUR/GBP Daily Outlook
Daily Pivots: (S1) 0.8315; (P) 0.8336; (R1) 0.8357; More...
Intraday bias in EUR/GBP remains neutral and near term outlook is mixed. On the upside, above 0.8376 minor resistance will bring stronger rally towards 0.8472. However, on the downside, break of 0.8290 will resume the fall from 08472 to retest 0.8221 low.
In the bigger picture, rebound from 0.8221 medium term bottom could extend higher through 55 W EMA (now at 0.8435). However, medium term outlook will be neutral at best as long as 0.8624 cluster resistance zone (38.2% retracement of 0.9267 to 0.8221 at 0.8621) holds. Another decline through 0.8221 would remain mildly in favor.
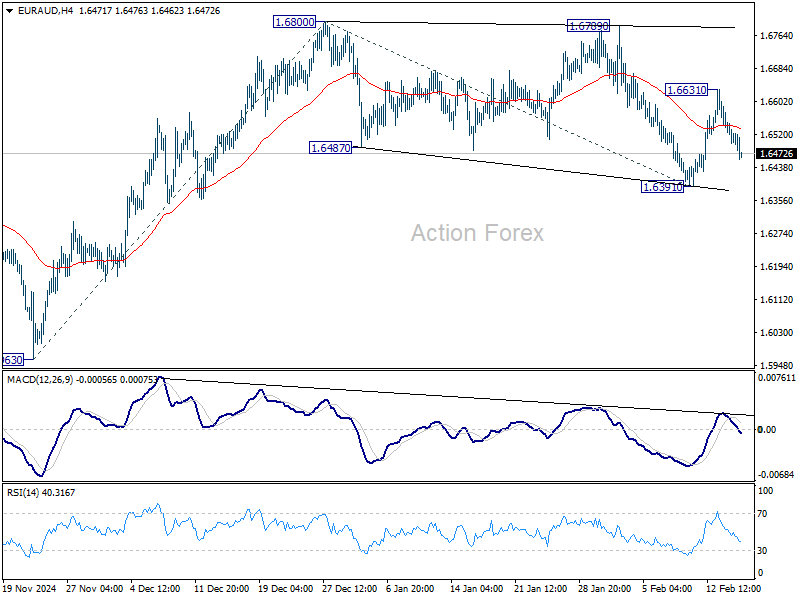
EUR/AUD Daily Outlook
Daily Pivots: (S1) 1.6484; (P) 1.6531; (R1) 1.6562; More...
Intraday bias in EUR/AUD remains neutral for the moment. The favored case remains that consolidation pattern from 1.6800 has completed at 1.6391 already. On the upside above 1.6631 will bring retest of 1.6800 first. Firm break there will resume the rally from 1.5963 to 61.8% projection of 1.5693 to 1.6800 from 1.6391 at 1.6908.
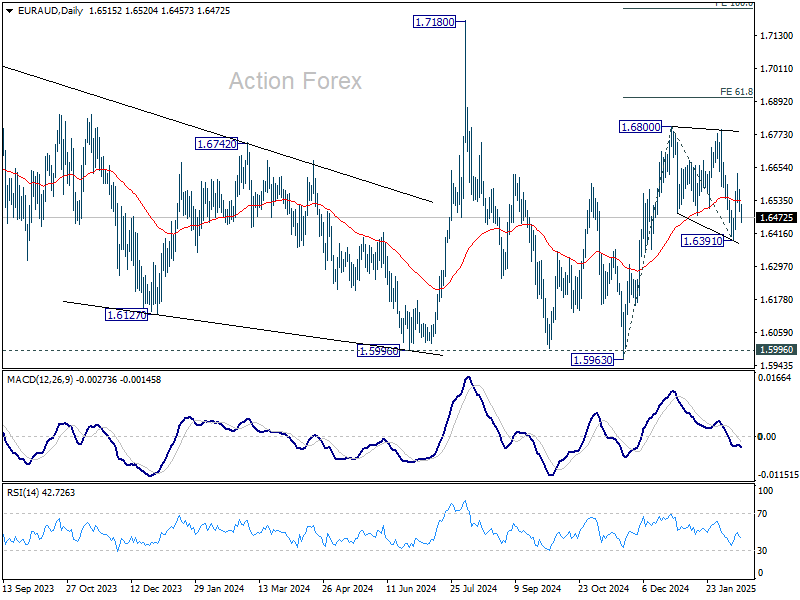
In the bigger picture, with 1.5996 key support (2024 low) intact, larger up trend from 1.4281 (2022 low) is still in favor to resume through 1.7180 at a later stage. Nevertheless, sustained break of 1.5996 will indicate that such up trend has completed and deeper decline would be seen.
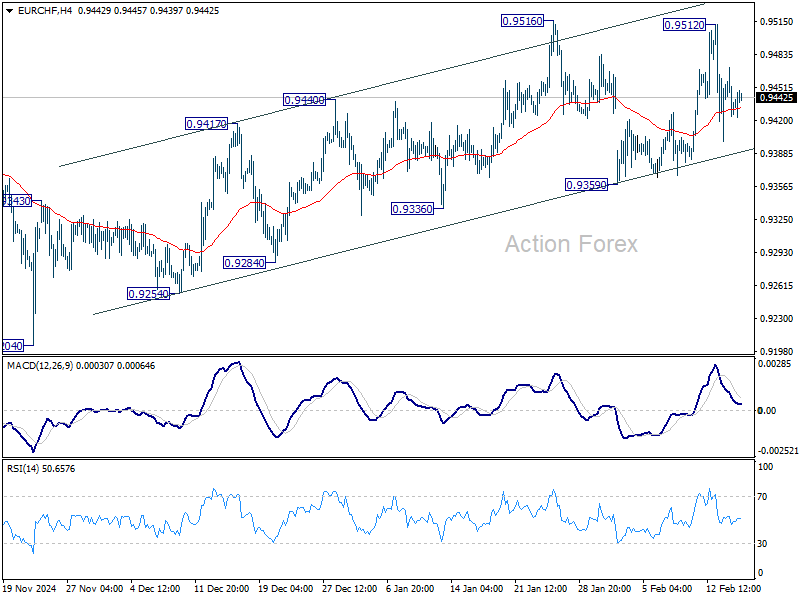
EUR/CHF Daily Outlook
Daily Pivots: (S1) 0.9420; (P) 0.9447; (R1) 0.9468; More....
Intraday bias in EUR/CHF stays neutral with mixed near term outlook. On the downside, break of 0.9359 support will revive the case that choppy rise from 0.9204 is merely a correction and has completed. Deeper fall should then be seen back to retest 0.9204 low. However, firm break of 0.9516 and sustained trading above 0.9481 fibonacci level will carry larger bullish implication and extend the rise from 0.9204.
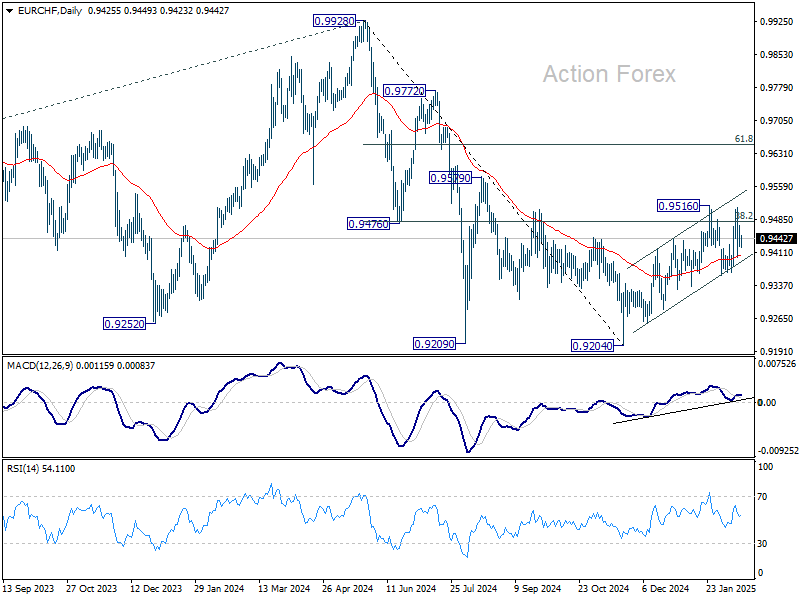
In the bigger picture, sustained trading above 38.2% retracement of 0.9928 to 0.9204 at 0.9481 should confirm that whole fall from 0.9928 has completed at 0.9204. Further rally should then be seen back to 61.8% retracement at 0.9651 and above. However, another rejection by 0.9481 will keep outlook bearish for extending larger down trend through 0.9204.
Gold Prices Break Record But WTI Crude Oil Struggle
Gold price rallied further and traded to a new all-time high. Crude oil is showing bearish signs and might decline below $70.00.
Important Takeaways for Gold and WTI Crude Oil Prices Analysis Today
- Gold price started a steady increase above the $2,880 zone against the US Dollar.
- A major bullish trend line is forming with support at $2,885 on the hourly chart of gold at FXOpen.
- WTI Crude oil prices failed to clear the $73.50 region and started a fresh decline.
- There is a key bearish trend line forming with resistance at $71.00 on the hourly chart of XTI/USD at FXOpen.
Gold Price Technical Analysis
On the hourly chart of Gold at FXOpen, the price found support near the $2,855 zone. The price remained in a bullish zone and started a strong increase above $2,900.
There was a decent move above the 50-hour simple moving average and $2,920. The bulls pushed the price above the $2,930 and $2,935 resistance levels. Finally, the price climbed as high as $2,940 before there was a pullback.
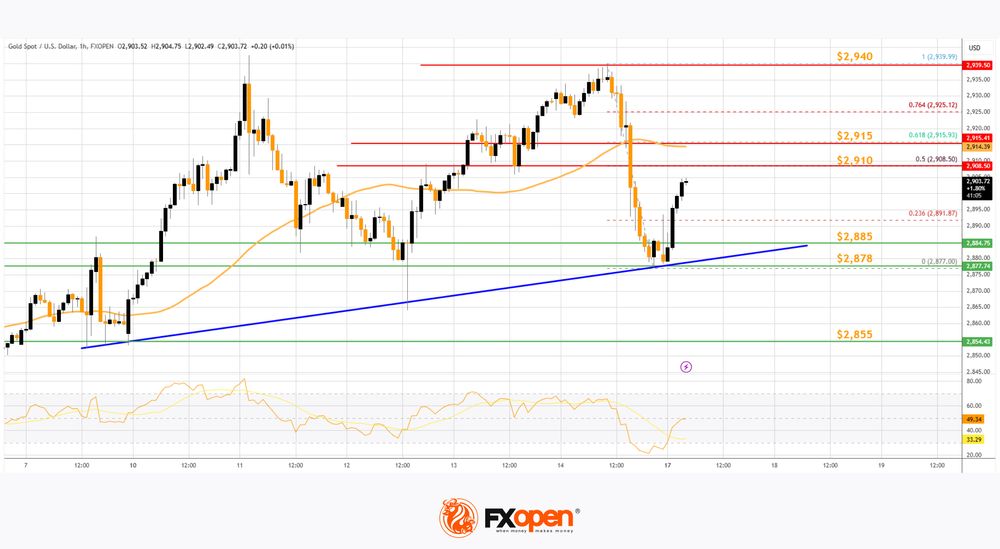
The price tested the $2,880 zone and is currently rising. There was a move above the 23.6% Fib retracement level of the downside correction from the $2,940 swing high to the $2,878 low, and the RSI is stable above 45.
Immediate resistance is near the $2,910 level and the 50% Fib retracement level of the downside correction from the $2,940 swing high to the $2,878 low.
The next major resistance is near the $2,915 level. An upside break above the $2,915 resistance could send Gold price toward $2,940. Any more gains may perhaps set the pace for an increase toward the $2,950 level.
Initial support on the downside is near a major bullish trend line at $2,885. The first major support is near the $2,878 zone. If there is a downside break below the $2,878 support, the price might decline further.
In the stated case, the price might drop toward the $2,855 zone. Any more losses might push the price toward the $2,840 level.
WTI Crude Oil Price Technical Analysis
On the hourly chart of WTI Crude Oil at FXOpen, the price struggled to clear the $73.50 resistance zone against the US Dollar. The price started a fresh decline below the $72.20 support.
The price even dipped below the $71.50 level and the 50-hour simple moving average. The bulls are now active near the $70.20 level. A low was formed at $70.12, and the price is now consolidating losses. If there is a fresh increase, it could face resistance near the 50% Fib retracement level of the downward move from the $71.87 swing high to the $70.12 low at $71.00.
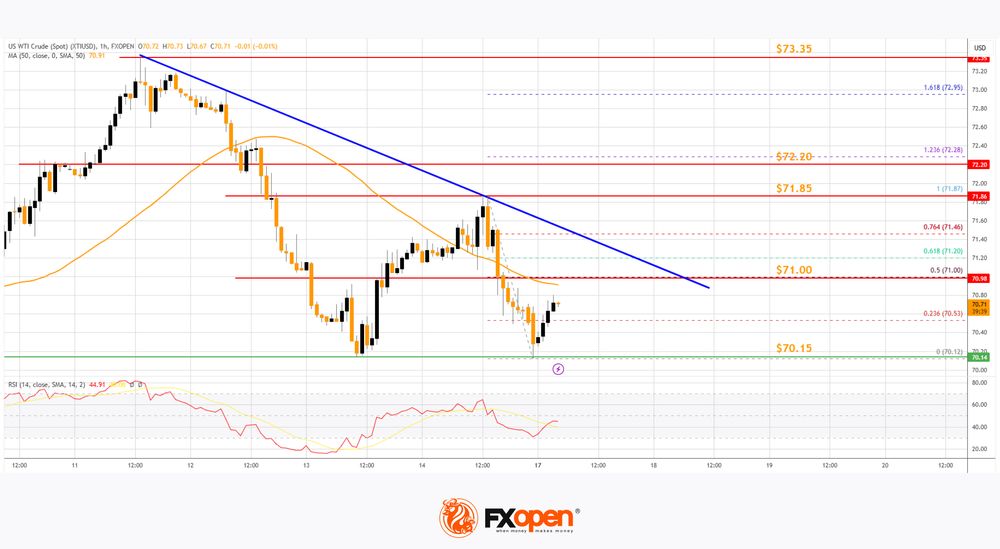
There is also a key bearish trend line forming with resistance at $71.00. The first major resistance is near the $71.85 level. Any more gains might send the price toward the $72.20 level.
The main resistance could be near the $73.35 level. Conversely, the price might continue to move down and revisit the $70.00 support. The next major support on the WTI crude oil chart is $68.80.
If there is a downside break, the price might decline toward $66.50. Any more losses may perhaps open the doors for a move toward the $65.00 support zone.
Start trading commodity CFDs with tight spreads. Open your trading account now or learn more about trading commodity CFDs with FXOpen.
This article represents the opinion of the Companies operating under the FXOpen brand only. It is not to be construed as an offer, solicitation, or recommendation with respect to products and services provided by the Companies operating under the FXOpen brand, nor is it to be considered financial advice.