
Sample Category Title
USD/CHF Weekly Outlook
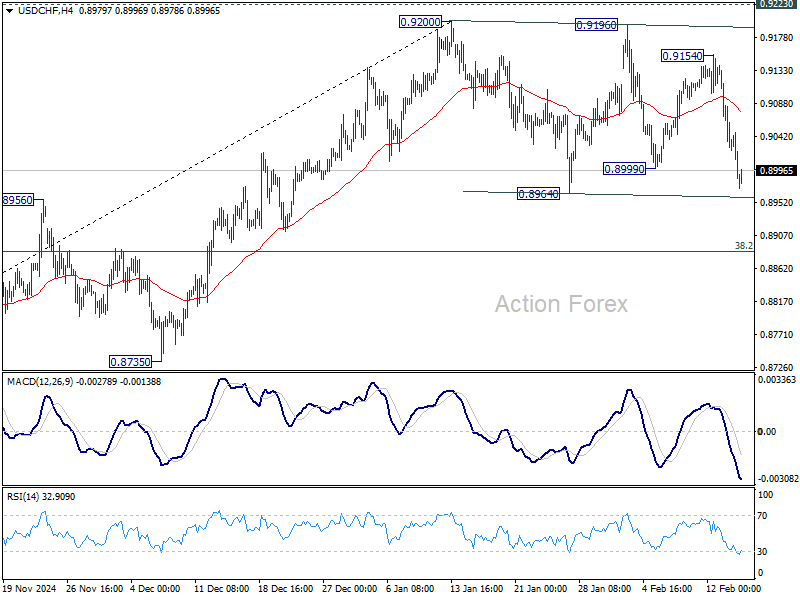
USD/CHF extended the corrective pattern from 0.9200 last week. Initial bias stays neutral this week first. Further rise would remain in favor as long as 38.2% retracement of 0.8374 to 0.9200 at 0.8884 holds. On the upside, firm break of 0.9223 key resistance will carry larger bullish implication. However, sustained break of 0.8884 will indicate bearish reversal, and target 61.8% retracement at 0.8690 instead.
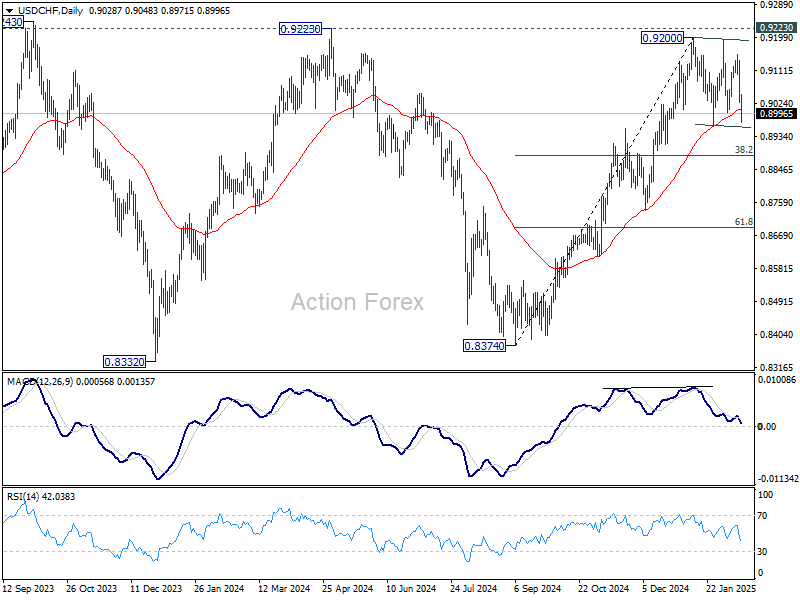
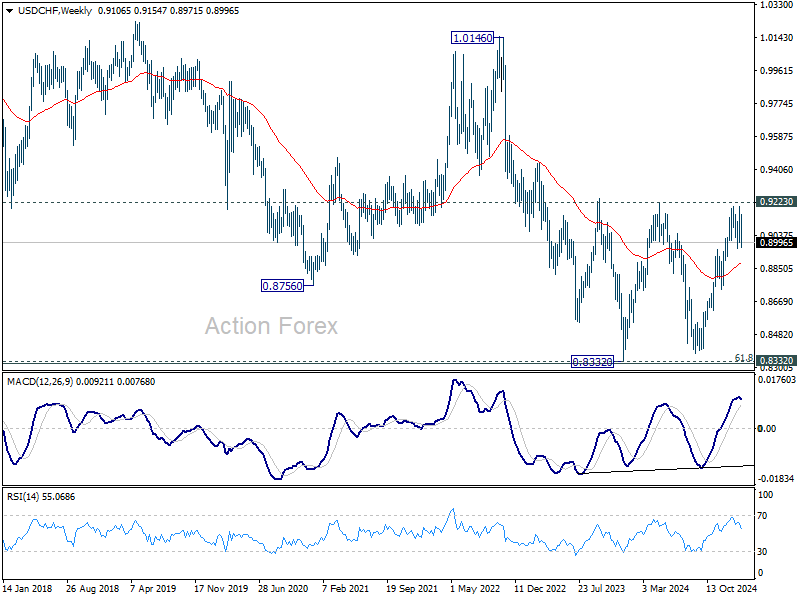
In the bigger picture, decisive break of 0.9223 resistance will argue that whole down trend from 1.0342 (2017 high) has completed with three waves down to 0.8332 (2023 low). Outlook will be turned bullish for 1.0146 resistance next. Nevertheless, rejection by 0.9223 will retain medium term bearishness for another decline through 0.8332 at a later stage.
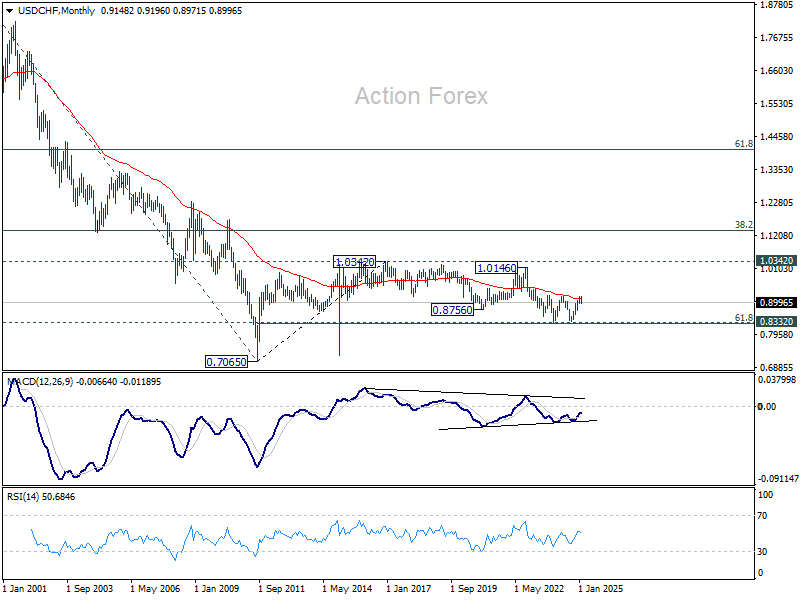
In the long term picture, price action from 0.7065 (2011 low ) are seen as a corrective pattern to the multi-decade down trend from 1.8305 (2000 high). Fall from 1.0342 (2016 high) is seen as the second leg. Sustained break of 55 M EMA (now at 0.9131) will indicate that the third leg has already started. However, rejection by 55 M EMA again, followed by break of 61.8% retracement of 0.7065 to 1.0342 at 0.8317, will pave the way back to 0.7065.
AUD/USD Weekly Report
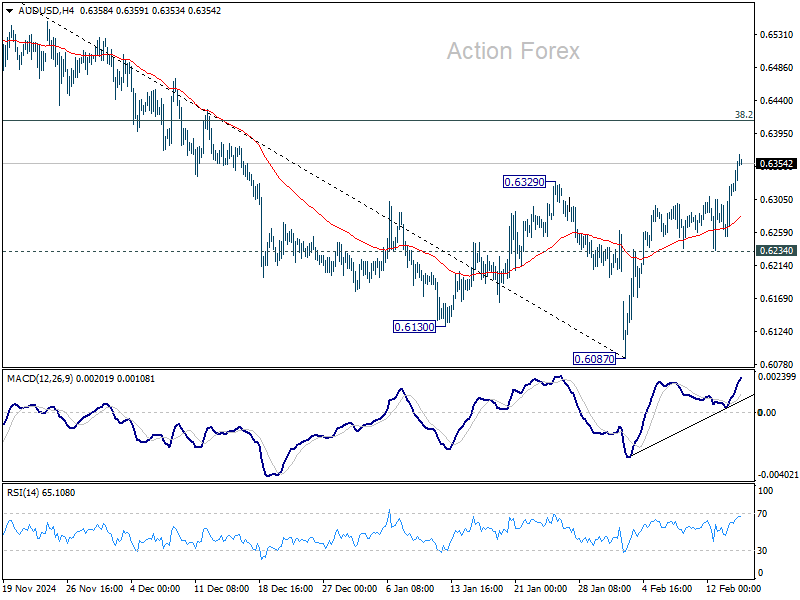
AUD/USD's break of 0.6329 resistance last week indicates that rebound from 0.6087 is at least correcting the whole fall from 0.6941. Initial bias is now on the upside for 38.2% retracement of 0.6941 to 0.6087 at 0.6413. On the downside, however, break of 0.6234 support will suggest that the rebound has completed and bring retest of 0.6087 low.
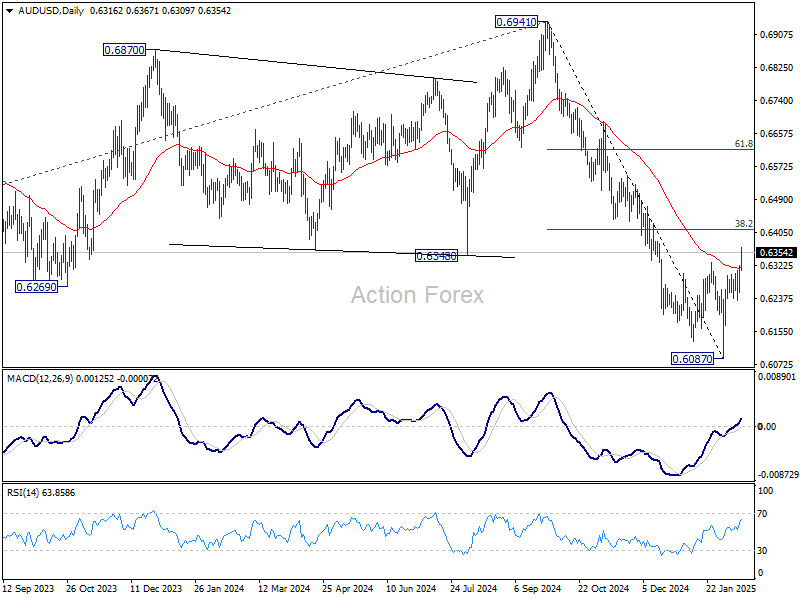
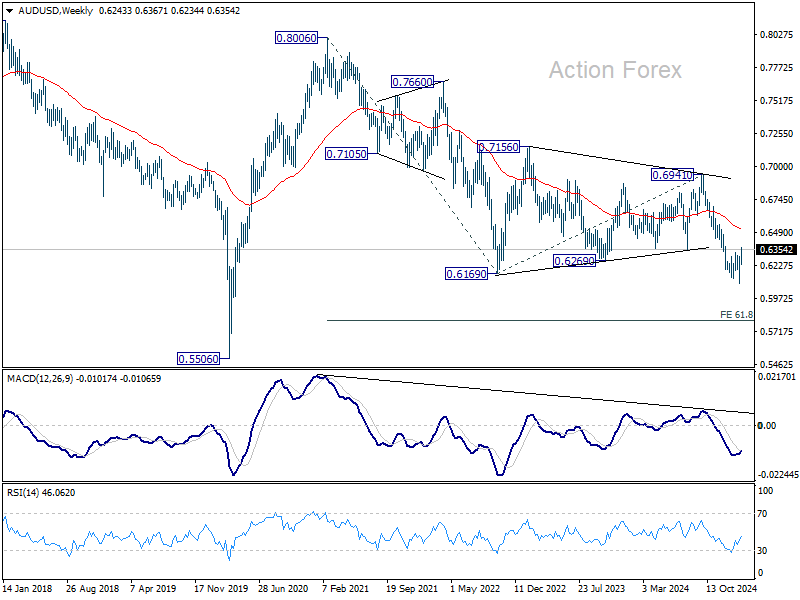
In the bigger picture, fall from 0.6941 (2024 high) is seen as part of the down trend from 0.8006 (2021 high). Next medium term target is 61.8% projection of 0.8006 to 0.6169 from 0.6941 at 0.5806. In any case, outlook will stay bearish as long as 55 W EMA (now at 0.6516) holds.
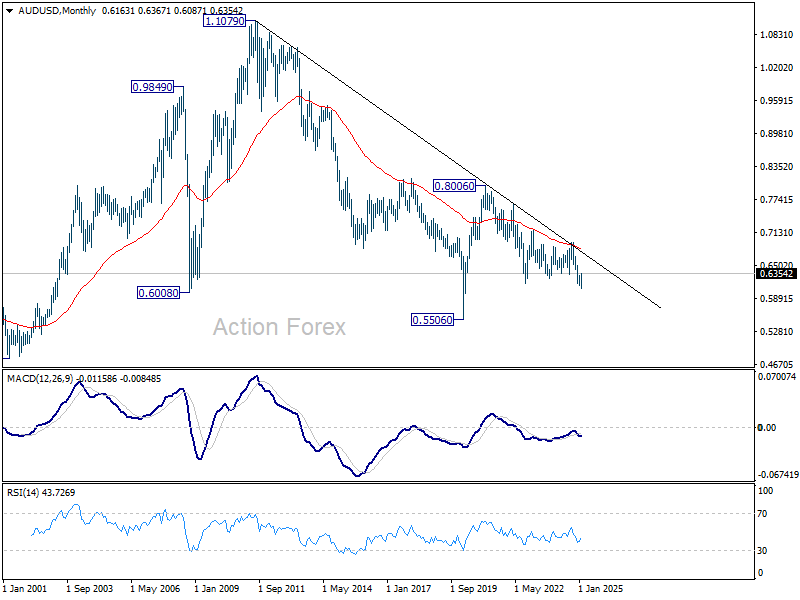
In the long term picture, prior rejection by 55 M EMA (now at 0.6846) is taken as a bearish signal. But for now, fall from 0.8006 is still seen as the second leg of the corrective pattern from 0.5506 long term bottom (2020 low). Hence, in case of deeper fall, strong support should emerge above 0.5506 to contain downside to bring reversal. However, this view is subject to adjustment if current decline accelerates further.
USD/CAD Weekly Outlook
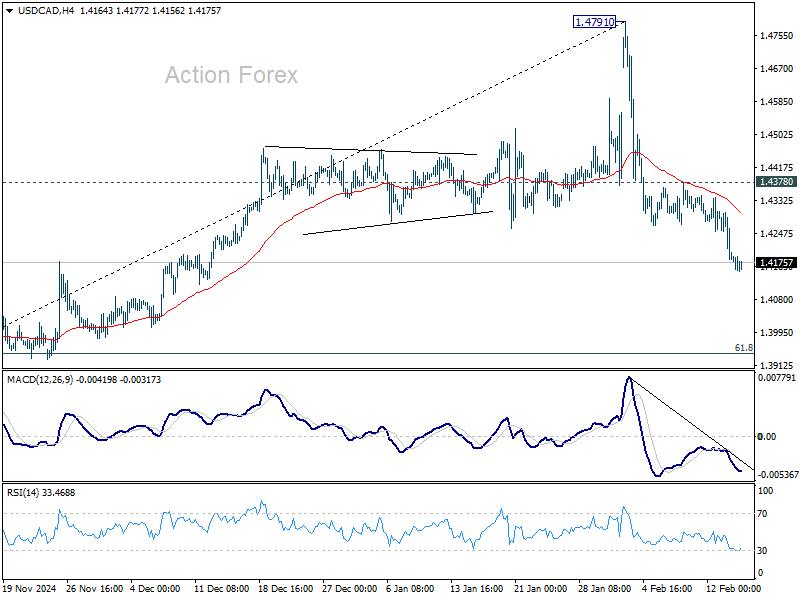
USD/CAD's fall from 1.4791 extended lower last week and the development suggests that deeper correction is underway. Initial bias stays on the downside this week for 1.3946 cluster support (61.8% retracement of 1.3418 to 1.4791 at 1.3942). For now, risk will stay on the downside as long as 1.4378 resistance holds, in case of recovery.
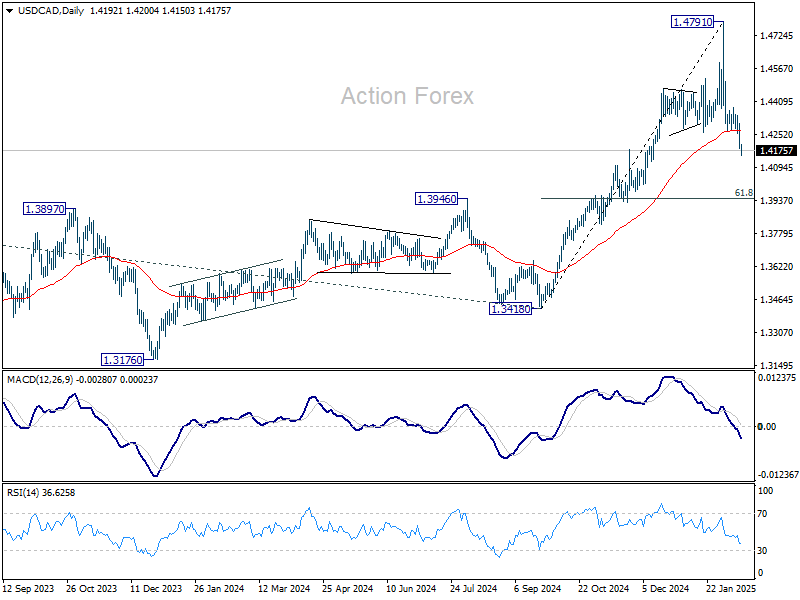
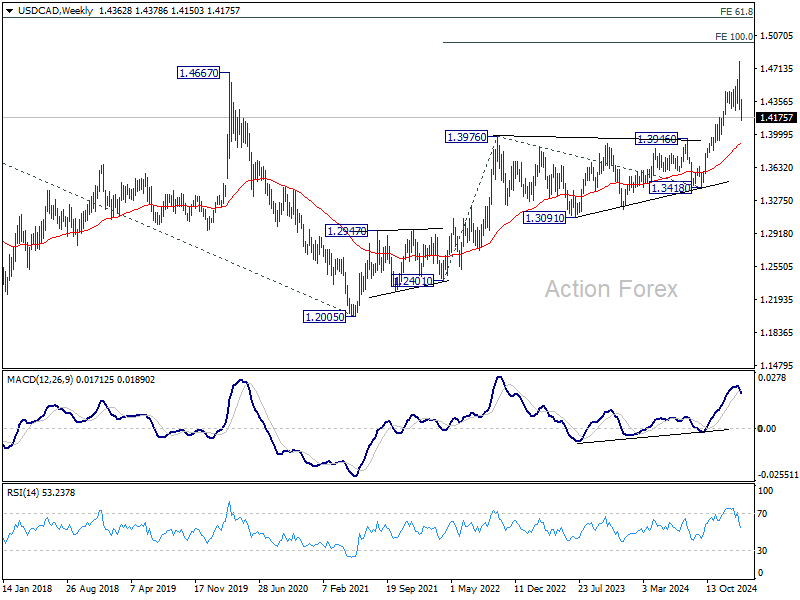
In the bigger picture, long term up trend is tentatively seen as resuming with prior breach of 1.4667/89 key resistance zone (2020/2015 highs). Next target is 100% projection of 1.2401 to 1.3976 from 1.3418 at 1.4993. This will remain the favored case as long as 1.3976 resistance turned holds (2022 high), even in case of deep pullback.
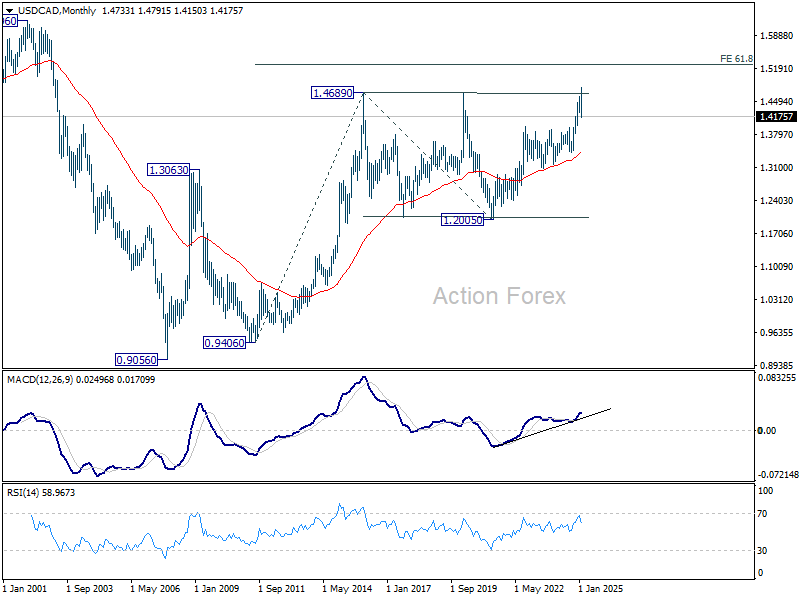
In the longer term picture, up trend from 0.9506 (2007 low) is in progress and possibly resuming. Next target is 61.8% projections of 0.9406 to 1.4689 from 1.2005 at 1.5270. While rejection by 1.4689 will delay the bullish case, further rally will remain in favor as long as 55 M EMA (1.3420) holds.
GBP/JPY Weekly Outlook
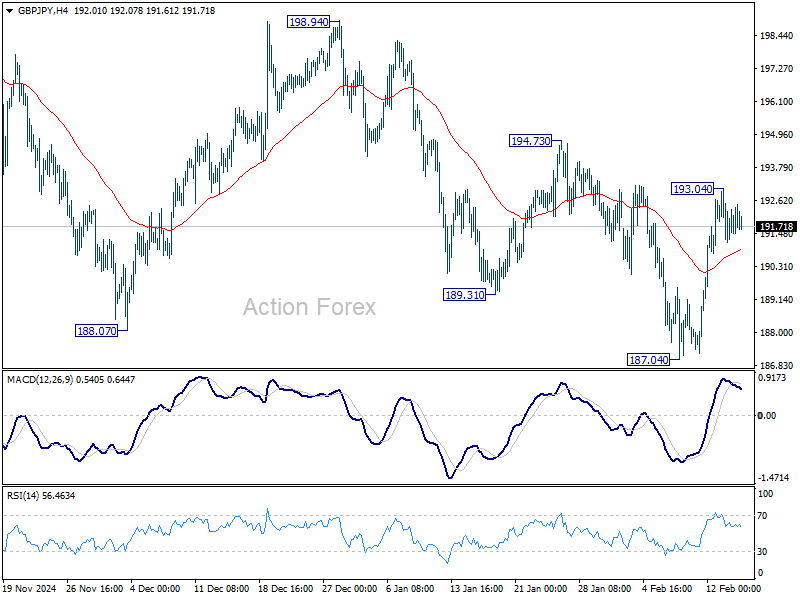
GBP/JPY's strong rebound last week suggests that fall from 198.94 has completed at 187.04 already. But with a temporary top formed at 193.04, initial bias remains neutral this week first. Overall, corrective pattern from 180.00 is extending, possibly with rebound from 187.04 as another upleg. Above 193.04 will target 194.73 resistance first. Firm break there will solidify this case and target 198.94 next.
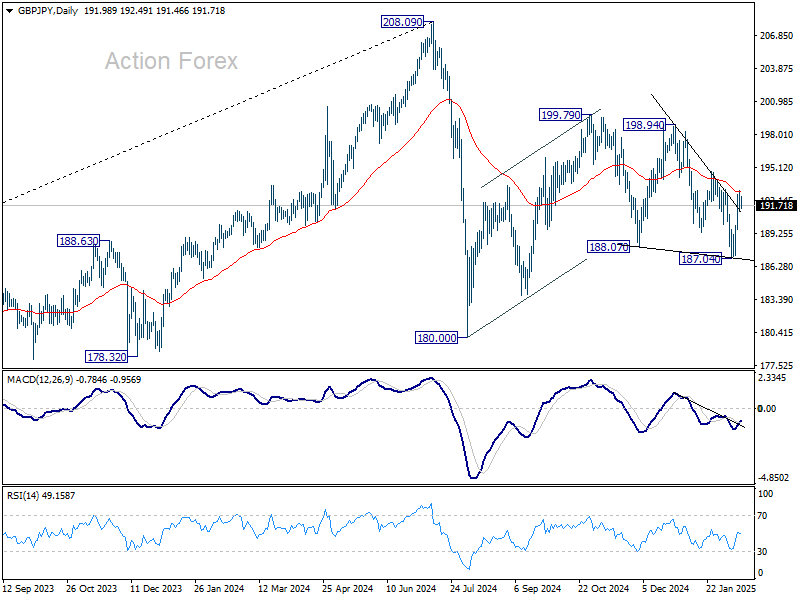
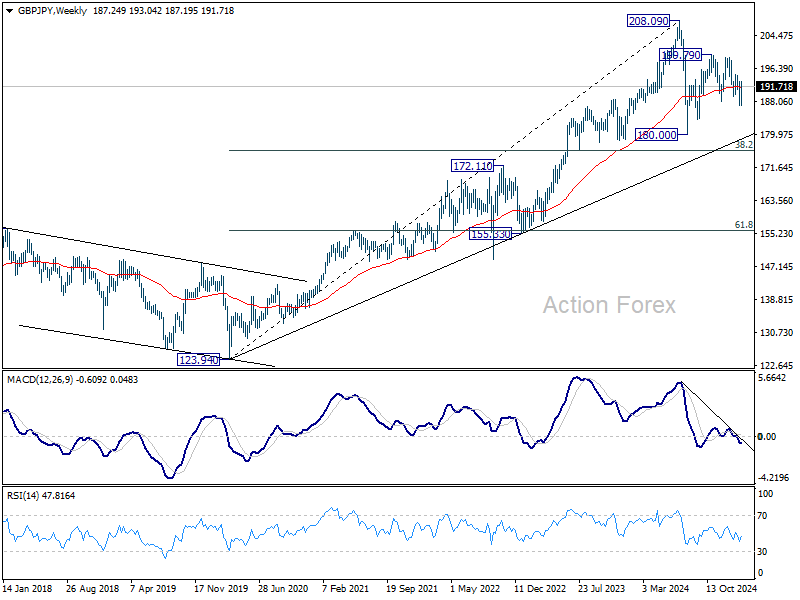
In the bigger picture, price actions from 208.09 are seen as a correction to rally from 123.94 (2020 low). Strong support should be seen from 38.2% retracement of 123.94 to 208.09 at 175.94 to contain downside. However, sustained break of 152.11 will bring deeper fall even still as a correction.
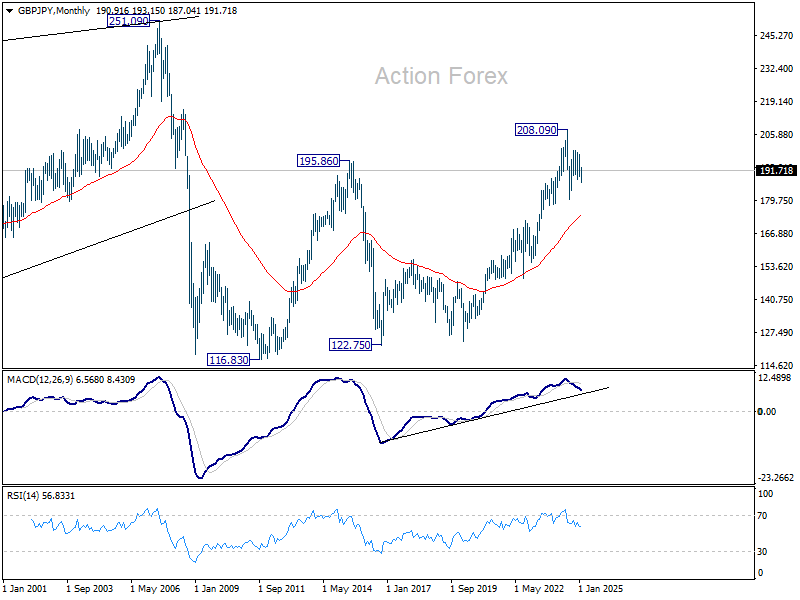
In the longer term picture, while a medium term top was formed at 208.09 (2024 high), it's still early to conclude that the up trend from 122.75 (2016 low) has completed. But GBP/JPY is at least in a medium term corrective phase, with risk of correction to 55 M EMA (now at 173.92).
EUR/JPY Weekly Outlook
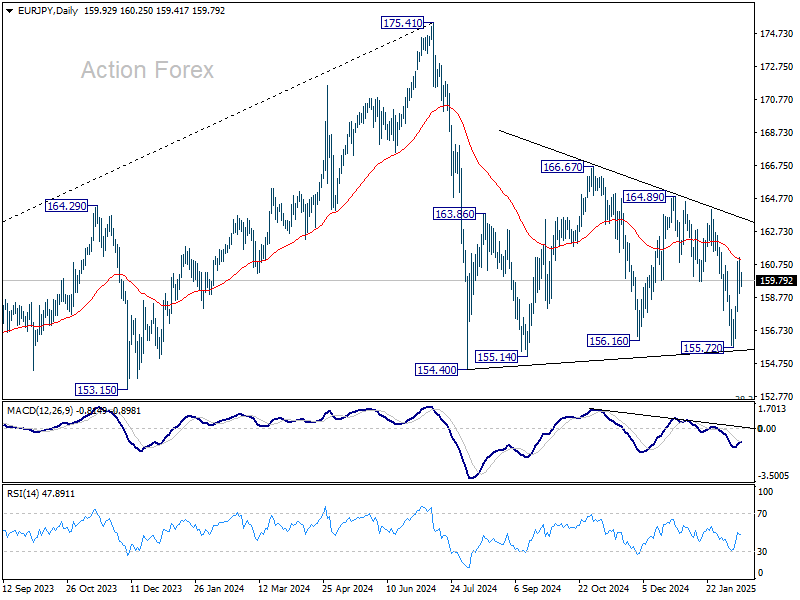
EUR/JPY's strong rebound last week suggests that fall from 164.89 has completed at 155.72 already. But with a temporary top formed at 161.17, initial bias remains neutral this week first. Overall, sideway pattern from 154.40 is still extending with another upleg. On the upside, above 161.17 will target 164.07 resistance and then 164.89.

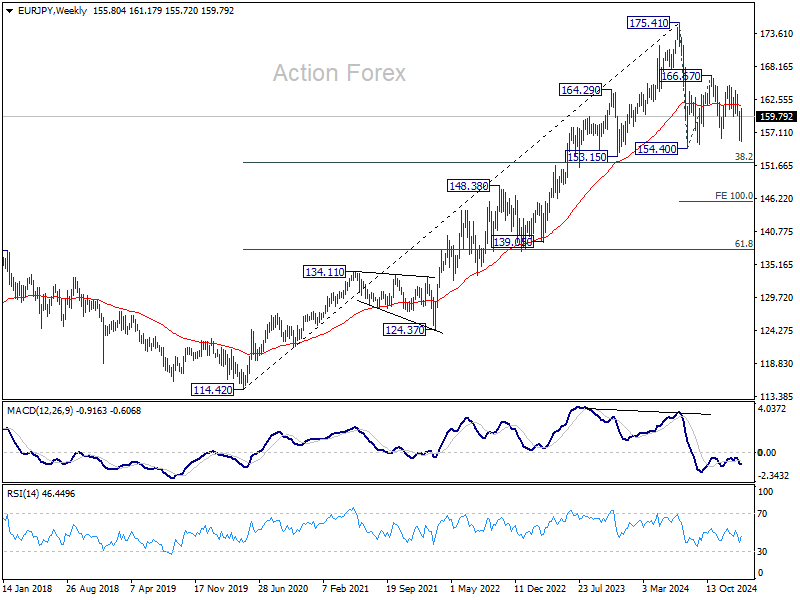
In the bigger picture, price actions from 175.41 are seen as correction to rally from 114.42 (2020 low). Strong support should be seen from 38.2% retracement of 114.42 to 175.41 at 152.11 to contain downside. However, sustained break of 152.11 will bring deeper fall even still as a correction.
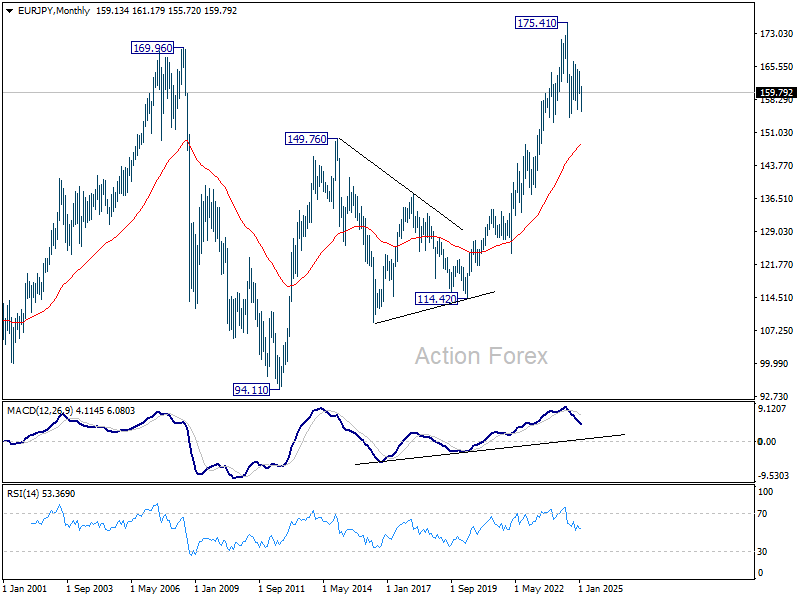
In the long term picture, while 175.41 is at least a medium term top, it's still early to conclude that up trend from 94.11 (2012 low) has completed. A medium term corrective phase is in progress with risk of deeper fall back to 55 M EMA (now at 148.27).
EUR/GBP Weekly Outlook
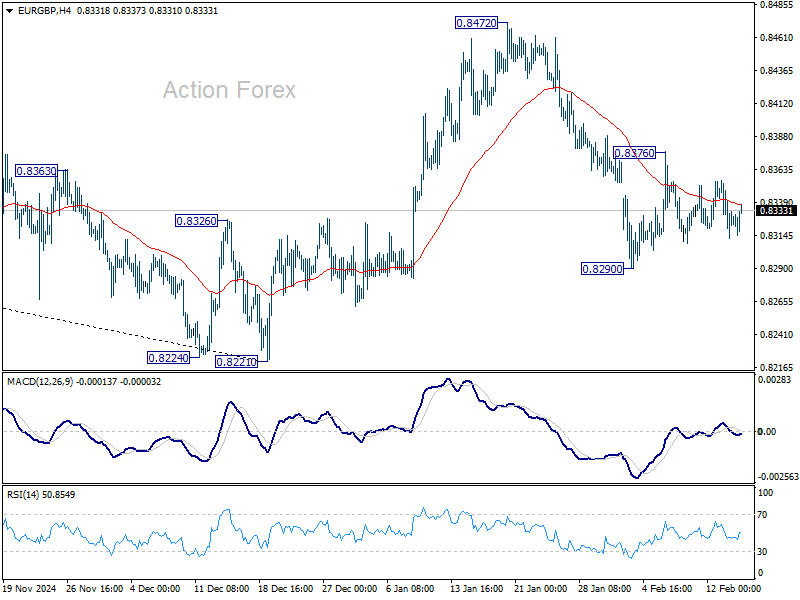
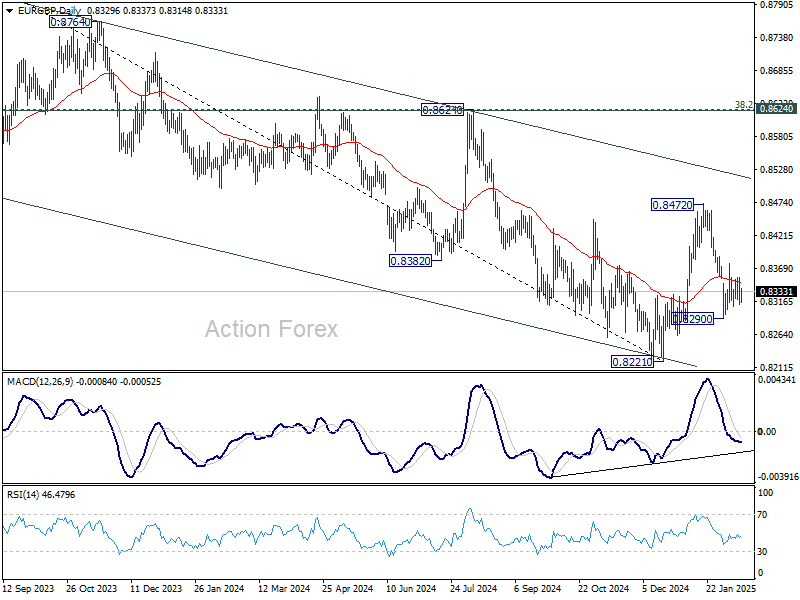
Range trading continued in EUR/GBP last week and near term outlook remains mixed. Initial bias stays neutral this week first. On the upside, above 0.8376 minor resistance will bring stronger rally towards 0.8472. However, on the downside, break of 0.8290 will resume the fall from 08472 to retest 0.8221 low.
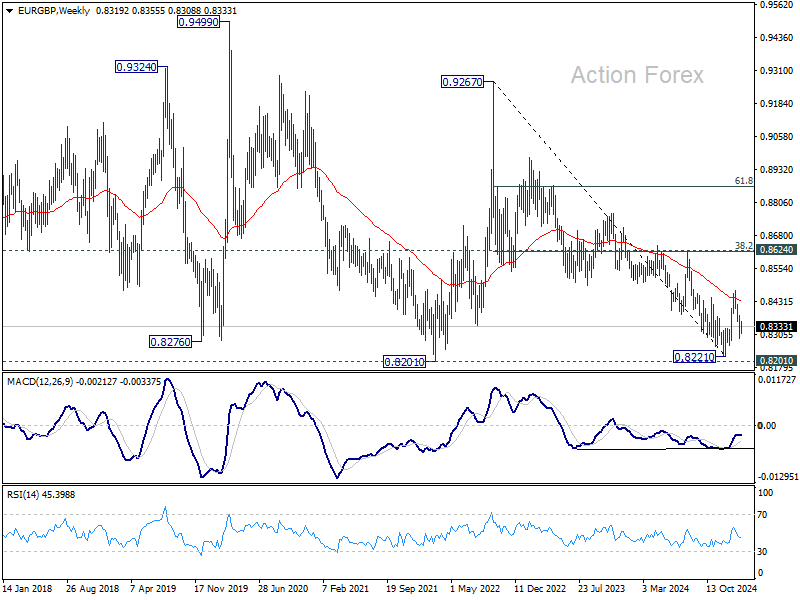
In the bigger picture, rebound from 0.8221 medium term bottom could extend higher through 55 W EMA (now at 0.8435). However, medium term outlook will be neutral at best as long as 0.8624 cluster resistance zone (38.2% retracement of 0.9267 to 0.8221 at 0.8621) holds. Another decline through 0.8221 would remain mildly in favor.
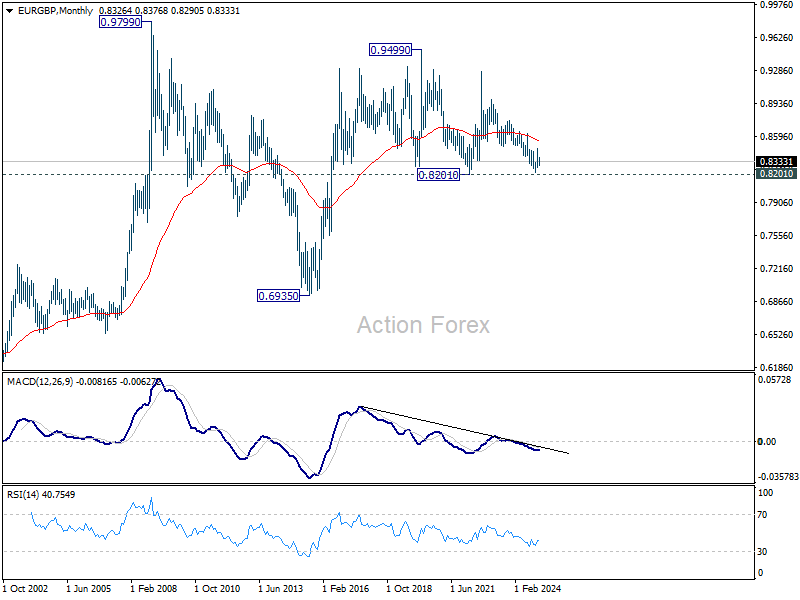
In the long term picture, price action from 0.9499 (2020 high) is seen as part of the long term range pattern from 0.9799 (2008 high). Range trading should continue between 0.8201 and 0.9499, until there is clear signal of imminent breakout.
EUR/AUD Weekly Outlook
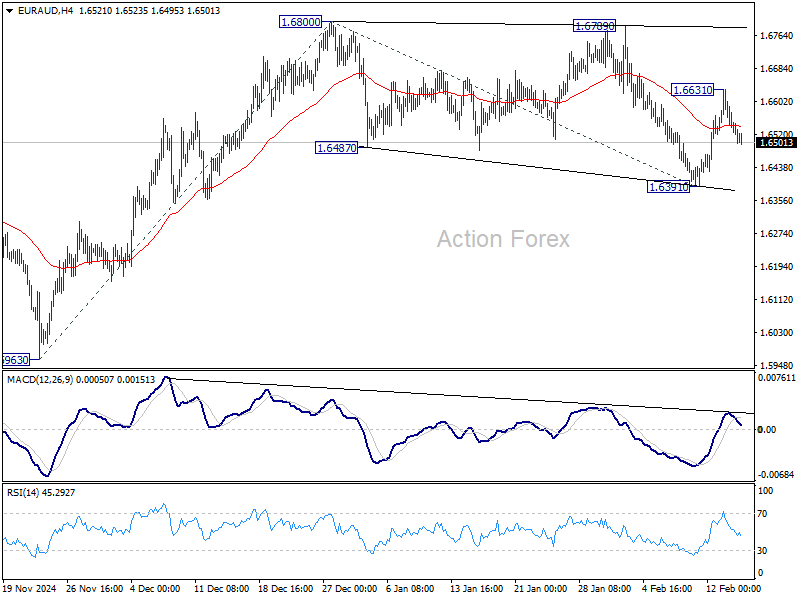
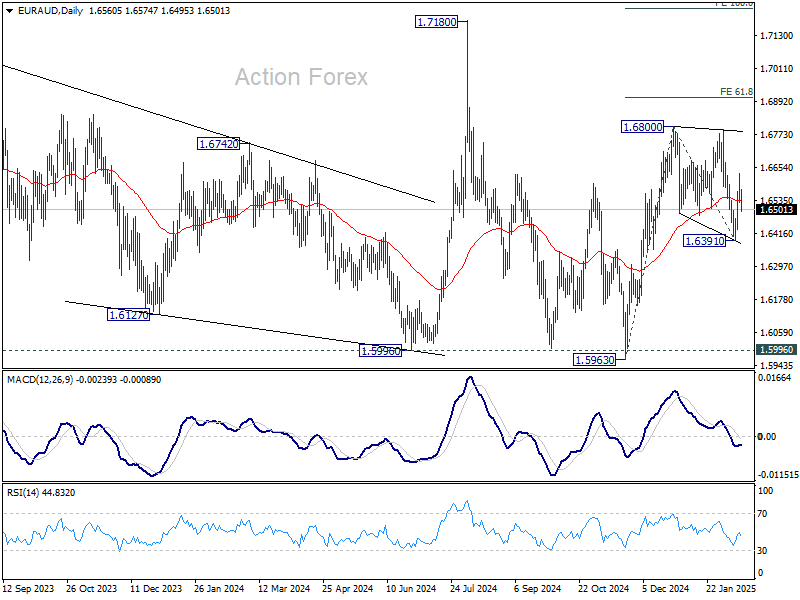
EUR/AUD drew support from 55 W EMA last week and rebounded after dipping to 1.6391. But it then lose momentum after hitting 1.6631. Initial bias is turned neutral this week first. Current development suggests that corrective pattern from 1.6800 has completed at 1.6391 already. On the upside above 1.6631 will bring retest of 1.6800 first. Firm break there will resume the rally from 1.5963 to 61.8% projection of 1.5693 to 1.6800 from 1.6391 at 1.6908.
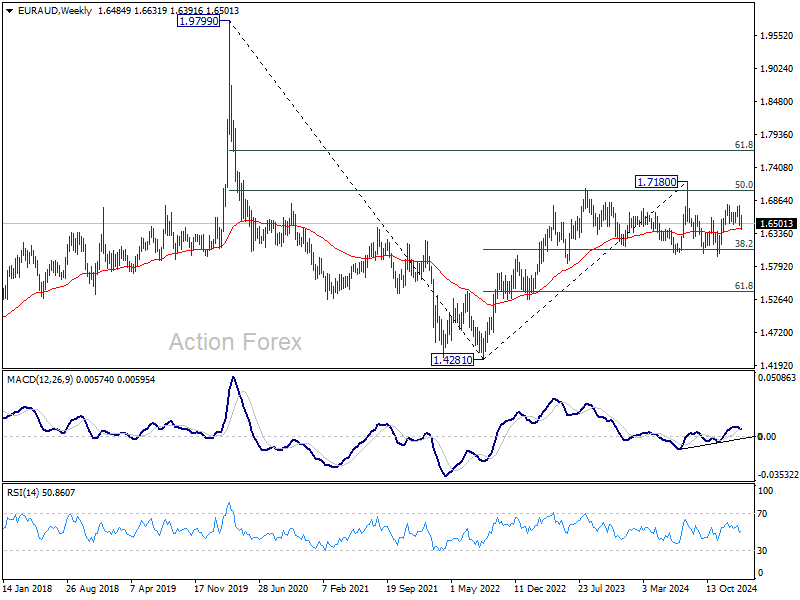
In the bigger picture, with 1.5996 key support (2024 low) intact, larger up trend from 1.4281 (2022 low) is still in favor to resume through 1.7180 at a later stage. Nevertheless, sustained break of 1.5996 will indicate that such up trend has completed and deeper decline would be seen.
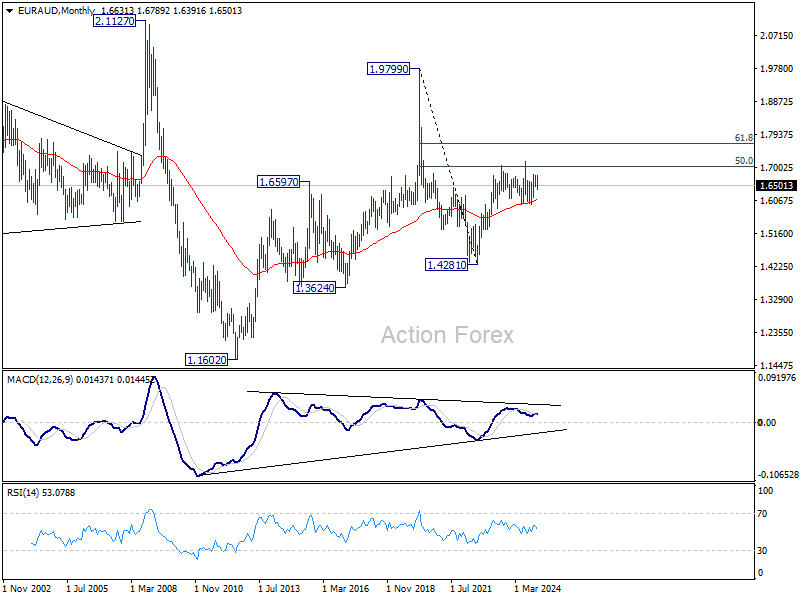
In the longer term picture, rise from 1.4281 is seen as the second leg of the pattern from 1.9799 (2020 high), which is part of the pattern from 2.1127 (2008 high). As long as 55 M EMA (now at 1.6090) holds, this second leg could still extend higher. However, sustained trading below 55 M EMA will open up the bearish case for extending the decline through 1.4281 low.
EUR/CHF Weekly Outlook
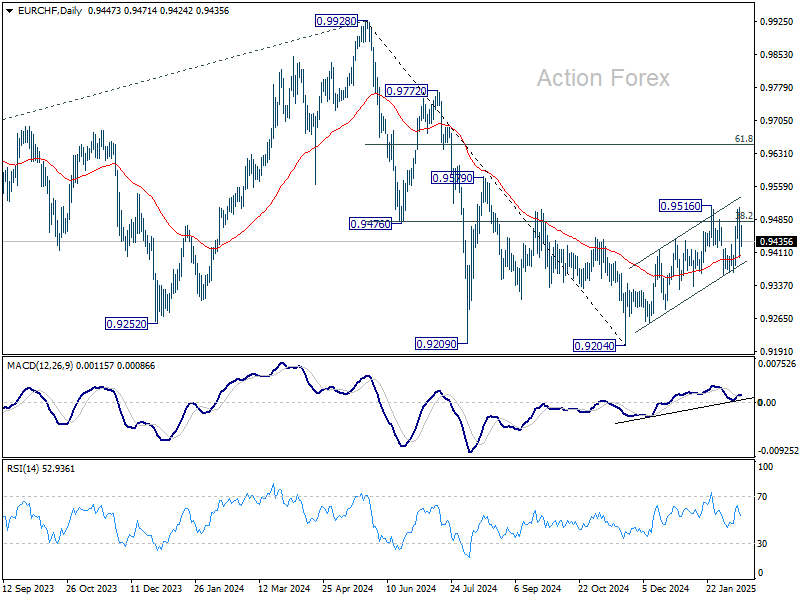
EUR/CHF's rally was limited below 0.9516 resistance last week and outlook is turned mixed for now. On the downside, break of 0.9359 support will revive the case that choppy rise from 0.9204 is merely a correction and has completed. Deeper fall should then be seen back to retest 0.9204 low. However, firm break of 0.9516 and sustained trading above 0.9481 fibonacci level will carry larger bullish implication and extend the rise from 0.9204.
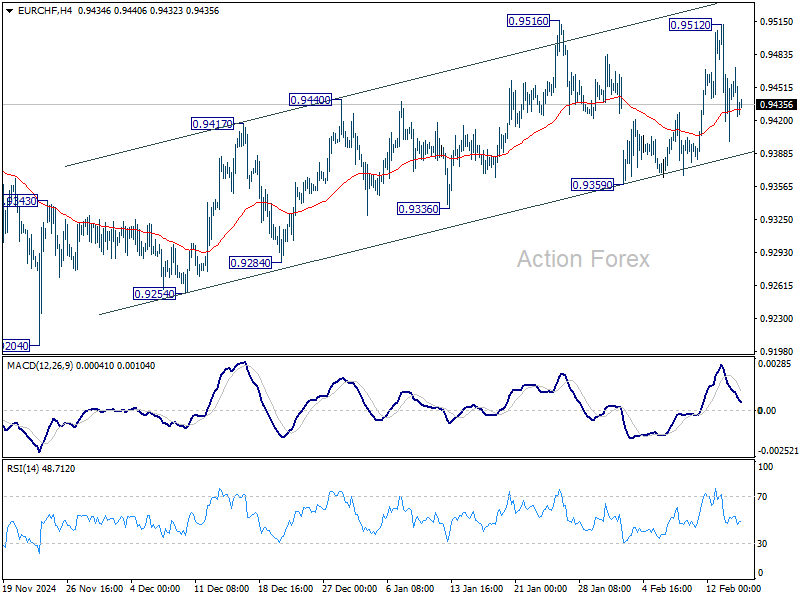
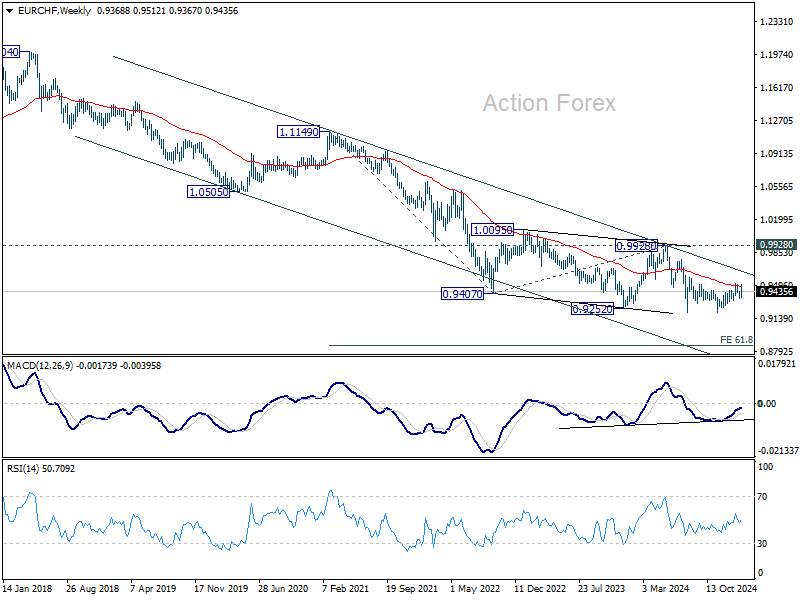
In the bigger picture, sustained trading above 38.2% retracement of 0.9928 to 0.9204 at 0.9481 should confirm that whole fall from 0.9928 has completed at 0.9204. Further rally should then be seen back to 61.8% retracement at 0.9651 and above. However, another rejection by 0.9481 will keep outlook bearish for extending larger down trend through 0.9204.
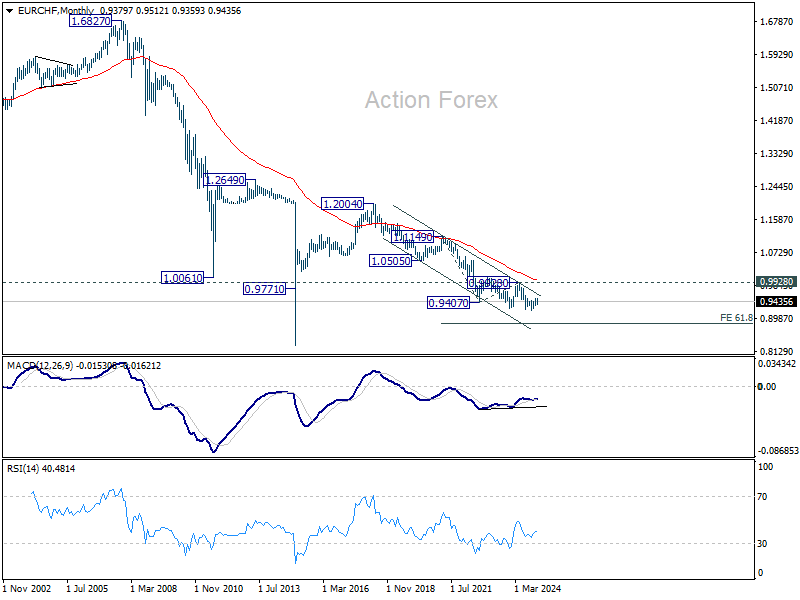
In the long term picture, as long as 0.9928 resistance holds, the multi-decade down trend remains intact, with fall from 1.2004 (2018 high) as another falling leg. Decisive break of 0.9252 (2023 low) will confirm long term down trend resumption to 61.8% projection of 1.1149 to 0.9407 from 0.9928 at 0.8851.
The Weekly Bottom Line: Hot CPI + Trade Uncertainties = Extended Fed Pause
Canadian Highlights
- President Trump announced the re-imposition of steel and aluminum tariffs. This time both metals will face a 25% tariff starting March 12th, with no carve-outs.
- The Bank of Canada’s Summary of Governing Council Deliberations highlighted concerns that tariff threats could dampen business investment.
- On inflation, policymakers noted that the BoC might look through a one-time price shock impact but warned on the risk that higher import prices could spill over into other costs, amplifying price pressures.
U.S. Highlights
- President Trump announced a universal 25% tariff on all steel and aluminum imports, effective March 12th.
- January CPI came in hotter than expected, with core inflation rising at its fastest monthly pace since March 2024.
- Speaking at a semiannual congressional hearing, Chair Powell emphasized that policymakers were in no rush to cut rates.
Canada – Another Week of Tariffs, And Counting
Four weeks into the new U.S. administration, the continued stream of tariff orders has made assessing their economic impact feel like a Sisyphean task – every time progress is made, new complexities roll in to take its place. On Monday, President Trump announced the re-imposition of steel and aluminum tariffs, originally implemented in 2018 at 25% and 10%, respectively. This time both metals will face a 25% tariff starting March 12th, with no carve-outs. If Canada and Mexico fail to meet U.S. demands on border security and drug trafficking, these tariffs will be stacked on top of the previously announced blanket tariffs, pushing steel and aluminum to 50% each. Market reaction was mixed. Steel prices rose slightly, while stock and bond markets remained relatively numb to tariff news, focusing on the hotter-than-expected U.S. CPI data.
Canada is the most exposed to these tariffs as the largest supplier of U.S. steel and aluminum, accounting for nearly 50% of aluminum and 20% of steel imports (Chart 1). However, these metals make up only 6% of Canada’s total merchandise exports. Regionally, Quebec dominates aluminum, while Ontario leads in steel exports, making both provinces most exposed.
During the 2018 tariffs, Canada’s steel exports fell sharply and output only recovered to 2018 levels by early 2022. Aluminum exports fell by a smaller magnitude, however its output remained largely unaffected. The overall economic impact of steel and aluminum tariffs was limited last time both for Canada and the U.S., though they temporarily pushed U.S. consumer prices higher. This time, the backdrop is different. The higher aluminum tariff this round could have a more detrimental effect on Canada’s exporters. Additionally, inflation was subdued in 2018, while now it’s a primary concern.
Meanwhile, the uncertainty surrounding U.S. trade policy is already weighing on Canada’s economy. The Economic Policy Uncertainty Index for Canada hit a record high in January, before the first tariff announcement (Chart 2). Research suggests that heightened policy uncertainty discourages business investment, as firms delay or scale back capital expenditures. The Bank of Canada’s Summary of Governing Council Deliberations, released Wednesday, reinforced this concern, noting that tariff threats “would almost certainly damage business investment in Canada”.
Tariffs also increase inflation risks. Canada will likely respond with countermeasures, raising prices for imported goods. While the Bank of Canada might look through a one-term impact, policymakers warned that “given the size of the shock, there was a risk that higher import prices could feed into other prices”. Supply chain disruptions could further exacerbate these pressures, though a weaker global trade environment might curb demand and lower oil prices. Meanwhile, a weaker Loonie could help offset export losses but would also make imports more expensive. With these competing forces at play, the BoC faces a delicate balancing act, just like the rest of Canada, bracing for another week of tariff threats.
U.S. – Hot CPI + Trade Uncertainties = Extended Fed Pause
Tariffs remained the policy focus of the new administration this week, with President Trump announcing a universal 25% tariff on all steel and aluminum imports into the U.S., effective March 12th. Financial markets were largely unperturbed by the announcement, perhaps because the more targeted measures hinted towards a broader pivot on how the administration planned to implement its tariff agenda. But a hotter-than-expected CPI reading for January and a firm commitment from Chair Powell that policymakers were in no hurry to cut rates, helped to temporarily sour the mood by mid-week. Treasury yields across the curve briefly pushed higher only to completely retrace on Thursday, as President Trump’s threat of announcing further reciprocal tariffs showed no immediate action. The S&P 500 ended the week 1.6% higher, while Treasury yields were largely unchanged, with the 10-year currently sitting at 4.47% (Chart 1).
The steel and aluminum tariffs announced on Monday come just a week after Canada and Mexico were able to get a 30-day delay on the blanket 25% tariffs that were supposed to go into effect on February 1st. But unlike those tariffs, the administration has some historical precedence for the steel and aluminum tariffs, with President Trump having enacted similar measures back in 2018/19. For most countries, the previous tariffs had been lifted. However, this week’s announcement would reinstate the 25% tariff on steel and ups the tariff on aluminum to 25% (previously 10%), with no country exemptions.
The ratcheting up of trade tensions has come at particularly challenging time for policymakers, as the Fed’s fight to return price stability has hit a wall. The January CPI reading showed headline inflation rising at its fastest monthly pace in nearly a year and a half, while core inflation’s gain was the largest since March 2024 (Chart 2). Residual seasonality looks to be at least partially responsible for January’s uptick – as it was in the early months of last year. This appears to be a legacy issue stemming from the pandemic.
Historically, businesses tend to build in big price adjustments at the beginning of each year, which would normally be corrected for with appropriate seasonal factors. But during the COVID pandemic, firms were much faster to pass on price increases, distorting the seasonal patterns, and biasing the January inflation readings higher in recent years.
But it’s unlikely that residual seasonality is telling the whole story. Consumer spending remained incredibly strong through the second half of last year – averaging an impressive 3.6% annualized. Moreover, spending on both goods and services was very healthy in Q4, helping to explain the breadth of price pressures last month. While the January retail sales data point to a sharp slowing in spending, those figures were likely impacted by inclement weather and the California wildfires – suggesting some giveback in spending in February.
At this point, the Fed appears to have plenty of runway to maintain its current policy rate and wait for more clarity on the inflation front. This is unlikely to come with just the next few inflation readings, which means the Fed is on hold until at least the summer.
Summary 2/17 – 2/21
Monday, Feb 17, 2025
| GMT | Ccy | Events | Consensus | Previous |
|---|---|---|---|---|
| 21:30 | NZD | Business NZ PSI Jan | 47.9 | |
| 23:50 | JPY | GDP Q/Q Q4 P | 0.30% | 0.30% |
| 23:50 | JPY | GDP Deflator Y/Y Q4 P | 2.80% | 2.40% |
| 04:30 | JPY | Tertiary Industry Index M/M Dec | 0.20% | -0.30% |
| 04:30 | JPY | Industrial Production M/M Dec | 0.30% | 0.30% |
| 10:00 | EUR | Eurozone Trade Balance (EUR) Dec | 15.0B | 12.9B |
| 13:15 | CAD | Housing Starts Jan | 250K | 231K |
| GMT | Ccy | Events | |
|---|---|---|---|
| 21:30 | NZD | Business NZ PSI Jan | |
| Forecast: | Previous: 47.9 | ||
| 23:50 | JPY | GDP Q/Q Q4 P | |
| Forecast: 0.30% | Previous: 0.30% | ||
| 23:50 | JPY | GDP Deflator Y/Y Q4 P | |
| Forecast: 2.80% | Previous: 2.40% | ||
| 04:30 | JPY | Tertiary Industry Index M/M Dec | |
| Forecast: 0.20% | Previous: -0.30% | ||
| 04:30 | JPY | Industrial Production M/M Dec | |
| Forecast: 0.30% | Previous: 0.30% | ||
| 10:00 | EUR | Eurozone Trade Balance (EUR) Dec | |
| Forecast: 15.0B | Previous: 12.9B | ||
| 13:15 | CAD | Housing Starts Jan | |
| Forecast: 250K | Previous: 231K | ||
Tuesday, Feb 18, 2025
| GMT | Ccy | Events | Consensus | Previous |
|---|---|---|---|---|
| 03:30 | AUD | RBA Rate Decision | 4.10% | 4.35% |
| 07:00 | GBP | Claimant Count Change Jan | 10.0K | 0.7K |
| 07:00 | GBP | ILO Unemployment Rate (3M) Dec | 4.50% | 4.40% |
| 07:00 | GBP | Average Earnings Including Bonus 3M/Y Dec | 5.90% | 5.60% |
| 07:00 | GBP | Average Earnings Excluding Bonus 3M/Y Dec | 5.60% | |
| 10:00 | EUR | Germany ZEW Economic Sentiment Feb | 20.2 | 10.3 |
| 10:00 | EUR | Germany ZEW Current Situation Feb | -89 | -90.4 |
| 10:00 | EUR | Eurozone ZEW Economic Sentiment Feb | 25.4 | 18.0 |
| 13:30 | USD | Empire State Manufacturing Index Feb | -1 | -12.6 |
| 13:30 | CAD | CPI M/M Jan | 0.10% | -0.40% |
| 13:30 | CAD | CPI Y/Y Jan | 1.80% | |
| 13:30 | CAD | CPI Media Y/Y Jan | 2.40% | 2.40% |
| 13:30 | CAD | CPI Trimmed Y/Y Jan | 2.60% | 2.50% |
| 13:30 | CAD | CPI Common Y/Y Jan | 2.00% | 2.00% |
| 15:00 | USD | NAHB Housing Index Feb | 47 | 47 |
| 21:45 | NZD | PPI Input Q/Q Q4 | 1.90% | |
| 21:45 | NZD | PPI Output Q/Q Q4 | 1.50% | |
| 23:50 | JPY | Machinery Orders M/M Dec | 0.30% | 3.40% |
| 23:50 | JPY | Trade Balance (JPY) Jan | -0.24T | -0.03T |
| GMT | Ccy | Events | |
|---|---|---|---|
| 03:30 | AUD | RBA Rate Decision | |
| Forecast: 4.10% | Previous: 4.35% | ||
| 07:00 | GBP | Claimant Count Change Jan | |
| Forecast: 10.0K | Previous: 0.7K | ||
| 07:00 | GBP | ILO Unemployment Rate (3M) Dec | |
| Forecast: 4.50% | Previous: 4.40% | ||
| 07:00 | GBP | Average Earnings Including Bonus 3M/Y Dec | |
| Forecast: 5.90% | Previous: 5.60% | ||
| 07:00 | GBP | Average Earnings Excluding Bonus 3M/Y Dec | |
| Forecast: | Previous: 5.60% | ||
| 10:00 | EUR | Germany ZEW Economic Sentiment Feb | |
| Forecast: 20.2 | Previous: 10.3 | ||
| 10:00 | EUR | Germany ZEW Current Situation Feb | |
| Forecast: -89 | Previous: -90.4 | ||
| 10:00 | EUR | Eurozone ZEW Economic Sentiment Feb | |
| Forecast: 25.4 | Previous: 18.0 | ||
| 13:30 | USD | Empire State Manufacturing Index Feb | |
| Forecast: -1 | Previous: -12.6 | ||
| 13:30 | CAD | CPI M/M Jan | |
| Forecast: 0.10% | Previous: -0.40% | ||
| 13:30 | CAD | CPI Y/Y Jan | |
| Forecast: | Previous: 1.80% | ||
| 13:30 | CAD | CPI Media Y/Y Jan | |
| Forecast: 2.40% | Previous: 2.40% | ||
| 13:30 | CAD | CPI Trimmed Y/Y Jan | |
| Forecast: 2.60% | Previous: 2.50% | ||
| 13:30 | CAD | CPI Common Y/Y Jan | |
| Forecast: 2.00% | Previous: 2.00% | ||
| 15:00 | USD | NAHB Housing Index Feb | |
| Forecast: 47 | Previous: 47 | ||
| 21:45 | NZD | PPI Input Q/Q Q4 | |
| Forecast: | Previous: 1.90% | ||
| 21:45 | NZD | PPI Output Q/Q Q4 | |
| Forecast: | Previous: 1.50% | ||
| 23:50 | JPY | Machinery Orders M/M Dec | |
| Forecast: 0.30% | Previous: 3.40% | ||
| 23:50 | JPY | Trade Balance (JPY) Jan | |
| Forecast: -0.24T | Previous: -0.03T | ||
Wednesday, Feb 19, 2025
| GMT | Ccy | Events | Consensus | Previous |
|---|---|---|---|---|
| 00:30 | AUD | Wage Price Index Q/Q Q4 | 0.80% | 0.80% |
| 01:00 | NZD | RBNZ Rate Decision | 3.75% | 4.25% |
| 07:00 | GBP | CPI M/M Jan | 0.30% | |
| 07:00 | GBP | CPI Y/Y Jan | 2.80% | 2.50% |
| 07:00 | GBP | Core CPI Y/Y Jan | 3.70% | 3.20% |
| 07:00 | GBP | RPI M/M Jan | 0.30% | |
| 07:00 | GBP | RPI Y/Y Jan | 3.70% | 3.50% |
| 07:00 | GBP | PPI Input M/M Jan | 0.70% | 0.10% |
| 07:00 | GBP | PPI Input Y/Y Jan | -1.50% | |
| 07:00 | GBP | PPI Output M/M Jan | 0.20% | 0.10% |
| 07:00 | GBP | PPI Output Y/Y Jan | 0.10% | |
| 07:00 | GBP | PPI Core Output M/M Jan | 0% | |
| 07:00 | GBP | PPI Core Output Y/Y Jan | 1.50% | |
| 09:00 | EUR | Eurozone Current Account (EUR) Dec | 30.2B | 27.0B |
| 13:30 | USD | Building Permits Jan | 1.45M | 1.48M |
| 13:30 | USD | Housing Starts Jan | 1.39M | 1.50M |
| 19:00 | USD | FOMC Minutes |
| GMT | Ccy | Events | |
|---|---|---|---|
| 00:30 | AUD | Wage Price Index Q/Q Q4 | |
| Forecast: 0.80% | Previous: 0.80% | ||
| 01:00 | NZD | RBNZ Rate Decision | |
| Forecast: 3.75% | Previous: 4.25% | ||
| 07:00 | GBP | CPI M/M Jan | |
| Forecast: | Previous: 0.30% | ||
| 07:00 | GBP | CPI Y/Y Jan | |
| Forecast: 2.80% | Previous: 2.50% | ||
| 07:00 | GBP | Core CPI Y/Y Jan | |
| Forecast: 3.70% | Previous: 3.20% | ||
| 07:00 | GBP | RPI M/M Jan | |
| Forecast: | Previous: 0.30% | ||
| 07:00 | GBP | RPI Y/Y Jan | |
| Forecast: 3.70% | Previous: 3.50% | ||
| 07:00 | GBP | PPI Input M/M Jan | |
| Forecast: 0.70% | Previous: 0.10% | ||
| 07:00 | GBP | PPI Input Y/Y Jan | |
| Forecast: | Previous: -1.50% | ||
| 07:00 | GBP | PPI Output M/M Jan | |
| Forecast: 0.20% | Previous: 0.10% | ||
| 07:00 | GBP | PPI Output Y/Y Jan | |
| Forecast: | Previous: 0.10% | ||
| 07:00 | GBP | PPI Core Output M/M Jan | |
| Forecast: | Previous: 0% | ||
| 07:00 | GBP | PPI Core Output Y/Y Jan | |
| Forecast: | Previous: 1.50% | ||
| 09:00 | EUR | Eurozone Current Account (EUR) Dec | |
| Forecast: 30.2B | Previous: 27.0B | ||
| 13:30 | USD | Building Permits Jan | |
| Forecast: 1.45M | Previous: 1.48M | ||
| 13:30 | USD | Housing Starts Jan | |
| Forecast: 1.39M | Previous: 1.50M | ||
| 19:00 | USD | FOMC Minutes | |
| Forecast: | Previous: | ||
Thursday, Feb 20, 2025
| GMT | Ccy | Events | Consensus | Previous |
|---|---|---|---|---|
| 00:30 | AUD | Employment Change Jan | 20.0K | 56.3K |
| 00:30 | AUD | Unemployment Rate Jan | 4.10% | 4.00% |
| 01:00 | CNY | 1-Y Loan Prime Rate | 3.10% | |
| 01:00 | CNY | 5-Y Loan Prime Rate | 3.60% | |
| 07:00 | CHF | Trade Balance (CHF) Jan | 3.55B | 3.49B |
| 07:00 | EUR | Germany PPI M/M Jan | 0.60% | -0.10% |
| 07:00 | EUR | Germany PPI Y/Y Jan | 0.80% | |
| 13:30 | CAD | Industrial Product Price M/M Jan | 0.20% | |
| 13:30 | CAD | Raw Material Price Index Jan | 1.30% | |
| 13:30 | CAD | New Housing Price Index M/M Jan | -0.10% | |
| 13:30 | USD | Initial Jobless Claims (Feb 14) | 216K | 213K |
| 13:30 | USD | Philadelphia Fed Manufacturing Survey Feb | 25.5 | 44.3 |
| 15:00 | EUR | Eurozone Consumer Confidence Feb P | -14 | -14 |
| 15:30 | USD | Natural Gas Storage | -100B | |
| 16:00 | USD | Crude Oil Inventories | 4.1M | |
| 21:45 | NZD | Trade Balance (NZD) Jan | 225M | 219M |
| 22:00 | AUD | Manufacturing PMI Feb P | 50.2 | |
| 22:00 | AUD | Services PMI Feb P | 51.2 | |
| 23:50 | JPY | CPI Y/Y Jan | 3.60% | |
| 23:50 | JPY | CPI Core Y/Y Jan | 3.10% | 3.00% |
| 23:50 | JPY | CPI Core-Core Y/Y Jan | 2.40% |
| GMT | Ccy | Events | |
|---|---|---|---|
| 00:30 | AUD | Employment Change Jan | |
| Forecast: 20.0K | Previous: 56.3K | ||
| 00:30 | AUD | Unemployment Rate Jan | |
| Forecast: 4.10% | Previous: 4.00% | ||
| 01:00 | CNY | 1-Y Loan Prime Rate | |
| Forecast: | Previous: 3.10% | ||
| 01:00 | CNY | 5-Y Loan Prime Rate | |
| Forecast: | Previous: 3.60% | ||
| 07:00 | CHF | Trade Balance (CHF) Jan | |
| Forecast: 3.55B | Previous: 3.49B | ||
| 07:00 | EUR | Germany PPI M/M Jan | |
| Forecast: 0.60% | Previous: -0.10% | ||
| 07:00 | EUR | Germany PPI Y/Y Jan | |
| Forecast: | Previous: 0.80% | ||
| 13:30 | CAD | Industrial Product Price M/M Jan | |
| Forecast: | Previous: 0.20% | ||
| 13:30 | CAD | Raw Material Price Index Jan | |
| Forecast: | Previous: 1.30% | ||
| 13:30 | CAD | New Housing Price Index M/M Jan | |
| Forecast: | Previous: -0.10% | ||
| 13:30 | USD | Initial Jobless Claims (Feb 14) | |
| Forecast: 216K | Previous: 213K | ||
| 13:30 | USD | Philadelphia Fed Manufacturing Survey Feb | |
| Forecast: 25.5 | Previous: 44.3 | ||
| 15:00 | EUR | Eurozone Consumer Confidence Feb P | |
| Forecast: -14 | Previous: -14 | ||
| 15:30 | USD | Natural Gas Storage | |
| Forecast: | Previous: -100B | ||
| 16:00 | USD | Crude Oil Inventories | |
| Forecast: | Previous: 4.1M | ||
| 21:45 | NZD | Trade Balance (NZD) Jan | |
| Forecast: 225M | Previous: 219M | ||
| 22:00 | AUD | Manufacturing PMI Feb P | |
| Forecast: | Previous: 50.2 | ||
| 22:00 | AUD | Services PMI Feb P | |
| Forecast: | Previous: 51.2 | ||
| 23:50 | JPY | CPI Y/Y Jan | |
| Forecast: | Previous: 3.60% | ||
| 23:50 | JPY | CPI Core Y/Y Jan | |
| Forecast: 3.10% | Previous: 3.00% | ||
| 23:50 | JPY | CPI Core-Core Y/Y Jan | |
| Forecast: | Previous: 2.40% | ||
Friday, Feb 21, 2025
| GMT | Ccy | Events | Consensus | Previous |
|---|---|---|---|---|
| 00:01 | GBP | GfK Consumer Confidence Feb | -22 | -22 |
| 00:30 | JPY | Manufacturing PMI Feb P | 49 | 48.7 |
| 00:30 | JPY | Services PMI Feb P | 53 | |
| 07:00 | GBP | Retail Sales M/M Jan | 0.30% | -0.30% |
| 07:00 | GBP | Public Sector Net Borrowing (GBP) Jan | -20.5B | 17.8B |
| 08:15 | EUR | France Manufacturing PMI Feb P | 45.3 | 45.0 |
| 08:15 | EUR | France Services PMI Feb P | 49 | 48.2 |
| 08:30 | EUR | Germany Manufacturing PMI Feb P | 45.6 | 45 |
| 08:30 | EUR | Germany Services PMI Feb P | 52.6 | 52.5 |
| 09:00 | EUR | Eurozone Manufacturing PMI Feb P | 47.1 | 46.6 |
| 09:00 | EUR | Eurozone Services PMI Feb P | 51.5 | 51.3 |
| 09:30 | GBP | Manufacturing PMI Feb P | 48.5 | 48.3 |
| 09:30 | GBP | Services PMI Feb P | 51 | 50.9 |
| 13:30 | CAD | Retail Sales M/M Dec | 1.60% | 0% |
| 13:30 | CAD | Retail Sales ex Autos M/M Dec | 0.40% | -0.70% |
| 14:45 | USD | Manufacturing PMI Feb P | 51.2 | |
| 14:45 | USD | Services PMI Feb P | 52.9 | |
| 15:00 | USD | Existing Home Sales M/M Jan | 4.17M | 4.24M |
| 15:00 | USD | Michigan Consumer Sentiment Index Jan F | 67.8 | 67.8 |
| GMT | Ccy | Events | |
|---|---|---|---|
| 00:01 | GBP | GfK Consumer Confidence Feb | |
| Forecast: -22 | Previous: -22 | ||
| 00:30 | JPY | Manufacturing PMI Feb P | |
| Forecast: 49 | Previous: 48.7 | ||
| 00:30 | JPY | Services PMI Feb P | |
| Forecast: | Previous: 53 | ||
| 07:00 | GBP | Retail Sales M/M Jan | |
| Forecast: 0.30% | Previous: -0.30% | ||
| 07:00 | GBP | Public Sector Net Borrowing (GBP) Jan | |
| Forecast: -20.5B | Previous: 17.8B | ||
| 08:15 | EUR | France Manufacturing PMI Feb P | |
| Forecast: 45.3 | Previous: 45.0 | ||
| 08:15 | EUR | France Services PMI Feb P | |
| Forecast: 49 | Previous: 48.2 | ||
| 08:30 | EUR | Germany Manufacturing PMI Feb P | |
| Forecast: 45.6 | Previous: 45 | ||
| 08:30 | EUR | Germany Services PMI Feb P | |
| Forecast: 52.6 | Previous: 52.5 | ||
| 09:00 | EUR | Eurozone Manufacturing PMI Feb P | |
| Forecast: 47.1 | Previous: 46.6 | ||
| 09:00 | EUR | Eurozone Services PMI Feb P | |
| Forecast: 51.5 | Previous: 51.3 | ||
| 09:30 | GBP | Manufacturing PMI Feb P | |
| Forecast: 48.5 | Previous: 48.3 | ||
| 09:30 | GBP | Services PMI Feb P | |
| Forecast: 51 | Previous: 50.9 | ||
| 13:30 | CAD | Retail Sales M/M Dec | |
| Forecast: 1.60% | Previous: 0% | ||
| 13:30 | CAD | Retail Sales ex Autos M/M Dec | |
| Forecast: 0.40% | Previous: -0.70% | ||
| 14:45 | USD | Manufacturing PMI Feb P | |
| Forecast: | Previous: 51.2 | ||
| 14:45 | USD | Services PMI Feb P | |
| Forecast: | Previous: 52.9 | ||
| 15:00 | USD | Existing Home Sales M/M Jan | |
| Forecast: 4.17M | Previous: 4.24M | ||
| 15:00 | USD | Michigan Consumer Sentiment Index Jan F | |
| Forecast: 67.8 | Previous: 67.8 | ||