
Sample Category Title
What Next: RBA and RBNZ Rates and Flash PMIs
In the coming week, the key scheduled macroeconomic events include rate decisions in Australia and New Zealand, Canadian inflation data, and Flash PMIs for Europe.
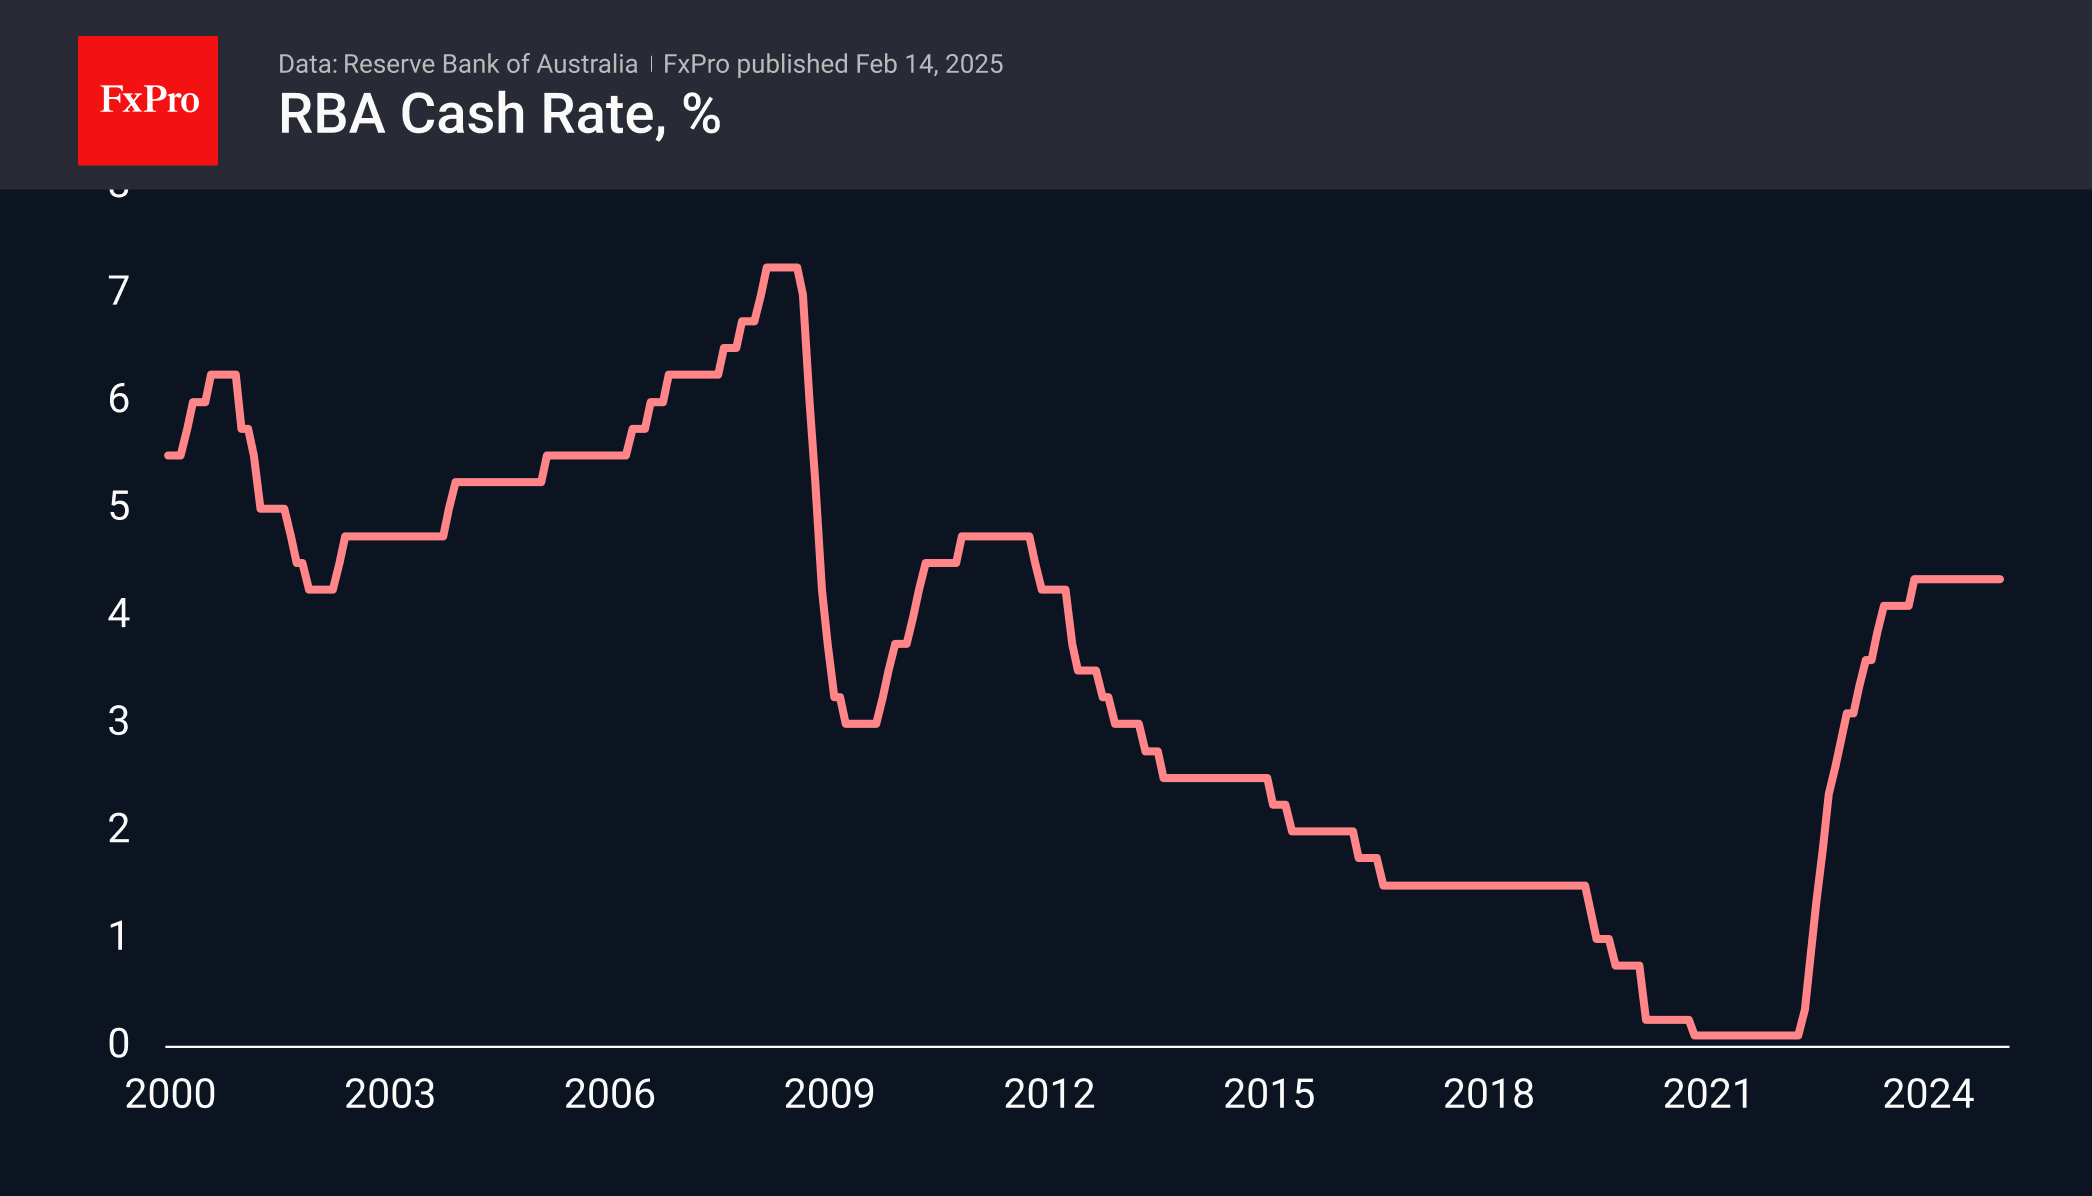
On February 18th, the Reserve Bank of Australia (RBA) is expected to cut the key rate for the first time in this monetary cycle. Australia has been less aggressive in raising rates and is now cutting them somewhat belatedly. The AUDUSD struggled at the end of the year, but the RBA’s decision could significantly impact this trend.
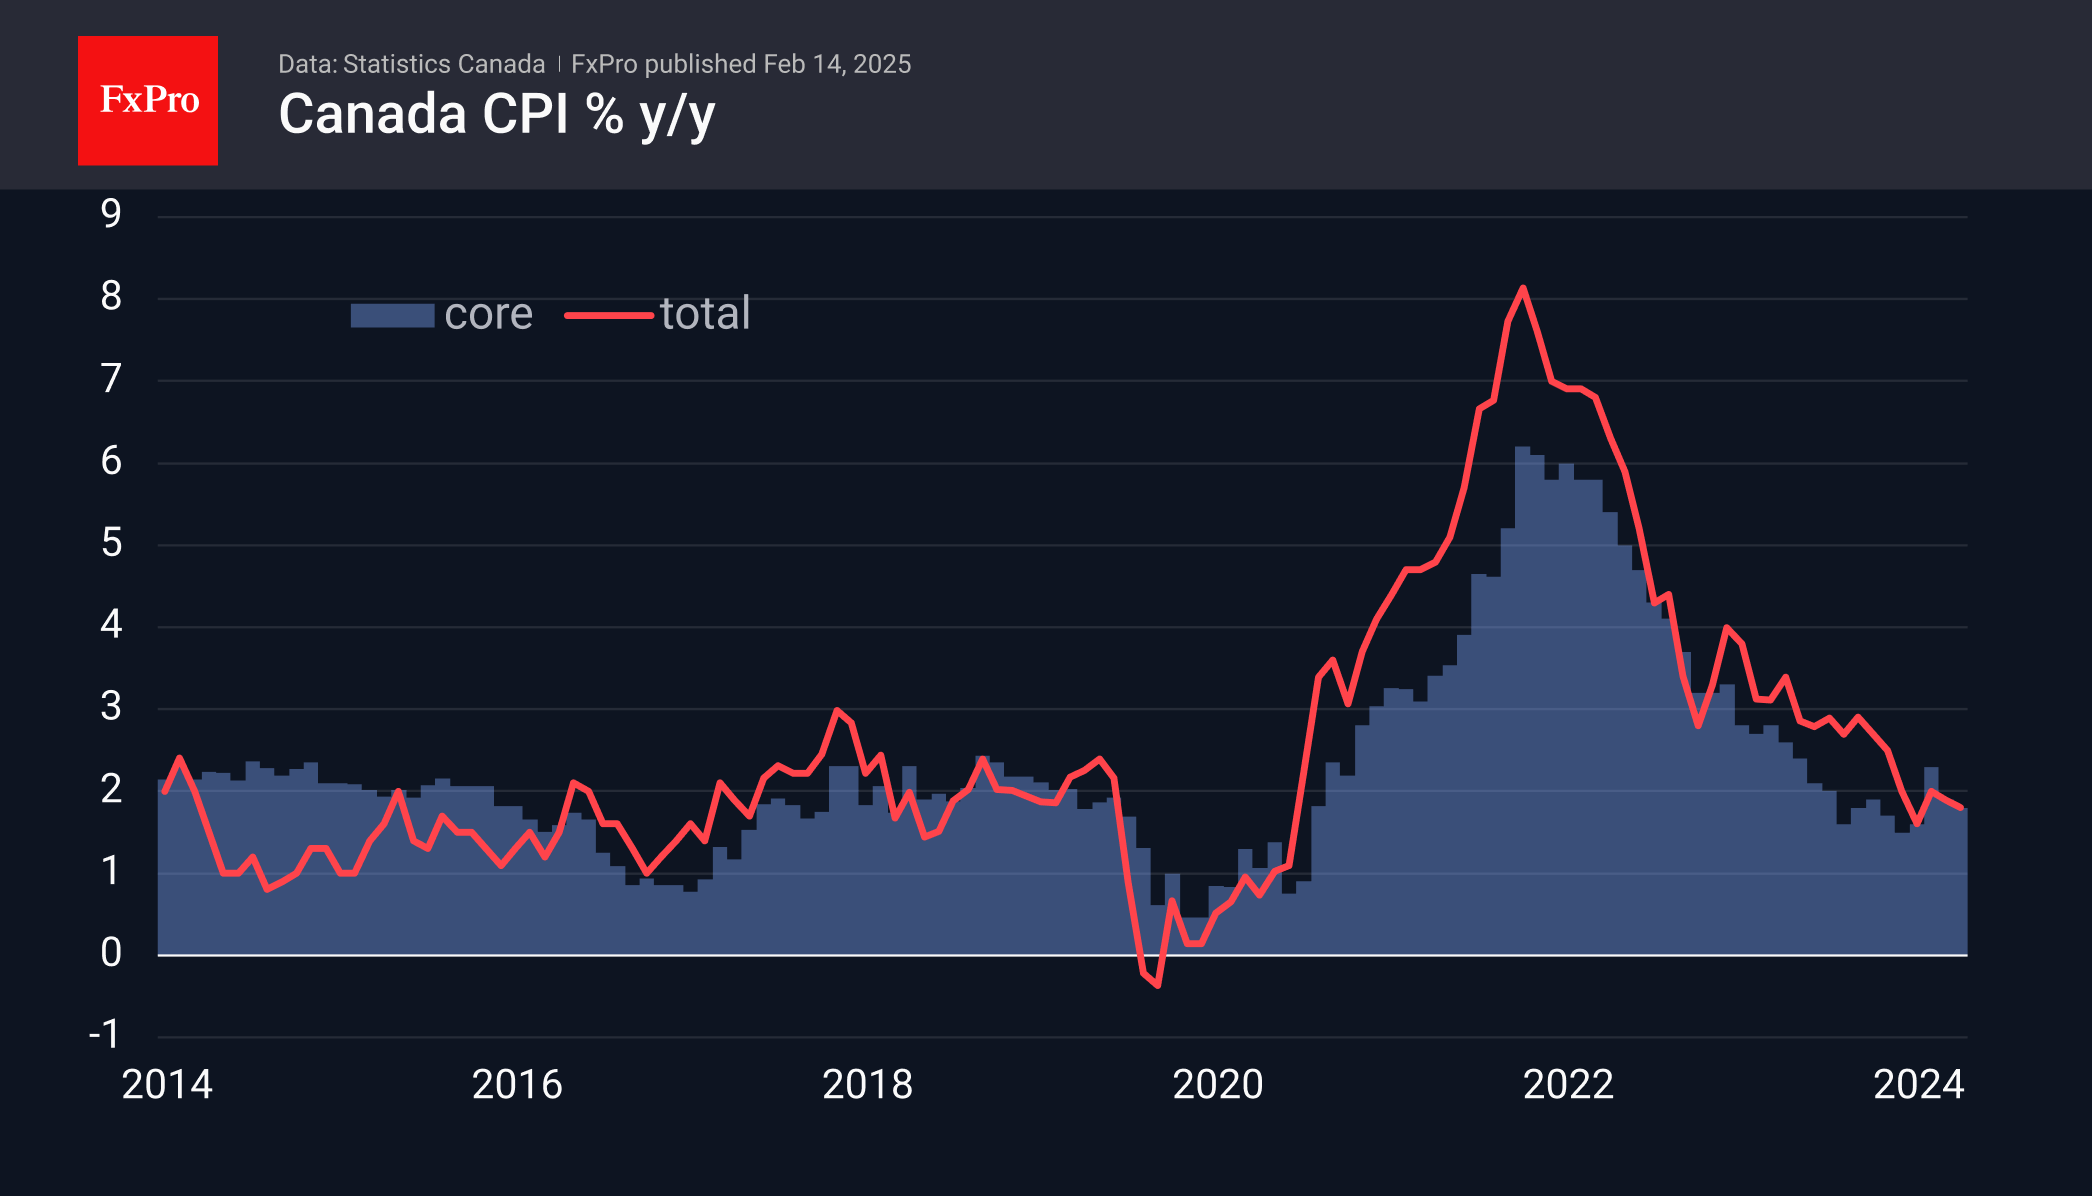
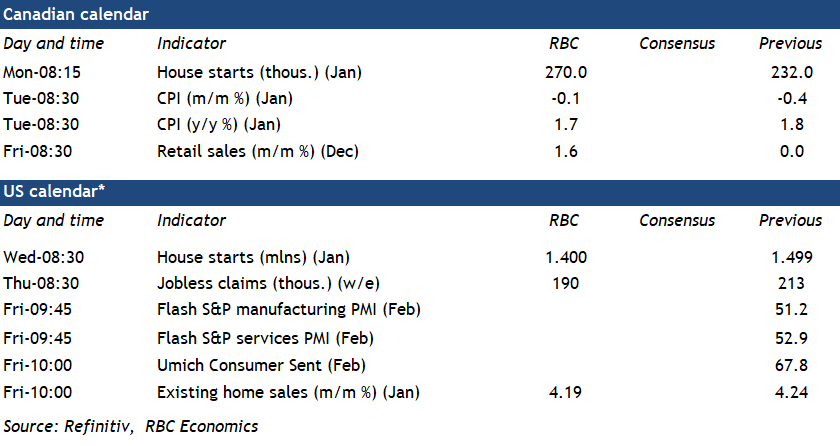
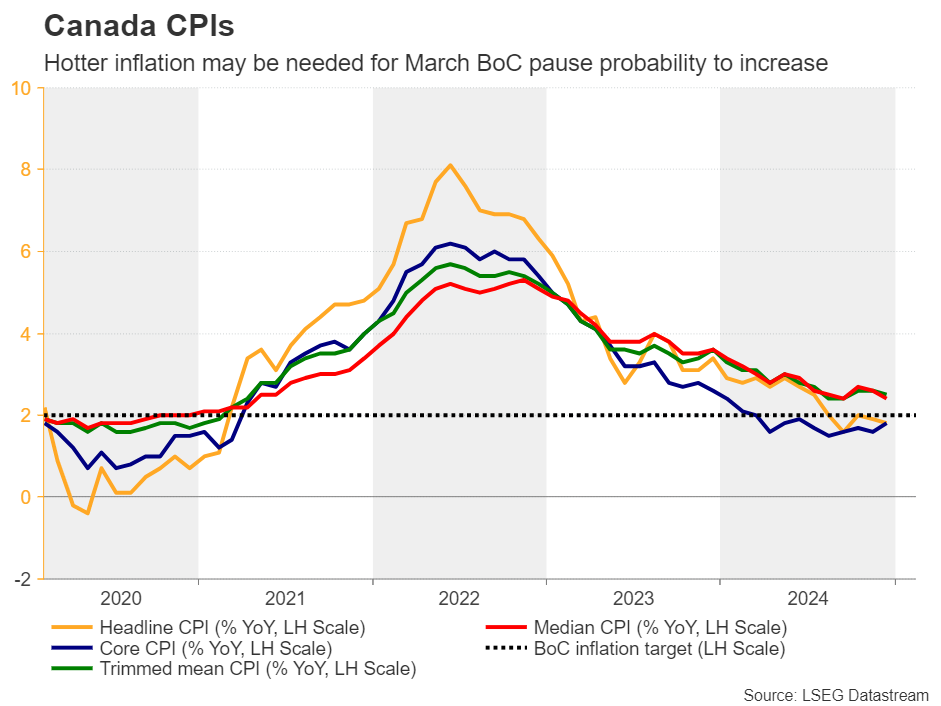
On Tuesday afternoon, Canadian consumer inflation data will be released. Inflation has hovered just above 2% in recent months but may increase due to the depreciating CAD and accelerating US inflation.
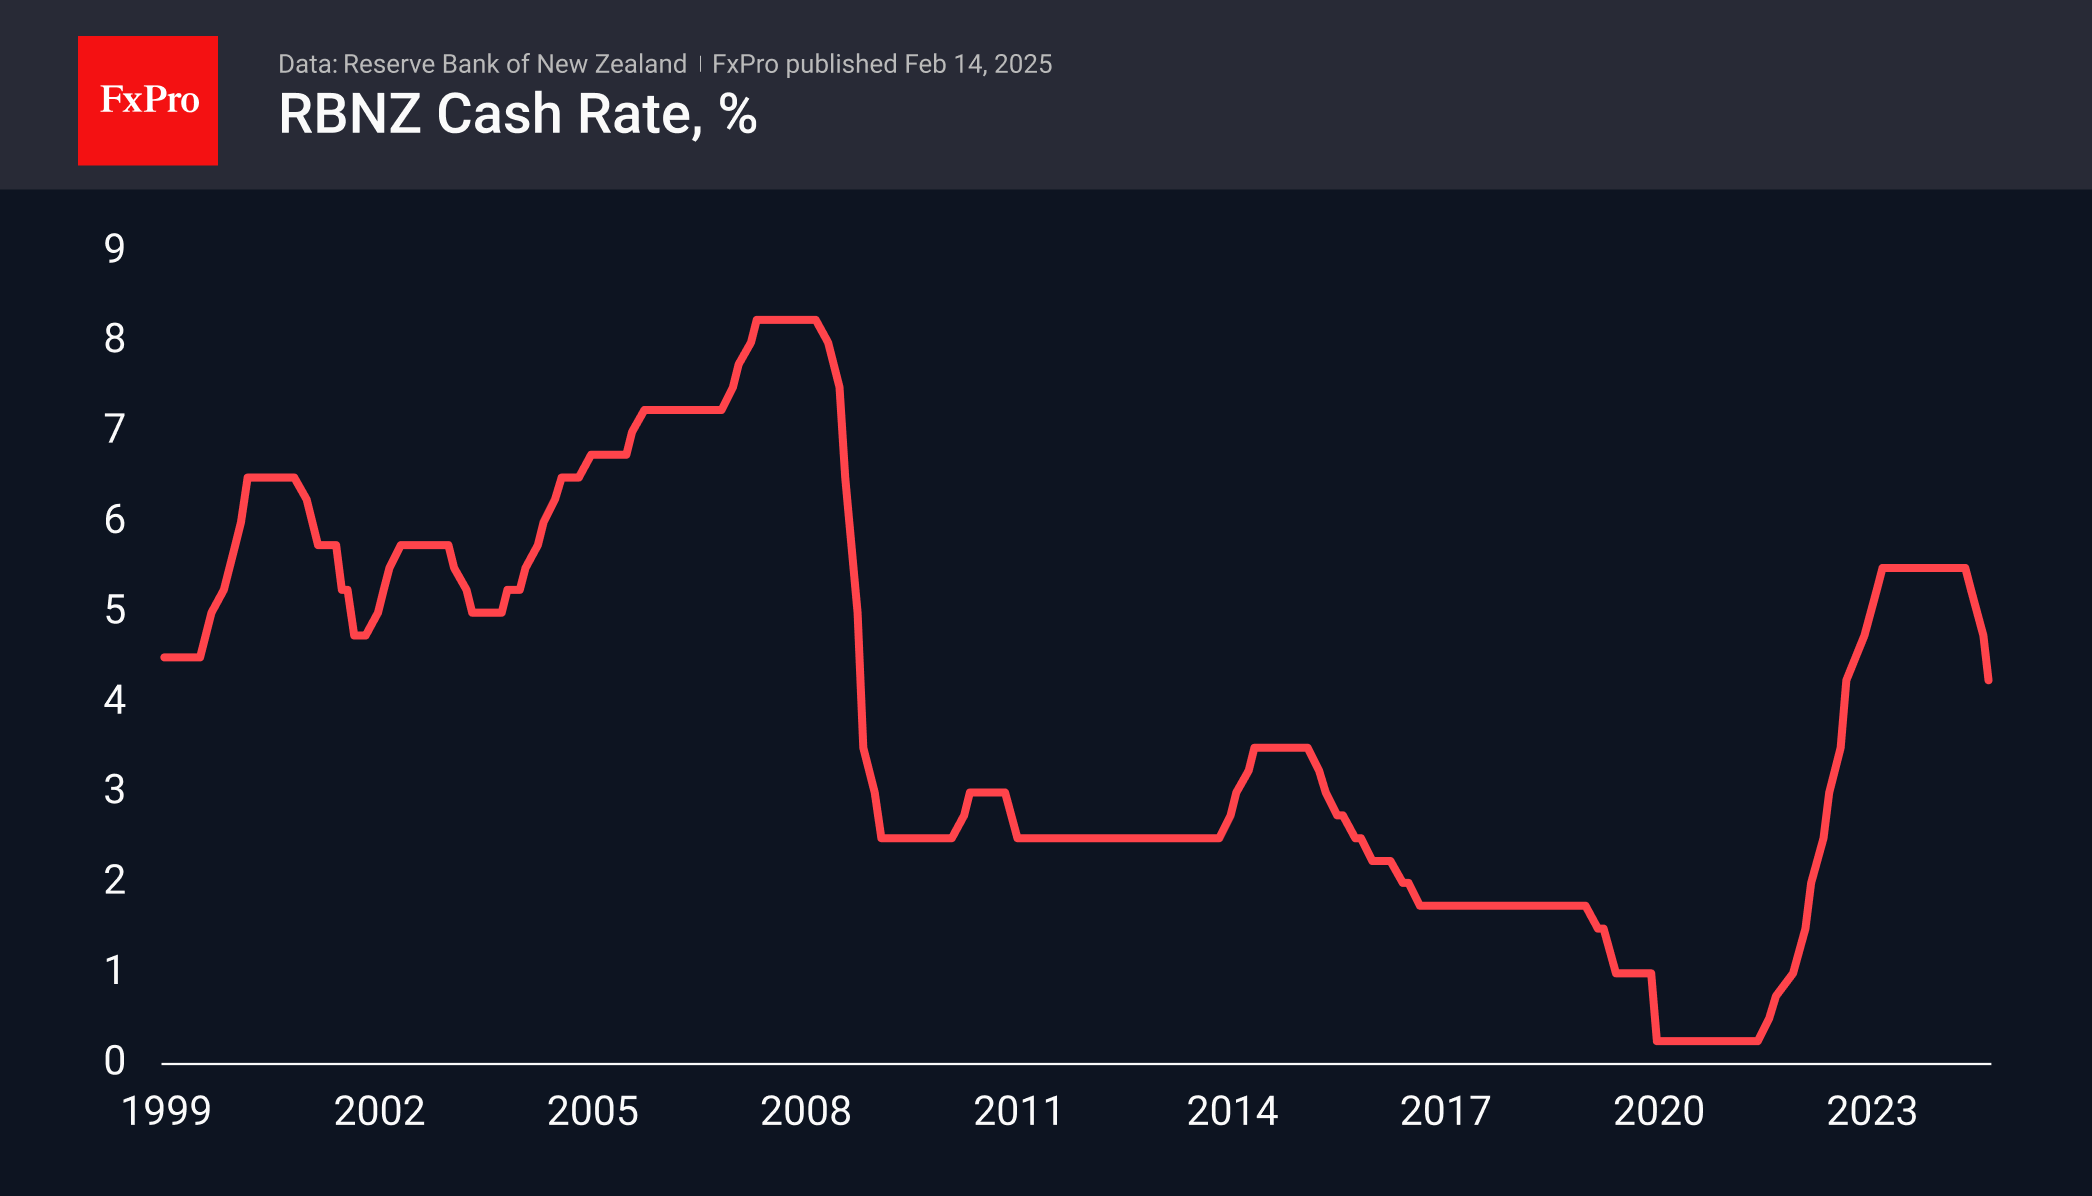
The Reserve Bank of New Zealand will announce its rate decision on February 19th. Having already cut rates by 125 basis points, it may choose to pause and assess the economic landscape.
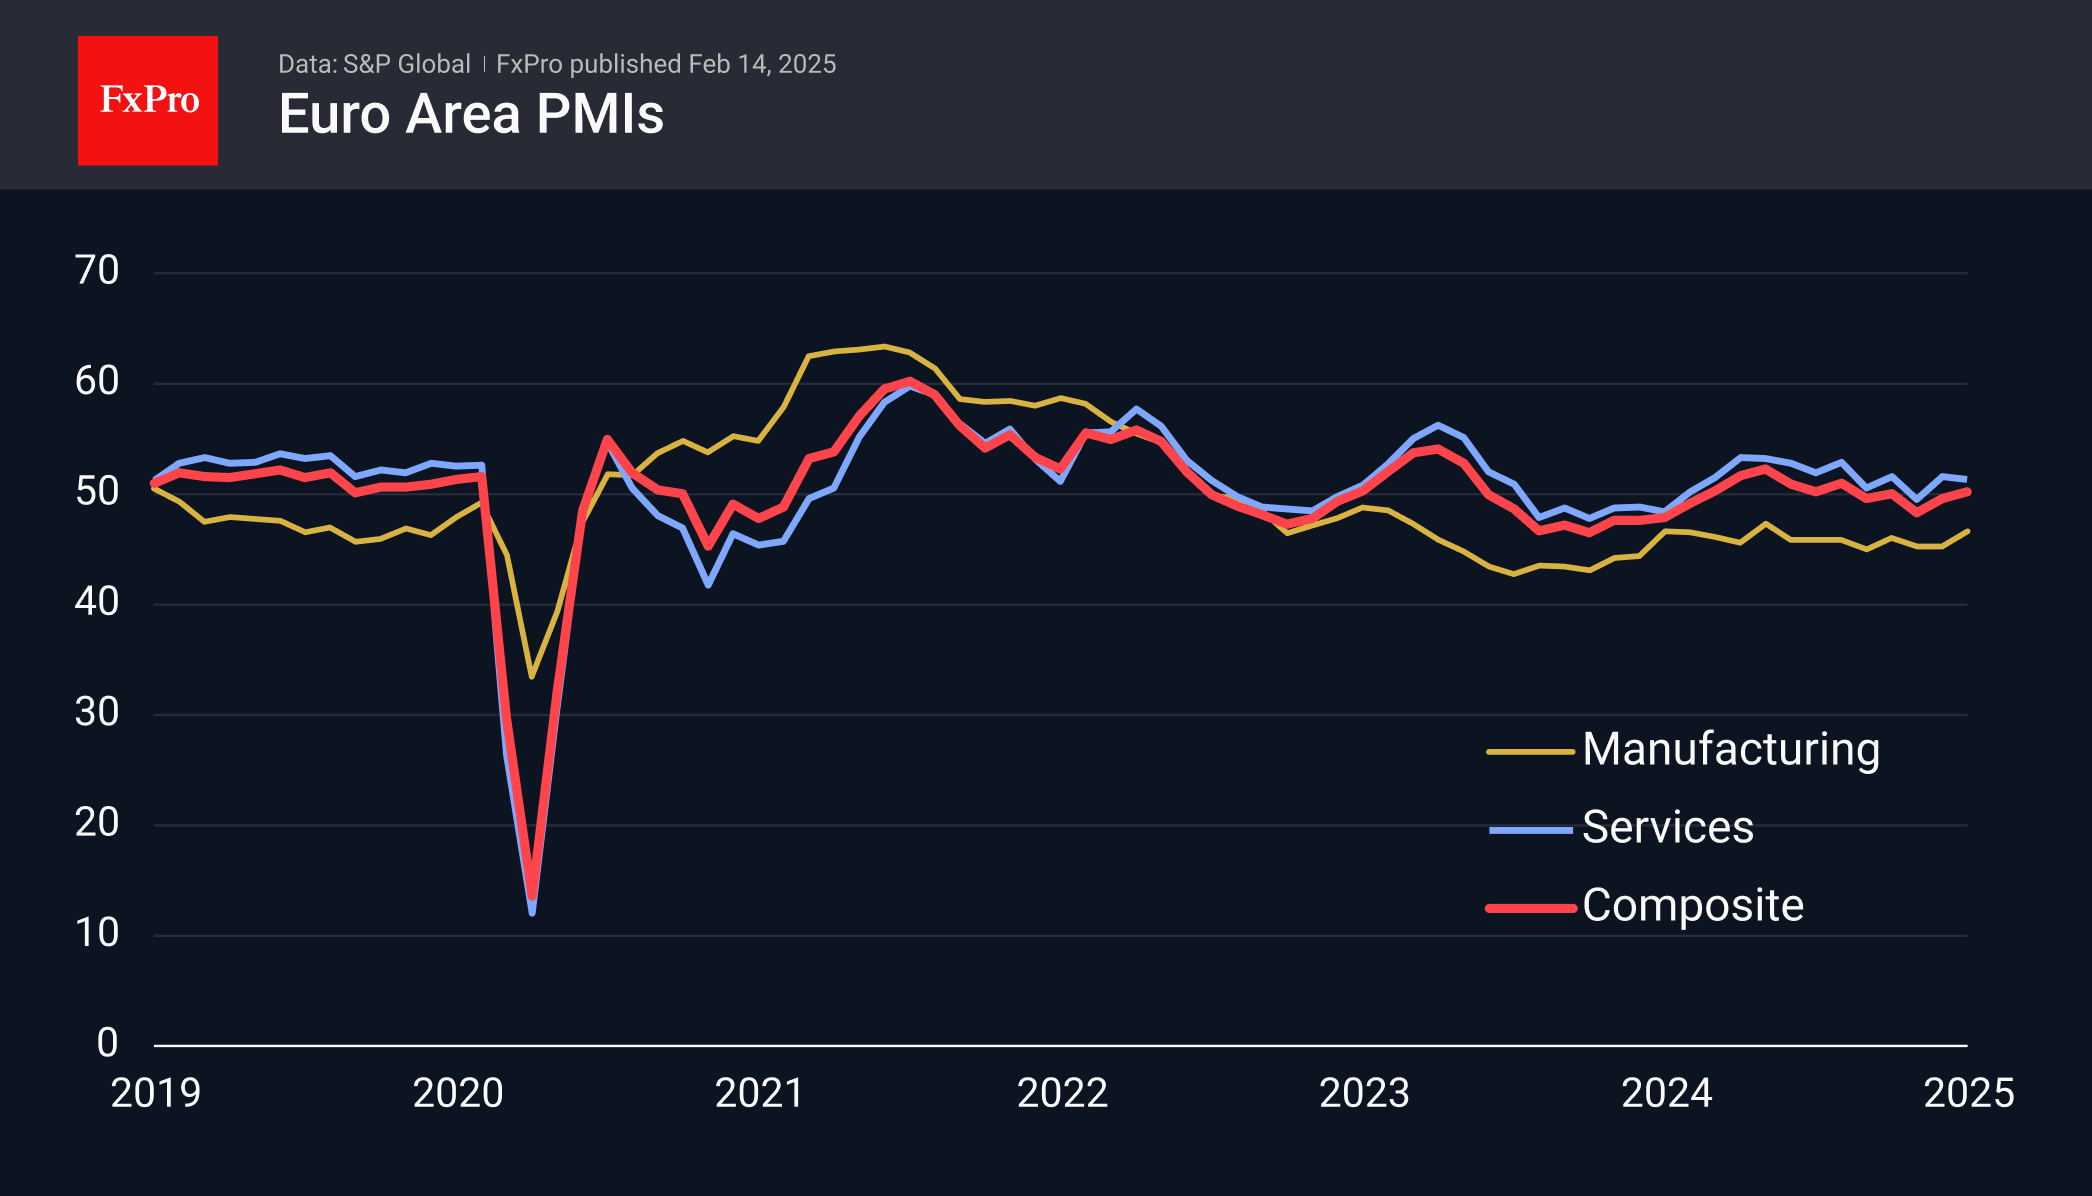
On February 21st, European session trading will be influenced by Flash PMI estimates. Recent data hinted at improving sentiment. Confirmation in the latest batch of data could encourage euro buyers.
Weekly Economic & Financial Commentary: FOMC in No Hurry
Summary
United States: FOMC in No Hurry
- A hot reading on the CPI to start 2025 amplified worries that progress in getting inflation back to target has stalled out as new risks arrive from changing trade policy. Meanwhile, retail sales unexpectedly plunged in January, suggesting consumers tightened their belts to start the year.
- Next week: Housing Starts (Wed.), Existing Home Sales (Fri)
International: Global Economic Activity and Price Data Are in the Air
- This week saw the release of economic activity and price data across advanced and emerging economies. In the United Kingdom, fourth quarter GDP growth figures were somewhat underwhelming. In Norway, the economy slowed at the end of last year, and while inflation came in a touch higher than expected, we still look for Norges Bank to initiate its easing cycle in March. The Swiss CPI report was somewhat mixed, and although Brazil inflation eased a touch, it remains elevated, and we look for further Brazilian Central Bank tightening this year.
- Next week: Japan GDP (Mon.), Reserve Bank of Australia Policy Rate (Tue.), Eurozone PMIs (Fri.)
Interest Rate Watch: Mortgage Rates Likely Will Remain Elevated
- We did not make any meaningful changes to the interest rate forecasts we published this week. We believe the 30-year fixed rate mortgage will remain elevated for as far as the eye can see, which will continue to exert headwinds on the housing market.
Topic of the Week: The Rising Tide of Employment Among Black Men
- In commemoration of Black History Month 2025, we focus on recent labor market developments in the Black & African American community. We find that Black & African Americans have made meaningful economic progress over the past five years, resulting in higher labor force participation, employment and earnings.
Canada’s Headline Inflation Growth to Slow Again on Tax Holiday
Canada’s January inflation data will continue to be distorted by the temporary GST/HST tax holiday running from mid-December to mid-February. The drop in taxes lowered price growth by about 0.4% in December, slowing to 1.8% year-over-year in December from 1.9% in November. It would have ticked up to 2.2% without the temporary tax reduction.
We expect annual price growth (including the tax change) to edge down to 1.7% in January, with the slowing again entirely due to the change in taxes. The tax holiday will continue to muddy inflation readings until March when we can get a cleaner read of the consumer price index that are clear of distortions.
Still, the Bank of Canada will be focused on their preferred “core” CPI measures, which exclude the impact of indirect taxes, for clues on how underlying inflation trends are shaping up. Recent readings have surprised to the upside. In December, the CPI trim and median measures grew by an average 0.3% month-over-month—matching the rate in the previous two months, but with a monthly pace still above the 2% target on an annual basis.
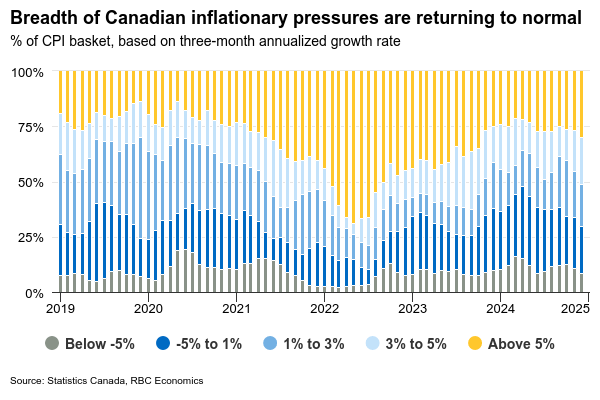
Annual rates for the median and trim measures are likely to move higher again in January, we expect to 2.6% from 2.5% in December. The better news is the scope of inflation pressures has not widened significantly. By our count, the share of consumer goods and services (outside of shelter) seeing elevated price growth at the end of 2024 was not meaningfully different from where it was at the start of the year.
Overall price growth continues to be disproportionately impacted by high growth in mortgage interest costs (accounting for 30% of annual CPI growth in December), which will continue to slow as the lagged impact of BoC interest rate cuts filters through to mortgage renewals. The core measures are, by design, less impacted by unusual movements in any one subcomponent, but still would have been running right around the BoC’s 2% inflation target if mortgage interest costs were not included in the calculations.
Moving forward, we continue to expect a soft domestic demand backdrop will allow for more unwinding in inflation this year. The labour markets have shown signs of stabilization, but lower job openings combined with a higher unemployment rate have started to push wage growth significantly lower. Trade uncertainties are clouding that outlook. But given announced targeted measures , we continue to look for an overall muted impact on growth and inflation, and expect past interest rate cuts will help with a turnaround in activity as soon as the second half of this year.
Week ahead data watch
In line with StatCan’s prelim estimate, we expect Canadian retail sales rose by 1.6% in December as holiday spending got a boost from the Federal tax holiday. In January, there were signs that spending was pared back. Unit auto sales were also weaker in the same month – we expect the advance estimate will show slower spending at the start of 2025.
Week Ahead – Fed Minutes, RBA and RBNZ Decisions in Focus
- After Powell and CPI data, dollar traders turn to Fed minutes.
- RBA to cut rates by 25bps, focus on forward guidance.
- RBNZ may opt for a third consecutive 50bps rate cut.
- UK, Canadian and Japan’s CPI data also in focus.
Will the minutes confirm hawkish Fed bets?
The US dollar started the week on a strong footing after Trump announced 25% tariffs on steel and aluminum imported to the US and signaled his intention for “reciprocal tariffs” on every nation that imposes duties on the US. Then, while testifying before Congress, Fed Chair Powell reiterated the message that the Fed is no rush to further lower interest rates, while on Wednesday, the US CPI data revealed that inflation was stickier-than-expected in January, allowing for some further strength.
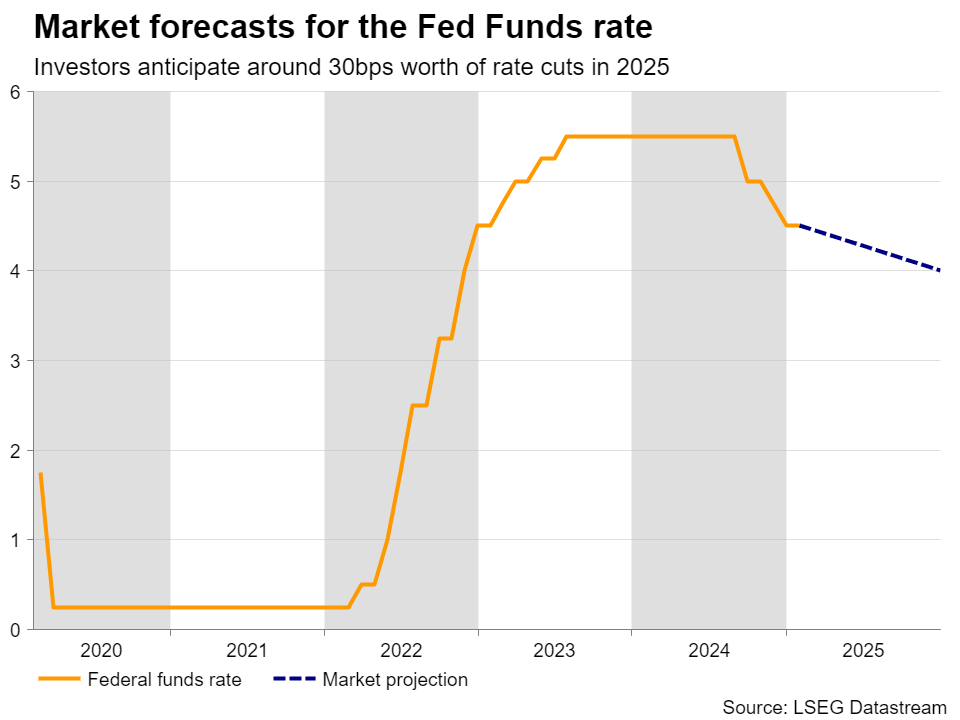
Even though the greenback pulled back on Thursday and Friday, all these developments came on top of a strong NFP report for January and thus prompted investors to price in only 30bps worth of rate reductions this year, a more hawkish view than the Fed’s own projection of 50bps cuts. In other words, traders are fully pricing in only one quarter-point cut by December.
With that in mind, investors may pay extra attention to the minutes of the latest FOMC decision, due out on Wednesday. Although the aforementioned events occurred after the meeting, traders may be eager to scan the report for clues and hints on how willing policymakers were to reconsider their policy path should upside risks to inflation increase. A hawkish flavor could benefit the US dollar and send Treasury yields higher, while hurting equities due to concerns about higher borrowing costs for longer.
A set of robust flash S&P PMIs for February on Friday could add more credence to that view.
RBA to begin its easing cycle
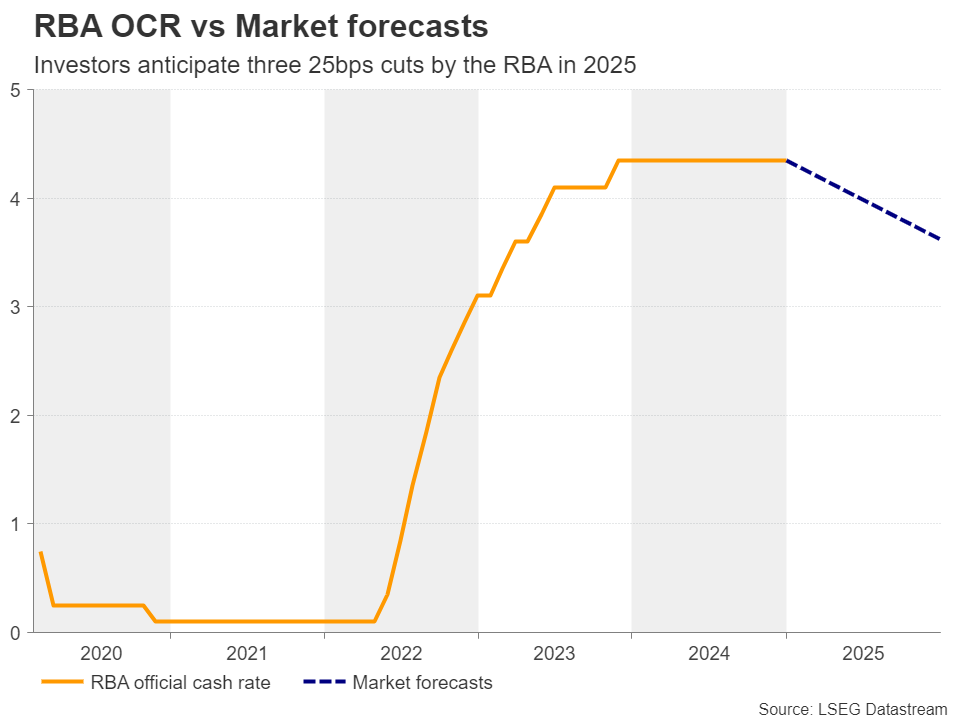
On Tuesday, the RBA will announce its first monetary policy decision for 2025. At its last meeting for 2024, the Reserve Bank of Australia decided to leave its cash rate target unchanged at 4.35%, noting that longer-term inflation expectations have been consistent with the inflation target and that the Board is gaining confidence that inflation is moving sustainably towards their objective.
And all this was even before Trump’s inauguration and the imposition of tariffs on China, Australia’s main trading partner, as well as duties on steel and aluminum coming to the US from any nation. Steel is made by mixing carbon and iron, and iron ore is Australia’s top export. Aluminum is also one of Australia’s top 20 exporting materials.
Combined with the further slowdown in the CPI data for Q4, concerns about how tariffs could impact the Australian economy prompted investors to factor in nearly three quarter-point cuts for this year, with the first one largely expected at this gathering. Specifically, traders are assigning an 80% chance of a reduction now, and thus, a rate cut on its own is unlikely to shake the aussie much.
This will be the Bank’s first reduction in this cycle and thus, investors may be eager to find out how policymakers are planning to move thereafter. Anything suggesting that the RBA may embark on an easing cycle more aggressively than investors are currently expecting could weigh on the aussie, while the opposite may be true if officials maintain data dependency, without providing clear signals about their way forward.
RBNZ: To cut by 50 or 25bps?
On Wednesday, the central bank torch will be passed to the RBNZ. In contrast to the RBA, the RBNZ has already cut interest rates three times, with the latest two decisions being 50bps worth of reductions.
The prior meeting was held on November 27 and since then, GDP data revealed that New Zealand fell into deep recession in Q3, contracting 1% qoq after shrinking 1.1% in Q2. On top of that, the year-on-year CPI rate for Q4 held steady at 2.2%, very close to the midpoint of the RBNZ’s 1-3% target range, while the unemployment rate rose to 5.1% from 4.8% and the Labor Cost Index for the same quarter slowed to 2.9% y/y from 3.4%.
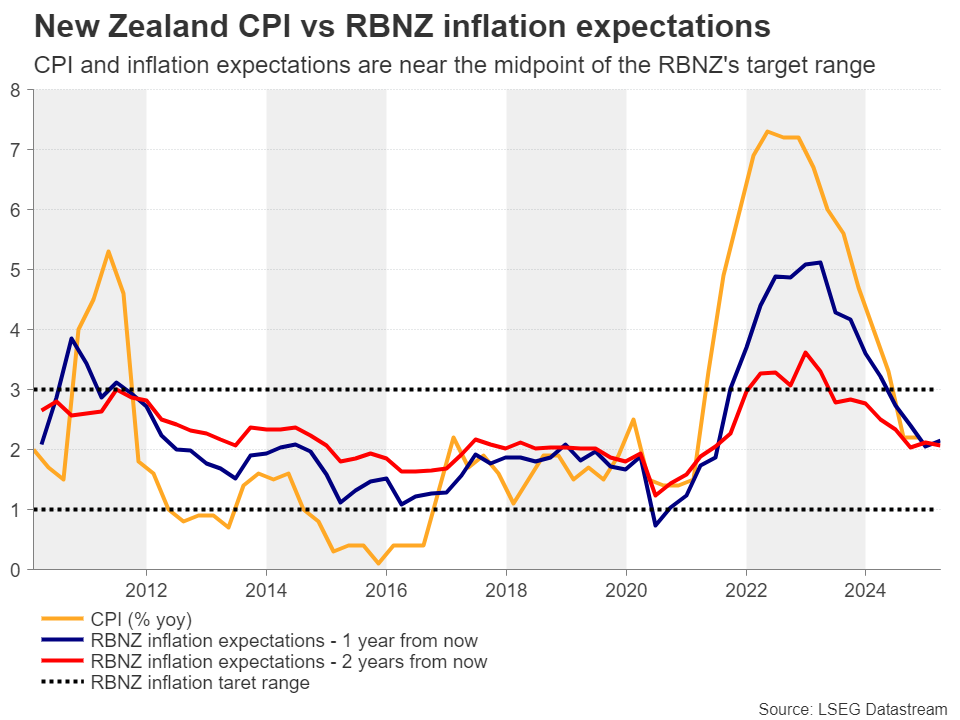
All these numbers prompted investors to scale up their rate cut bets. They are currently anticipating 110bps worth of rate cuts this year, while they are split on whether the Bank should proceed with another 50bps reduction at this gathering or slow the pace to 25bps. Ergo, another bold move and signals that there is more easing to come could hurt the kiwi, which may continue to underperform even against its Australian counterpart.
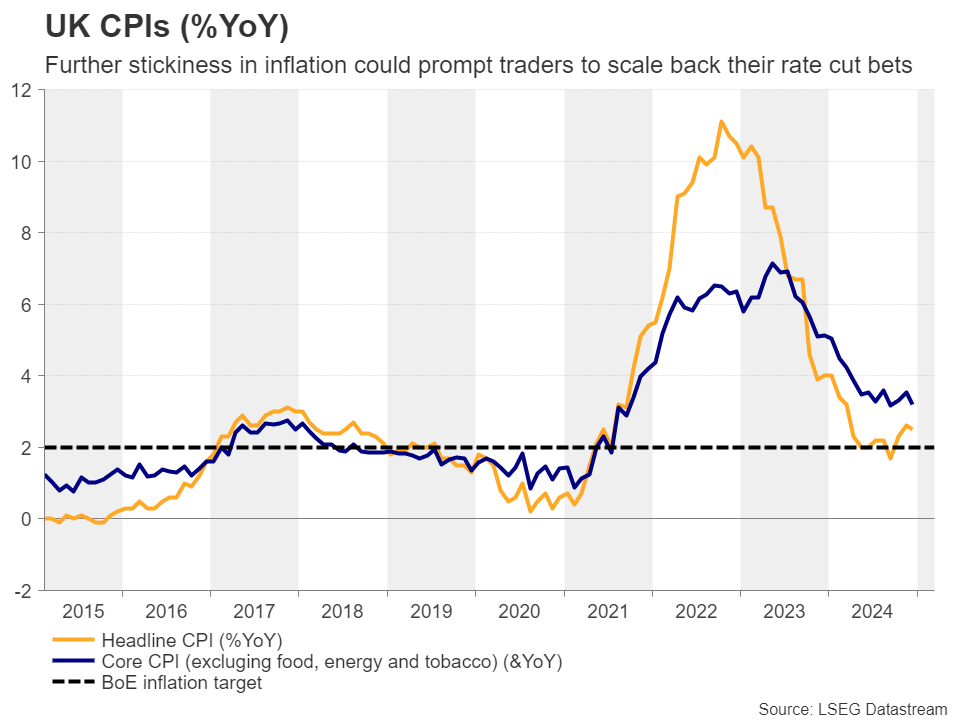
UK data to shape BoE policy expectations
In the UK, the employment report for December will be released on Tuesday, followed by the all-important CPI data for January on Wednesday. Retail sales for January and the preliminary PMIs for February are scheduled for Friday.
At the first BoE decision for the year, officials decided to cut interest rates by 25bps, as was broadly expected, revising down their growth projections and lifting up their inflation forecasts.
The direction of the revisions was also largely anticipated. What came as a surprise was the unanimous vote in favor of a rate cut, with two members preferring a 50bps reduction. What was even more striking was that the super-hawk Catherine Mann, who was the sole advocate for keeping rates steady in November, voted for a double reduction this time.
According to the UK Overnight Index Swaps (OIS), investors are now pricing in around 55bps worth of additional reductions this year, but should the CPI data echo the Bank’s concerns about sticky inflation moving forward, traders may reduce their bets, especially if, following this week’s better-than-expected GDP data for Q4, the PMIs point to further improvement in economic activity. This may allow the pound to extend its latest recovery a bit more.
Eurozone PMIs, Canada and Japan CPI data
Apart from the US and UK PMIs, Friday’s agenda includes Eurozone’s preliminary prints as well. Although the ECB is expected to lower interest rates by another 80bps this year, the euro has been the best performer this week, perhaps driven by the prospect of a de-escalation in the Ukraine war. A set of improving PMIs could help the common currency gain some more ground.
The Canadian dollar held strangely well against its neighboring greenback this week, despite Trump’s tariffs on steel and aluminum. It is worth mentioning that around 80% of aluminum imports to the US come from Canada.
Following Friday’s better-than-expected Canadian jobs report for January, traders are assigning around a 55% chance for the BoC to take the sidelines at its upcoming gathering on March 12, but this probability could well be shaken on Tuesday, when the Canadian CPI numbers are scheduled to be released. Inflation in Canada has already dropped below 2%, and another month of cooling price pressures may encourage some investors to reconsider whether the BoC should pause its rate cuts so soon. If the probability for a rate cut in March rises, then the loonie may slide somewhat. Canada’s retail sales for December will be released on Friday.
Japan’s Nationwide CPI numbers will be released during the Asian session on Friday and given the latest choice of market participants to bring forward expectations of when the BoJ is likely to raise interest rates again, the data may attract special attention by yen traders.
Weekly Focus – Still Waiting for Political Clarity
Donald Trump's policy announcements continue to draw a lot of attention and create significant intra-day market moves but ultimately not clarity on economic policies and few lasting effects. This week, we had the announcement of so-called reciprocal tariffs where the US will base import tariffs on restrictions that US companies face on their export markets. That could imply large tariff hikes on for example goods from the EU, as the Trump administration seems to consider European VAT as equivalent to an import tariff, and the prospect initially weakened the EUR against USD. However, the actual announcement was vague with few details and the statement that countries might be able to avoid them, and markets ended in risk-on mode. As previously announced, the administration will examine the US trade deficit before 1 April, which also seems to be the deadline for the reciprocal tariffs.
The Trump administration also pushed for peace between Russia and Ukraine, leading to hopes that this could benefit the wider European economy but also concerns that the US would accept a stronger position for Russia that could pose risks for both Ukraine and EU countries in the longer run. Hence, it is not obvious that a peace agreement would open up for renewed large-scale energy export from Russia to the EU or would allow European countries to reduce their rearmament ambitions. There would be a need for rebuilding Ukraine which could benefit some European companies but also put further strains on public finances in EU countries.
On the data side, US CPI inflation came out significantly higher than expected at 0.4% m/m in January for the core measure, with the surprise being broad across categories especially within services. Together with the recent increase in household inflation expectations, this weakens the case for a Fed rate cut in March, although it should be noted that the January number may be distorted by one-off price adjustments. We still believe that rates should be cut significantly as monetary policy is restrictive, but the Fed has signalled that it is not in a hurry to do so, as the economy is broadly still quite strong. Also, Chinese inflation was higher than expected at 0.5% y/y in January against 0.1% y/y in December - so still low inflation, but moving up, and China could be less of a disinflationary force in the world economy going forward.
The most important data releases in the coming week are likely to be the PMIs for the major economies except China that are due on Friday, with US regional surveys coming in the days before. Especially in Europe, PMIs delivered some positive news in January as the decline in manufacturing seemed to slow. It will be interesting to see if we move further in that direction this month, supporting the view that the European economy is slowly being supported by rising real incomes and lower interest rates. There will also be plenty of attention still on politics, with talks about Ukraine currently ongoing at the Munich Security Conference and with the German election Sunday next week. We do not expect the election to make a large difference for the near-term economic outlook though, see Research Germany - Limited economic impact from German election, 6 February.
Sunset Market Commentary
Markets
Weak January US retail sales triggered a rally in US Treasuries going into the long weekend with US markets closed on Monday in celebration of President’s Day. Headline sales fell by 0.9% M/M (vs -0.2% consensus) with sales in the retail control group, used as a proxy for consumption (goods spending) in GDP calculations, falling by 0.8% M/M (vs +0.3% consensus). Wildfires in Los Angeles and severe winter weather in other parts of the country might have depressed brick-and-mortar shopping activity. Nine out of 13 categories posted decreases, like motor vehicles and furniture stores. Spending at the only service-sector category (restaurant & bars) rose by 1% M/M. Upward revisions to December data, respectively from 0.4% M/M to 0.7% and from 0.7% to 0.8% couldn’t compensate for the January miss. The relatively strong move in US Treasuries highlights the different asymmetry in market reaction between Europe and the US. Expectations around Europe are low, triggering asymmetric (larger) moves to positive surprises. Expectations around the US are high, triggering asymmetric (larger) moves to negative surprises. It was already telling that the post-CPI moves earlier this week were so easily erased yesterday. US treasury yields slip 5.2 bps to 7.3 bps across the curve with the belly of the curve outperforming the wings. European swap rates are still a tad higher intraday. The dollar loses out with EUR/USD currently changing hands around 1.05 with a test of the YTD top at 1.0533 likely. The trade-weighted dollar already lost the YTD low at 106.97, currently trading around 106.70. The December low at 105.42 is the next technical reference. European stock markets kept a small positive bias with the EuroStoxx50 testing the all-time high at 5522. US stock markets open flat.
Next week’s agenda is rather thin with Friday’s global PMI’s the highlight. Labour market and inflation data are scheduled in the UK but unlikely to break the deadlock in EUR/GBP. Central bank meetings Down Under could bring a first policy rate cut this cycle by the RBA and a continuation of the cutting cycle in New Zealand.
News & Views
Polish inflation jumped far more than expected in January. Headline inflation accelerated to 1% M/M and 5.3% Y/Y (from 0.0% M/M and 4.7% in December vs 5% Y/Y expected). The 5.3% Y/Y pace was the fastest since December 2023. The National Bank of Poland targets inflation at 2.5% with a deviation range of +/- 1.0%. Food and non-alcoholic beverages (which has a weighting of 28% in the index) rose a strong 1.6% M/M. However also other major sub-categories including dwelling related costs and transport at respectively 1.4% M/M and 1.1% M/M contributed to the overall rise in prices. An uptick in headline inflation in January was expected and inflation might slow the coming months. Even so, today’s data will further complicate the debate on a potential start of NBP policy normalization. Especially government Glapinski who already held a hawkish view, might see the data as reinforcing his case that there is no room to discuss policy easing anytime soon. The NBP already holds its policy rate at 5.75% since October 2023. The prospect of persistent interest rate support already for quite some time supports a solid bid for the zloty. EUR/PLN today declines to 4.161, hovering near the strongest levels for the zloty since April 2018.
In an interview with the Financial Times, French President Macron addressed a with range of (geo)political topics that Europe is currently facing including its security position and a potential ceasefire for the war in Ukraine. To enable European countries to invest more in their defense, the French president again supported the view that more ‘innovative financing solutions’ are needed including more common EU borrowing as was done during the corona pandemic. Macron, in this respect advocated that Europe needs to liberate itself from the deficit caps under the Stability and Growth Pact. He labelled the system as “obsolete” and was quoted that “the financial and monetary framework we live in is outdated”. According to Macron, “Europe is under-leveraged, given its need to invest in emerging technologies such as artificial intelligence, the green transition and security.”
US: Retail Sales Decline in January
Following a string of strong gains in the prior three months, retail and food services sales declined 0.9% month-on-month (m/m) in January. This was worse than the consensus forecast, which called for a decline of 0.2% m/m. However, December's figures were revised higher to 0.7% m/m (previously 0.4% m/m).
Vehicle and parts sales were a substantial a drag on the headline (-2.8% m/m), with sales shifting in reverse following a string of strong gains at the end of last year. Sales at gasoline stations advanced by 0.9%, largely due to higher prices at the pump. Sales at building materials and equipment stores fell 1.3% m/m, posting a fourth consecutive monthly decline.
Sales in the "control group", which the excludes volatile components above (i.e., gasoline, autos and building supplies) and is used in the estimate of personal consumption expenditures (PCE), also fell (-0.8% m/m), following a 0.9% gain in December.
Sales were weak across most brick-and-mortar retailers, with the largest declines seen in furniture and home furnishing stores (-1.7% m/m) and sporting goods and hobby stores (-4.6% m/m). Only general merchandise stores (+0.5%) and miscellaneous retailers (+0.2%) bucked the trend and posted small gains.
In contrast, sales in bars and restaurants fared better, rising 0.9% after a soft reading in December.
Key Implications
It appears that consumers hit the pause button on shopping in January. Auto sales weighed heavily on the headline, following a jump in demand late last year. This was likely driven by an increase in replacement demand following the Hurricanes Helene and Milton. However, the breadth of pullback in sales activity suggests that inclement weather and the wildfires in California could have also contributed to the slower pace of spending in January – suggesting we should see some giveback in the months ahead.
Broadly speaking, households balance sheets remain healthy, supported by a large pile of household wealth and some nascent signs that delinquencies on credit cards and auto loans are levelling off. However, inflation remains a hot button for consumers, not helped by the ongoing uncertainty on the potential implications of the looming tariffs. While one month doesn't make a trend, the slower start to the year suggests Q1 spending could be closer to 2.5% annualized (down from our prior estimate of 3.0%).
Swiss Franc Soars as Trump Pushes Off Tariffs
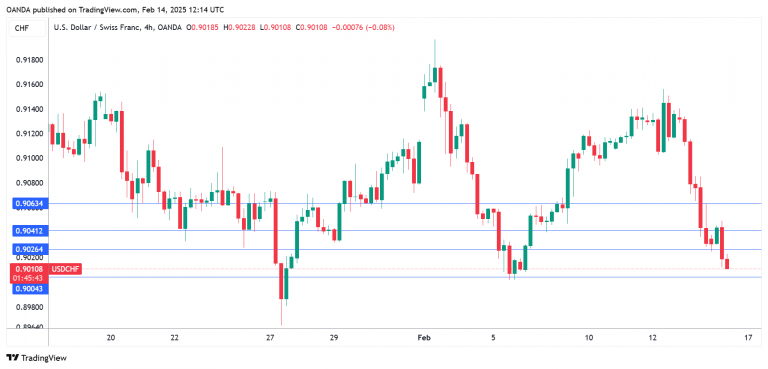
The Swiss franc has steadied on Friday after sliding 1.1% a day earlier. In the European session, USD/CHF is trading at 0.9016, down 0.16% on the day.
The US dollar beat a hasty retreat against the major currencies on Thursday, after the White House announced that the US would not impose reciprocal tariffs before April 1. There had been fears that Trump would impose the levies on Feb. 13 and the announcement brought relief to the financial markets and raised risk sentiment, sending the US dollar sharply lower.
Switzerland’s inflation rate falls to 0.4%
Switzerland’s inflation rate dipped to 0.4% y/y in January, down from 0.6% in December and in line with the market estimate. This was the lowest annual inflation level since April 2021, as key sub-categories posted a decrease in prices, including food, clothing and services. Monthly, CPI remained at -0.1% for a fourth consecutive month and matched expectations. The Swiss National Bank is watching with concern as inflation continues to decline. The Bank’s target band is between 0% and 2% and it could hike rates in March if inflation falls closer to 0%.
In the US, the Producer Price Index showed little change in January. PPI rose 0.4% m/m after an upwardly revised 0.5% gain in December. This was higher than the market estimate of 0.3%. Annually, PPI rose 3.5%, unchanged from an upwardly revised 3.5% gain in December and above the market estimate of 3.2%.
The US wraps up the week with the January retail sales report. The markets are bracing for a soft release, with a market estimate of -0.1%, after the 0.4% gain in December. Annually, retail sales are expected to dip to 3.7%, after a 3.9% gain in December.
USD/CHF Technical
- USD/CHF is testing support at 0.9026. Below, there is support at 0.9004
- 0.9041 and 0.9063 are the next resistance lines
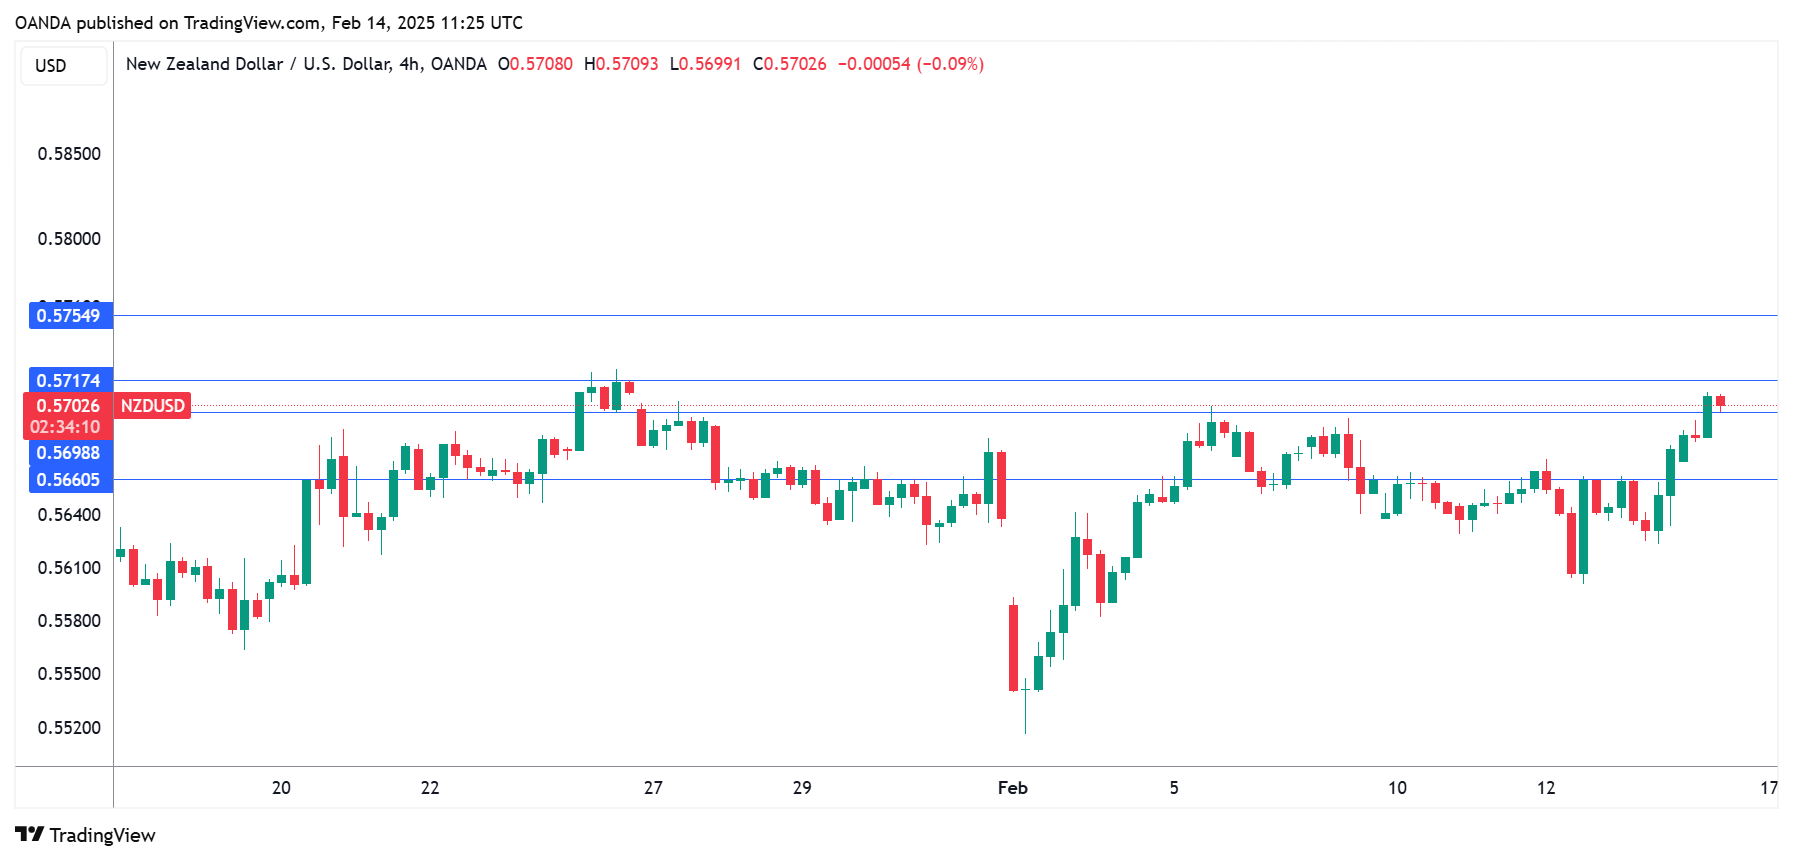
NZ Dollar Extends Gains After Strong Mfg. Data
The New Zealand dollar continues to rally on Friday. NZD/USD is trading at 0.5702 in the European session, up 0.43% on the day.
Manufacturing PMI unexpectedly expands
New Zealand’s Manufacturing PMI rose to 51.4 in January, up sharply from the December reading of 45.9 and above the market estimate of 46.0. This was a milestone reading as it marked the first expansion in almost two years and was the highest level since September 2022. All key sub-categories posted growth, including new orders, production and employment.
The manufacturing sector has started the year on a high note but the outlook for 2025 remains cloudy. Global demand has been weak and China, New Zealand’s largest export market, is experiencing a bumpy post-Covid recovery. Still, there are some bright spots which should provide a boost to manufacturing. The weak New Zealand dollar is good news for exports and interest rates are falling, with the central bank widely expected to lower rates next week.
The Reserve Bank of New Zealand meets on Feb. 19 and a rate cut is fully priced in, with the probability of a quarter-point or half-point cut at around 50/50. This should make for an interesting meeting and the New Zealand dollar could take a hit if policy makers chop rates by a half-point.
In the US, the PPI release showed little change in January. PPI rose 0.4% m/m, after an upwardly revised 0.5% gain in December. This was higher than the market estimate of 0.3%. Annually, PPI rose 3.5%, unchanged from an upwardly revised 3.5% gain in December and above the market estimate of 3.2%.
The US wraps up the week with the January retail sales report. The markets are bracing for a soft release, with a market estimate of -0.1%, after the 0.4% gain in December. Annually, retail sales are expected to dip to 3.7%, after a 3.9% gain in December.
NZD/USD Technical
- NZD/USD is testing resistance at 0.5698. Above, there is resistance at 0.5717
- 0.5660 and 0.5641 are the next support levels
EUR/USD Significantly Rises as Risks Diminish
EUR/USD climbed to 1.0453 on Friday, reaching a two-week high and maintaining stability.
Key drivers behind EUR/USD movement
The euro’s gains accelerated after US President Donald Trump signed a memorandum to review retaliatory duties without immediately imposing new tariffs. This decision eased investor concerns, reducing fears of an aggressive US response that could have added to inflationary pressures. With no immediate trade retaliations, markets view inflation risks as stabilising, reducing uncertainty around the Federal Reserve’s monetary policy.
Additionally, geopolitical tensions appear to be easing, lowering the risk premium in the currency market and further supporting EUR/USD.
However, doubts remain regarding the monetary policy divergence between the Federal Reserve and the European Central Bank (ECB). While the Fed continues to be cautious, showing little urgency to cut interest rates, the ECB is actively considering rate cuts. This policy mismatch is expected to weigh on the euro in the long term.
Technical analysis of EUR/USD
On the H4 chart, EUR/USD extended its growth wave towards 1.0466 before forming a consolidation range below this level. The pair has now broken downward from this range, opening the potential for a decline towards 1.0372. Once this target is reached, a corrective move towards 1.0416 is likely. The MACD indicator supports this scenario, with its signal line at high levels, suggesting an imminent pullback to lower lows.
On the H1 chart, EUR/USD completed its growth wave to 1.0466 and is now consolidating in a narrow range. A downward breakout is expected, initially targeting 1.0420, followed by a potential correction towards 1.0444. In the longer term, another downward wave will likely develop, targeting 1.0394 and extending towards 1.0372. The Stochastic oscillator confirms this bearish outlook, with its signal line positioned below 50 and trending towards 20, indicating growing downside pressure.
Conclusion
While EUR/USD has gained on reduced trade war risks and stabilising inflation fears, the pair is now facing a short-term correction. The monetary policy divergence between the Fed and ECB remains a key factor that could limit further upside for the euro. Technically, a pullback towards 1.0372 is likely in the short term, with potential corrective bounces towards 1.0416 and 1.0444 before the next downward wave. Market participants will continue monitoring US trade policy updates and Fed rate expectations for further direction.