Sample Category Title
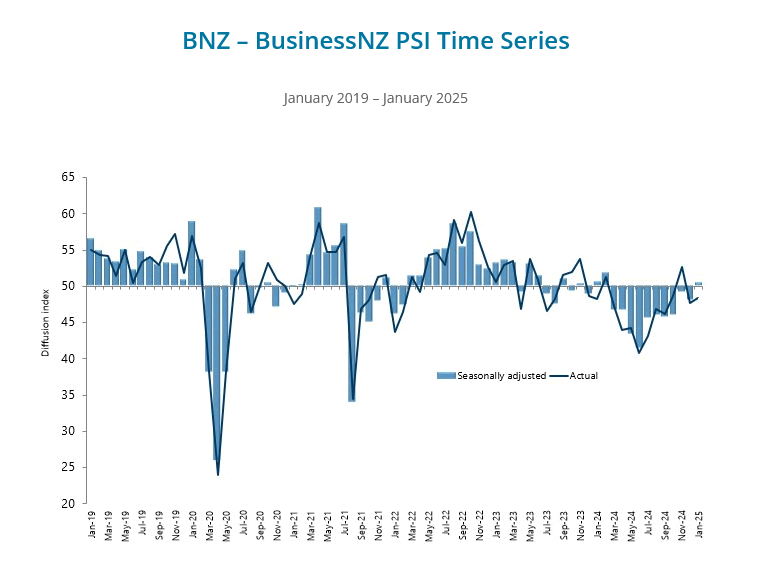
NZ BNZ services rises to 50.4, stabilization rather than elevation
New Zealand BusinessNZ Performance of Services Index climbed from 48.1 to 50.4 in January, marking a return to expansion after four consecutive months of contraction. While this signals some improvement, the index remains below its long-term average of 53.1.
A closer look at the components reveals a mixed picture. Activity/sales saw a notable rebound, rising from 46.5 to 54.0, while new orders/business ticked up slightly from 49.4 to 50.0. Stocks/inventories also edged into expansion territory at 50.1, up from 48.9. However, employment continued to struggle, slipping from 47.4 to 47.1. Supplier deliveries showed minimal improvement, moving from 47.7 to 47.8.
Despite the headline figure turning positive, sentiment remains weak. The proportion of negative comments rose to 61.9% in January, up from 57.5% in December and 53.6% in November. Respondents cited economic uncertainty and broader downturn concerns as key issues.
BNZ’s Senior Economist Doug Steel noted that the PSI reflects “stabilization rather than elevation,” highlighting that while the upward move is a positive sign, the sector is far from robust growth.
Gold Wave Analysis
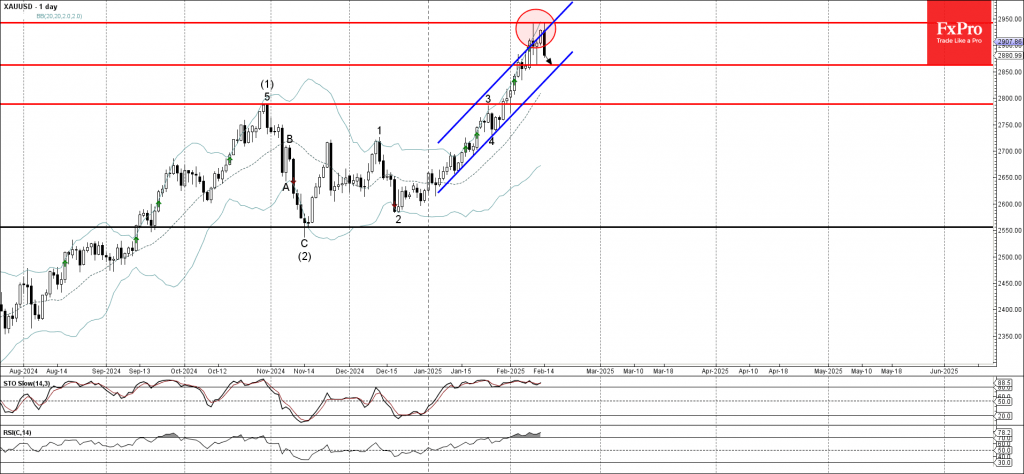
- Gold reversed from resistance zone
- Likely to fall to support level 2860.00
Gold today reversed down the resistance zone between the key resistance level 2940.00 (which formed daily Doji earlier this month), the resistance trendline of the daily up channel from January and the upper daily Bollinger Band.
The downward reversal from this resistance zone will most likely form the daily Japanese candlesticks reversal pattern Bearish Engulfing – if the price closes today near the current levels.
Given that both daily Stochastic and RSI indicators are high in the overbought areas, Gold can be expected to fall to the next support level 2860.00.
NZDUSD Wave Analysis
- NZDUSD broke the resistance zone
- Likely to rise to resistance level 0.5800
NZDUSD currency pair recently broke the resistance zone between the key resistance level 0.5700 (which stopped the earlier waves iv, 2 and ii), the resistance trendline of the daily down channel from November and the 38.2% Fibonacci correction of the downward impulse from December.
The breakout of this resistance zone stopped the previous minor impulse wave iii of the higher order impulse wave 1 from last October.
NZDUSD currency pair can be expected to rise to the next resistance level 0.5800 (former monthly low from November).

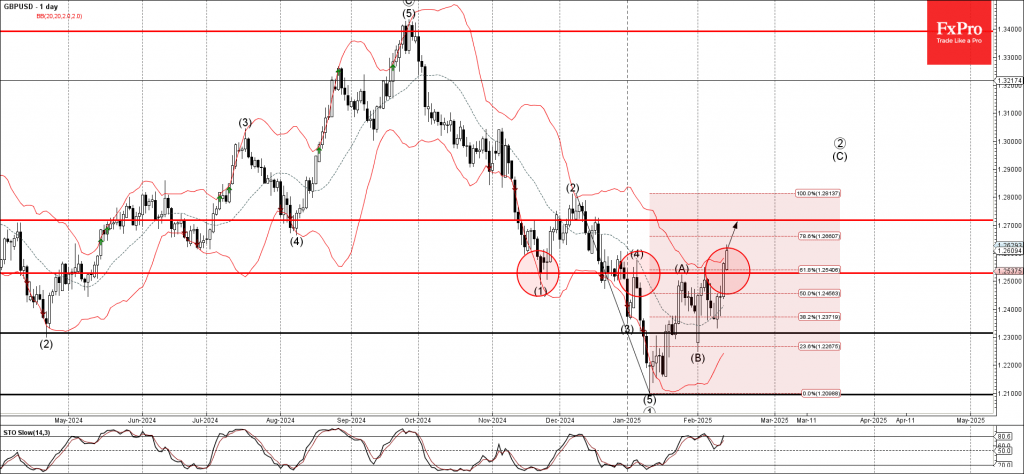
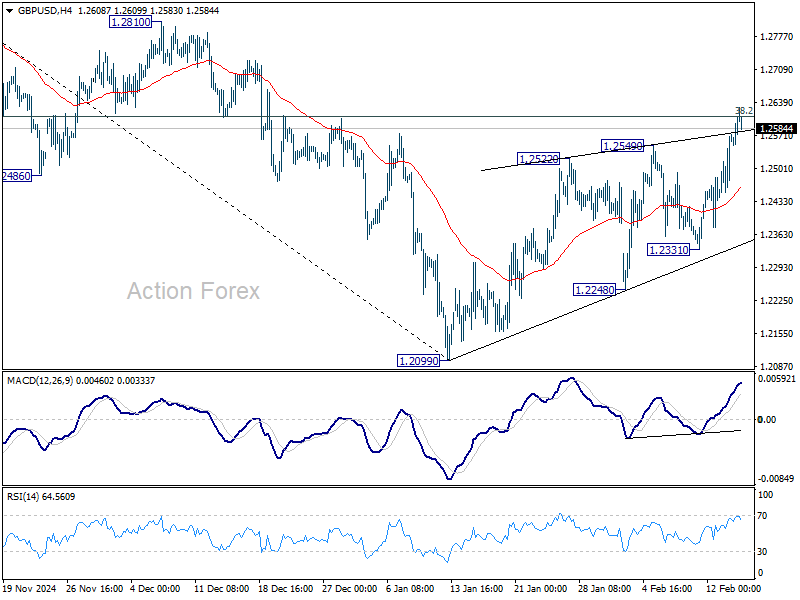
GBPUSD Wave Analysis
- GBPUSD broke resistance zone
- Likely to rise to resistance level 1.2720
GBPUSD currency pair recently broke the resistance zone between the key resistance level 1.2530 (which has been reversing the price from the start of January) and the 61.8% Fibonacci correction of the downward impulse from December.
The breakout of this resistance zone accelerated the active medium-term impulse wave (C) from the end of January.
Given the strongly bearish US dollar sentiment seen today, GBPUSD currency pair can be expected to rise to the next resistance level 1.2720.
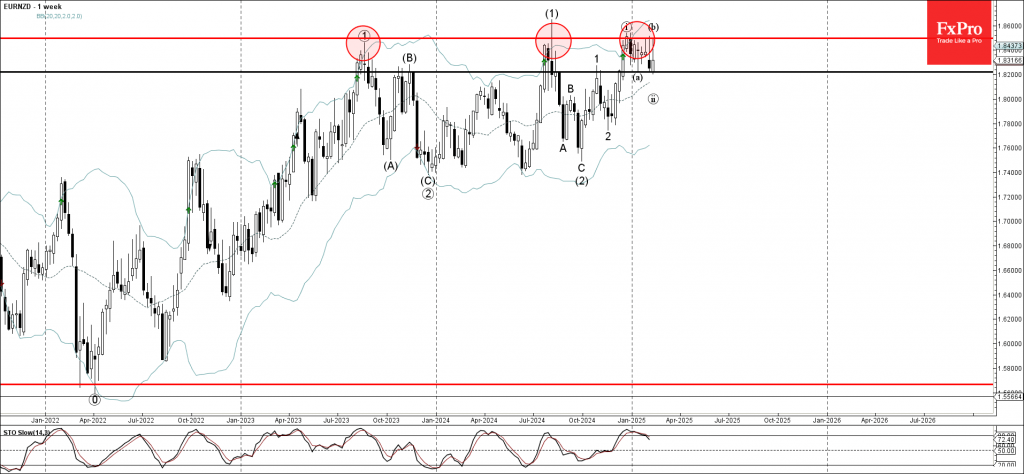
EURNZD Wave Analysis
- EURNZD reversed from long-term resistance level 1.8495
- Likely to fall to support level 1.8200
EURNZD currency pair recently reversed down from the major long-term resistance level 1.8495, which has been reversing the price from the middle of 2023, as can be seen below.
If the pair closes today near the current levels it will form the weekly Japanese candlesticks reversal pattern Shooting Star – a strong sell signal for this currency pair.
Given the strength of the resistance level 1.8495 and the bearish euro sentiment seen today, EURNZD currency pair can be expected to fall to the next support level 1.8200.
Dollar at Crossroads: Rebound Possible, But Bearish Risks Intensify
Dollar closed the week broadly lower, with the only exception being its slight gains against the even weaker Yen. Risk-on sentiment dominated global markets, fueling strong rallies in equities across the US, Europe, and Hong Kong, which in turn kept the greenback under pressure.
The greenback had previously enjoyed a tariff-driven boost earlier in the month, but that narrative has largely unwound following the delay in implementing reciprocal tariffs. This shift has more than offset growing expectations that Fed will maintain a prolonged pause in rate cuts.
Dollar Index is now at a critical technical juncture. A bounce from current levels is possible. However, if risk-on sentiment persists and intensifies, deeper pullback could materialize, with risk of leading to bearish trend reversal.
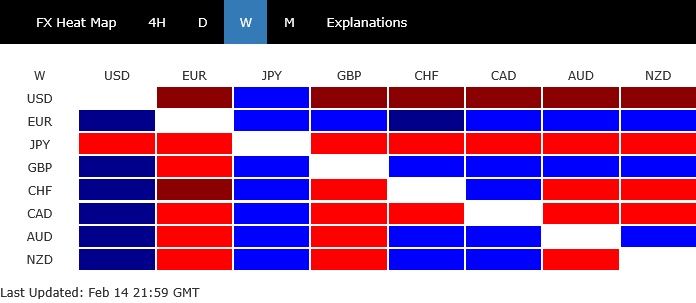
While Dollar's outlook appears increasingly vulnerable, other major currencies are struggling to establish clear directions. Most non-dollar pairs and crosses ended the week within their prior ranges, reflecting a lack of conviction among traders.
Euro emerged as the strongest performer. Sterling followed behind, and then Aussie. On the weaker side, Yen underperformed the most, Dollar and Loonie followed in the lower tier. Swiss franc and Kiwi ended in middle positions.
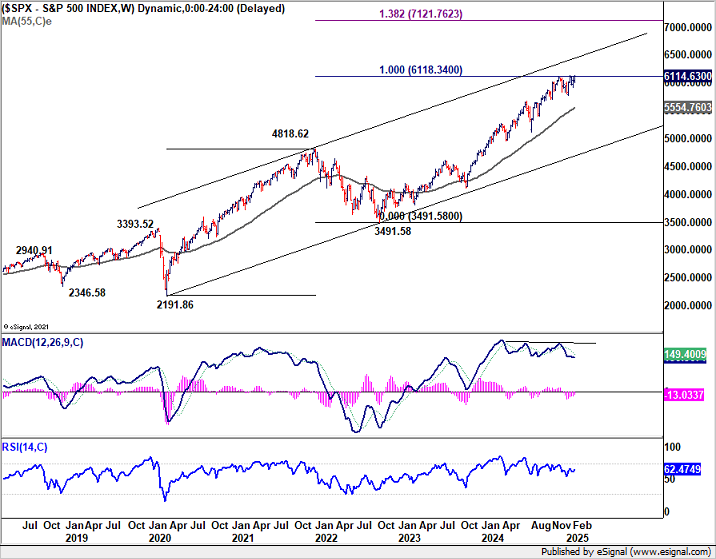
S&P 500 Nears Record as Markets Welcome Reciprocal Tariff Delay
Investor sentiment in the US was broadly positive with major stocks indexes closing the week higher. S&P 500 even surged to just below its record high. Fed's pause in its policy easing cycle is likely to continue for an extended period, but the market seems unfazed. Instead, focuses were on robust economic fundamentals and easing immediate tariff risks.
A key driver of the upbeat mood is US President Donald Trump’s plan for reciprocal tariffs, which, for the moment, lacks immediate enforcement. The administration has pledged to investigate and develop country-specific tariffs by April 1 under the guidance of Commerce Secretary. That would potentially provide ample time for negotiations and compromises with major trading partners. As a result, immediate trade disruptions appear unlikely, prompting relief in equity markets.
Meanwhile, Fed Chair Jerome Powell reiterated in his semiannual testimony to Congress that the central bank is in “no hurry” to cut interest rates again. Market participants have largely adjusted their expectations for the next Fed rate cut, now anticipating it more likely in the second half of the year rather than the first.
Powell's message also aligns with the data: January’s CPI and core CPI both accelerated, and PPI also exceeded expectations, indicating that price pressures may still be lingering. These figures support the Fed’s decision to maintain a restrictive rate stance until inflation shows more convincing signs of moderating. Meanwhile, disappointing January retail sales figures indicates slower pace of consumer spending, and Fed is unlikely needed to revert to tightening to curb inflation.
Technically, S&P 500 should be ready to resume its long term up trend. Further rise is expected as long as 6003.00 support holds. Next near term target is 61.8% projection of 5119.26 to 6099.97 from 5773.31 at 6379.38.
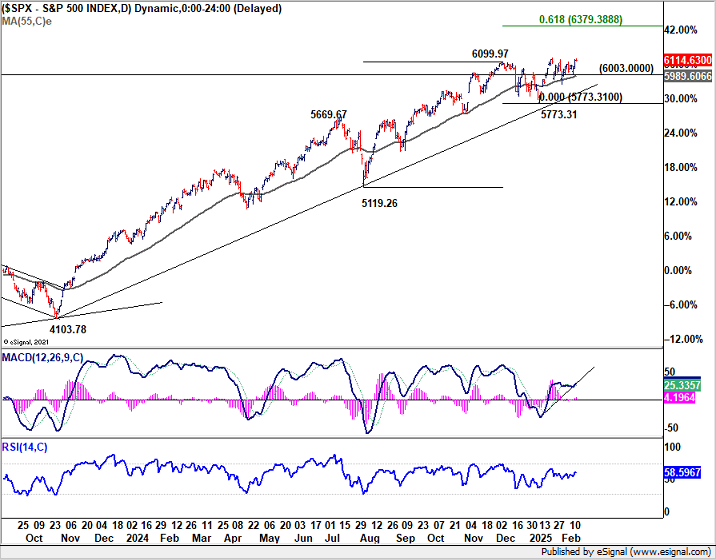
A larger question looms over whether S&P 500 can decisively break through long-term rising channel resistance (now around 6436). If it manages to do so, it could trigger medium-term acceleration 138.2% projection of 2191.86 to 4818.62 from 3491.58 at 7121.76.
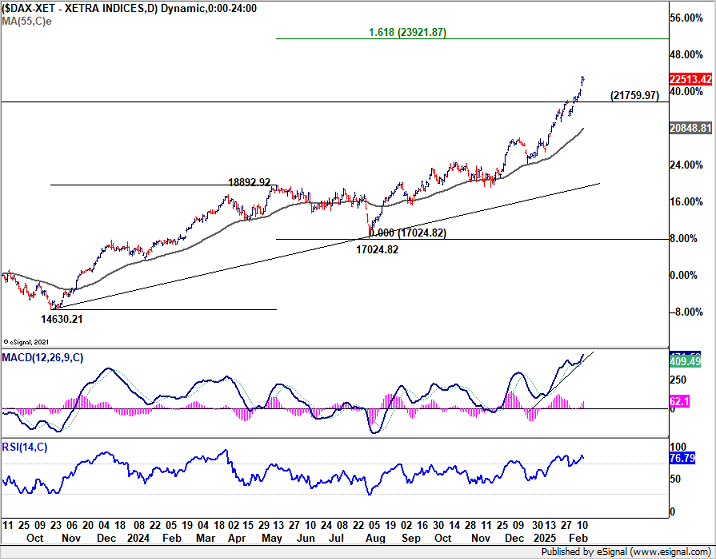
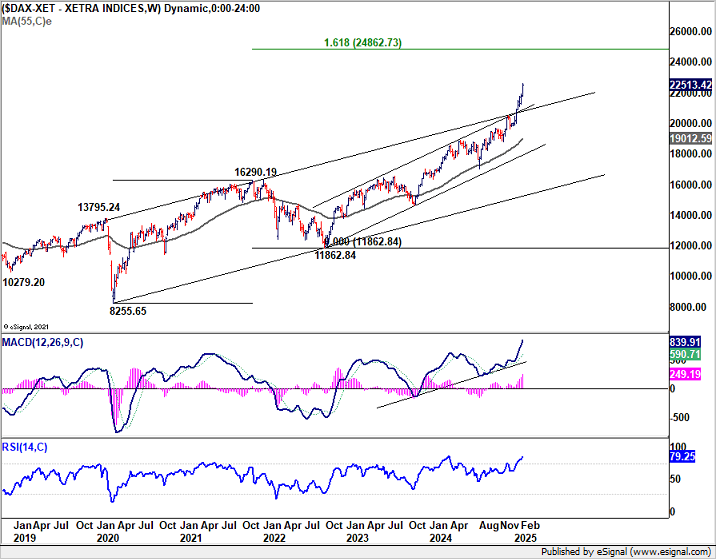
DAX Surges to New Highs as Hopes for Ukraine Ceasefire Lift Sentiment
European markets staged an even stronger robust rally last week, with investors embracing a wave of optimism fueled by delayed US tariffs and renewed hopes of stability on the geopolitical front, with expectations for steady, gradual rate cuts from ECB in the background.
The pan-European STOXX 600 index chalked up its eighth consecutive week of gains—its longest winning streak since Q1 2024—and hit a fresh intra-week record.
One critical boost to confidence is the possibility that negotiations to end the war in Ukraine might soon begin. US President Donald Trump confirmed that he has held discussions with Ukrainian President Volodymyr Zelensky and Russian President Vladimir Putin, signaling that negotiations to end the war will begin immediately. Such a resolution could not only stem the loss of life but also reignite investment in the region, delivering a strong catalyst for further economic expansion across Europe.
A cessation of hostilities in Ukraine would likely pave the way for significant investment programs, particularly in infrastructure and reconstruction. This influx of capital could be a tailwind for the manufacturing and industrial sectors throughout the EU, driving demand for goods and services.
In Germany, DAX extended its record run with strong momentum. Near term outlook will stay bullish as long as 21759.97 support holds. Next target is 161.8% projection of 14630.21 to 18892.92 from 17024.82 at 23921.87.
In the larger picture, DAX is clearly in an acceleration phase and could be targeting 161.8% projection of 8255.65 to 16290.19 from 11862.84 at 24862.73 before topping.
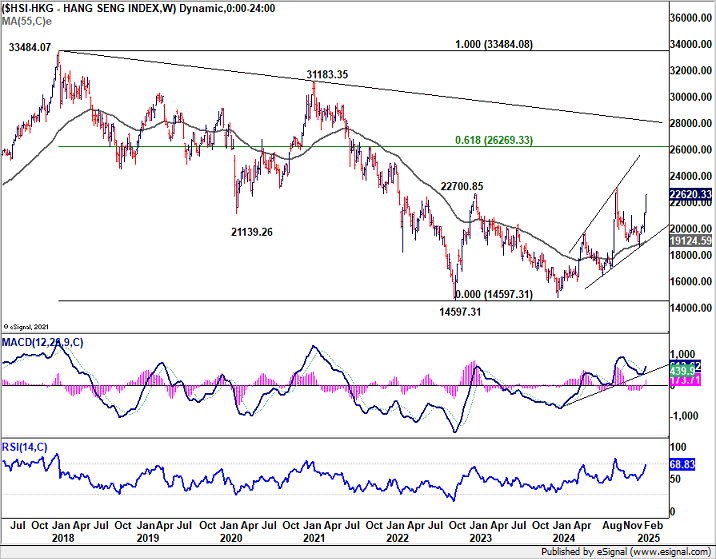
Hong Kong Stocks Surge as China AI Optimism Builds
Asian markets closed out the week with mixed performance, reflecting divergent regional drivers. Hong Kong’s HSI stole the show, and soared to a four-month high, underpinned by shifting investor sentiment toward a less aggressive US tariff policy and excitement around China’s tech sector.
The Hong Kong market’s volatility was evident in the HSI’s deep profit-taking pullback on Thursday, followed by a strong 4% rebound on Friday—an indication of how quickly sentiment can swing once trade uncertainties eased with delay of Trump's reciprocal tariffs.
Another critical factor fueling the advance is the surge of optimism surrounding Chinese technology companies, particularly after the emergence of AI-related developments with DeepSeek.
Unlike the brief recoveries seen last year, many analysts view the current run-up in Hong Kong’s equities as more than a short-lived, stimulus-driven bounce. They see a paradigm shift, with investors recognizing new opportunities in Chinese tech with prospect of long-term sector expansion.
The result could be a stronger, more resilient rally that may endure longer than earlier bursts of optimism.... provided global trade tensions remain manageable.
Technically, last week's extended rise in HSI should confirm that correction from 23241.74 has completed at 18671.49 already. Near term outlook will stay bullish as long as 21070.05 resistance turned support holds. Firm break of 23241.74 will confirm resumption of whole medium term rise from 14794.16. Next target is 100% projection 16964.28 to 23241.74 from 18671.49 at 24948.95, which is close to 25k psychological level.
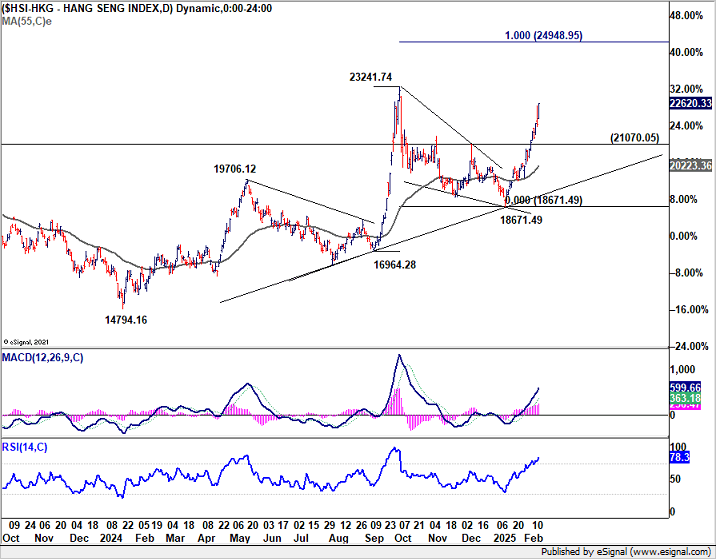
In the bigger picture, the strong support from 55 W EMA is clearly a medium term bullish signal. It's still way too early to confirm that whole long term down trend from 33484.08 (2018 high) has reversed. But even as a corrective move, rise from 14597.31 could extend to 61.8% retracement of 33484.08 to 14597.31 at 26269.33 before topping.
Dollar at a Crossroads as Risk Sentiment Keeps Pressure On
Dollar Index finds itself at a pivotal juncture following last week’s significant decline. A short-term bounce remains possible if the index can defend 38.2% retracement of 100.15 to 110.17 at 106.34. If strong support emerges at this point, it would reinforce the idea that recent price action is merely a consolidation pattern. That would keep the rally from 100.15 intact, setting the stage for an eventual break of 110.17 high.
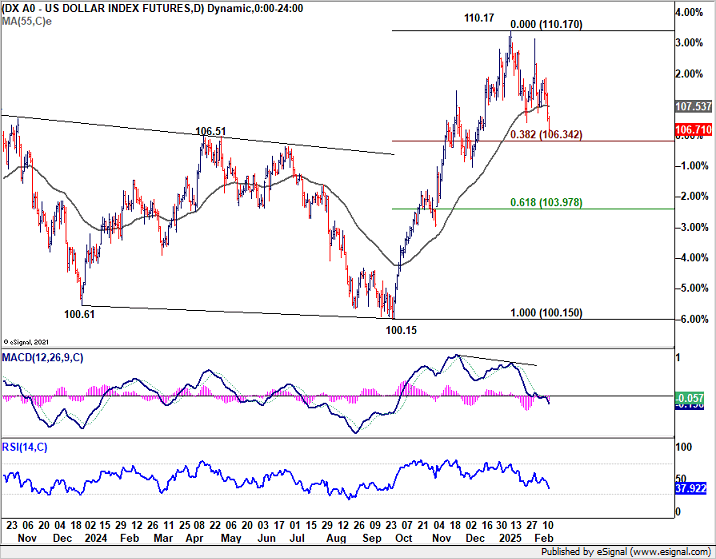
However, the growing appetite for risk across global markets could add additional weight on the greenback. Decisive break below the 106.34 support would deepen the correction to 55 W EMA (now at 105.23). Sustained break of 55 W EMA will argue that whole rise from 99.57 (2023 low) has already completed and a more significant trend reversal is underway.
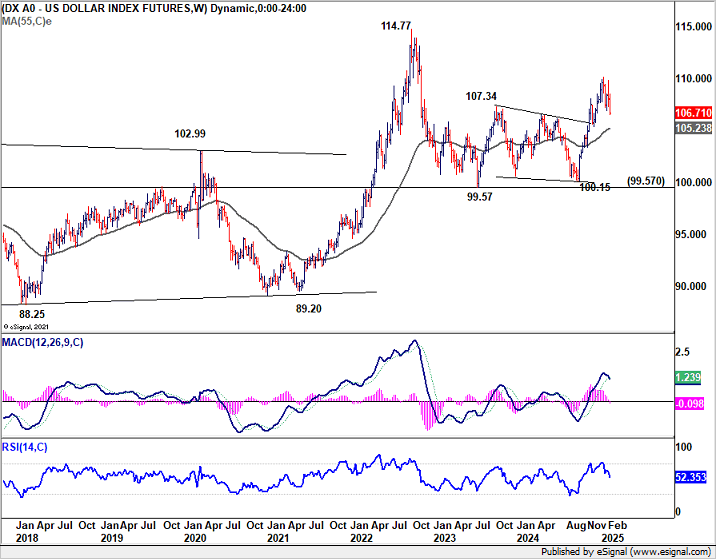
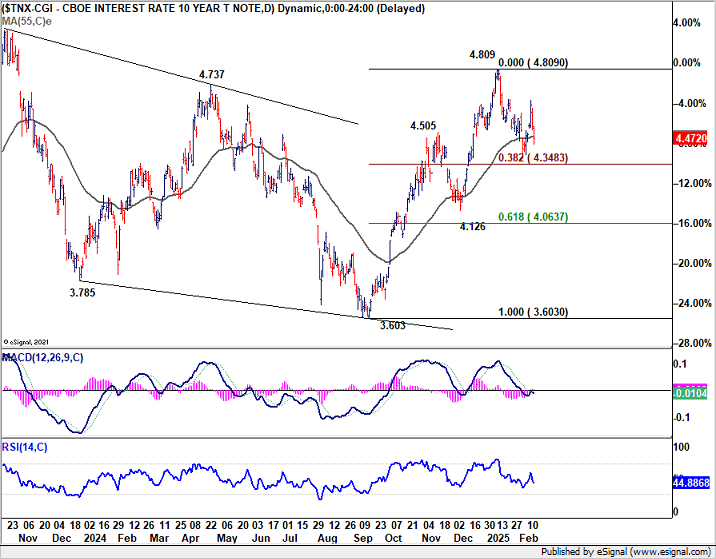
Compounding Dollar’s woes, U.S. Treasury yields have not offered the usual support. 10-year yield reversed quickly after briefly climbing to 4.660%. Even in a more optimistic scenario,10-year yield appears to be extending consolidation between the 4.809 high and 38.2% retracement of 3.603 to 4.809 from 4.348, leaving Dollar without a strong tailwind from the rates market.
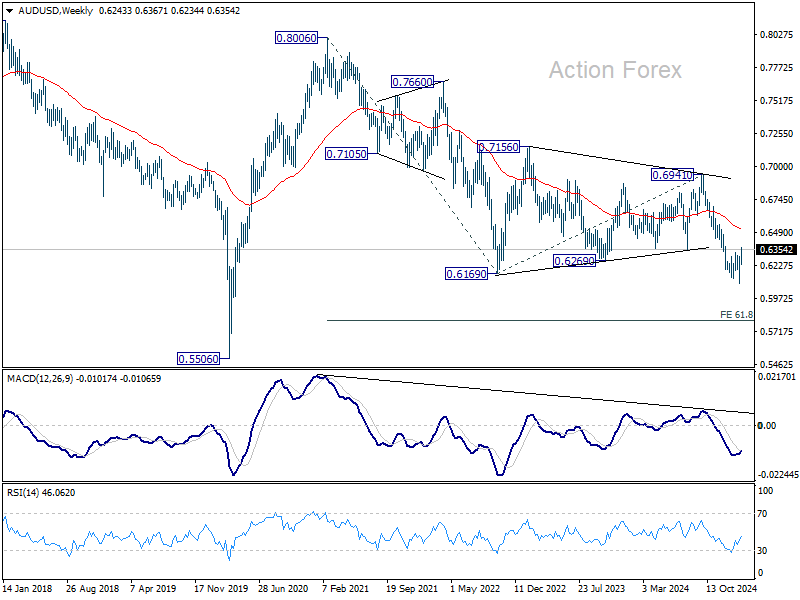
AUD/USD Weekly Report
AUD/USD's break of 0.6329 resistance last week indicates that rebound from 0.6087 is at least correcting the whole fall from 0.6941. Initial bias is now on the upside for 38.2% retracement of 0.6941 to 0.6087 at 0.6413. On the downside, however, break of 0.6234 support will suggest that the rebound has completed and bring retest of 0.6087 low.
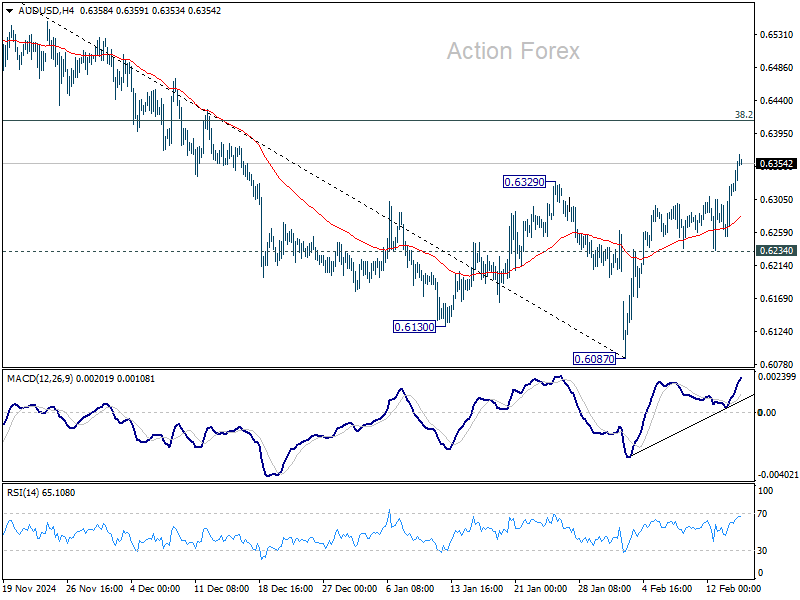
In the bigger picture, fall from 0.6941 (2024 high) is seen as part of the down trend from 0.8006 (2021 high). Next medium term target is 61.8% projection of 0.8006 to 0.6169 from 0.6941 at 0.5806. In any case, outlook will stay bearish as long as 55 W EMA (now at 0.6516) holds.
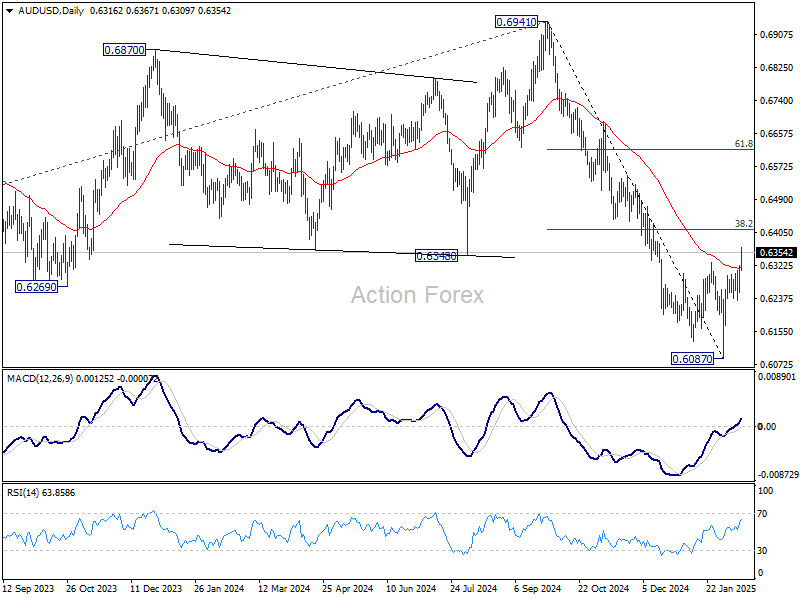
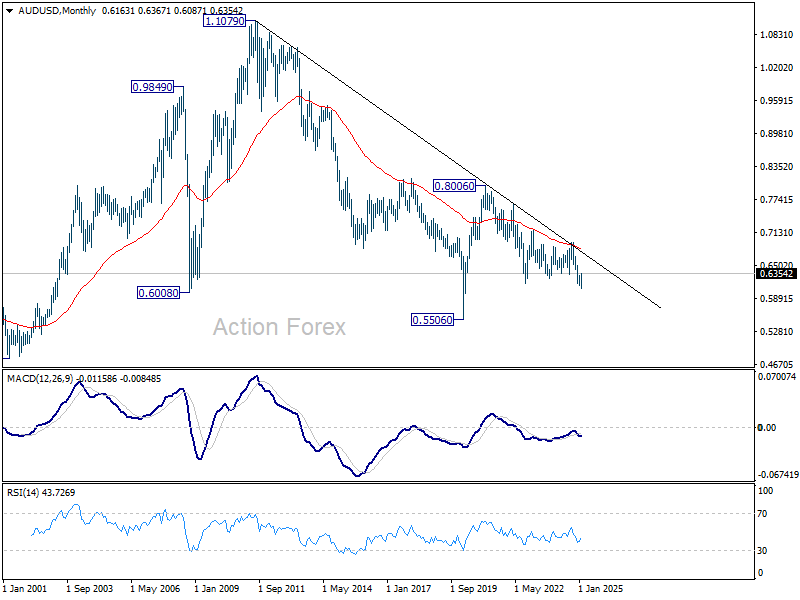
In the long term picture, prior rejection by 55 M EMA (now at 0.6846) is taken as a bearish signal. But for now, fall from 0.8006 is still seen as the second leg of the corrective pattern from 0.5506 long term bottom (2020 low). Hence, in case of deeper fall, strong support should emerge above 0.5506 to contain downside to bring reversal. However, this view is subject to adjustment if current decline accelerates further.
EUR/USD Weekly Outlook
EUR/USD extended the consolidation pattern from 1.0176 last week. Initial bias remains neutral this week first. Outlook will remain bearish as long as 38.2% retracement of 1.1213 to 1.0176 at 1.0572 holds. On the downside, break of 1.0176 will resume whole fall from 1.1213. However, decisive break of 1.0572 will raise the chance of reversal, and target 61.8% retracement at 1.0817.
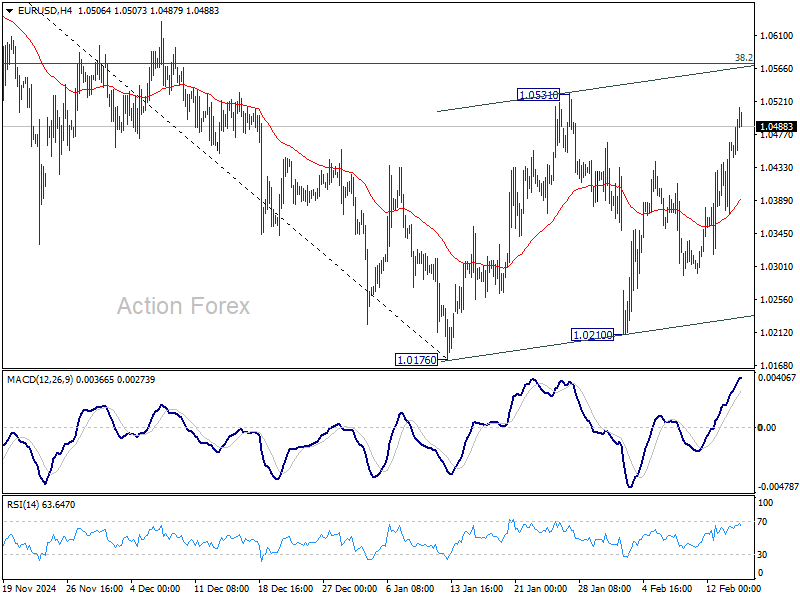
In the bigger picture, immediate focus is on 61.8 retracement of 0.9534 (2022 low) to 1.1274 (2024 high) at 1.0199. Sustained break there will solidify the case of medium term bearish trend reversal, and pave the way back to 0.9534. However, reversal from 1.0199 will argue that price actions from 1.1274 are merely a corrective pattern, and has already completed.
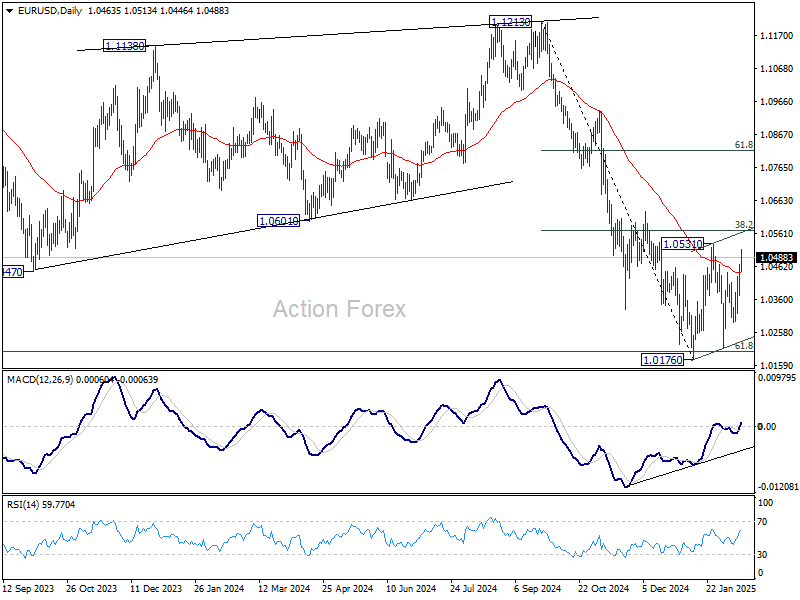
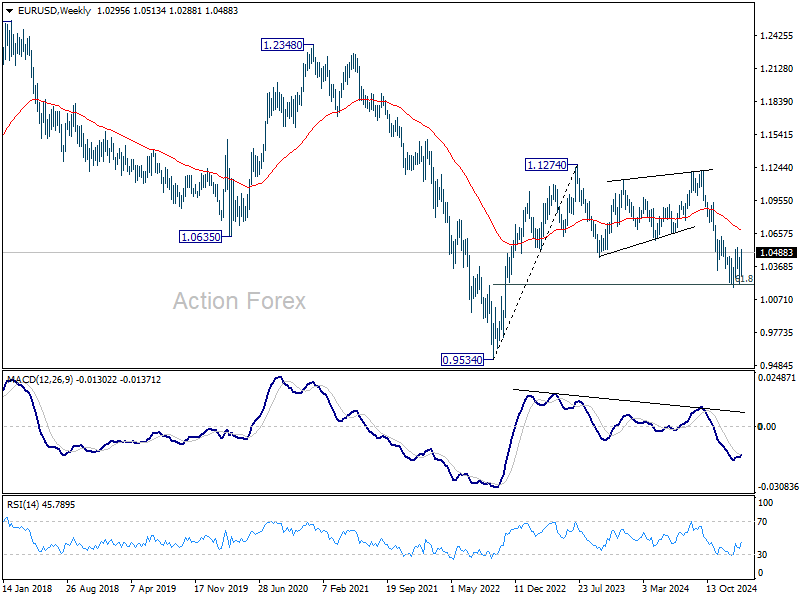
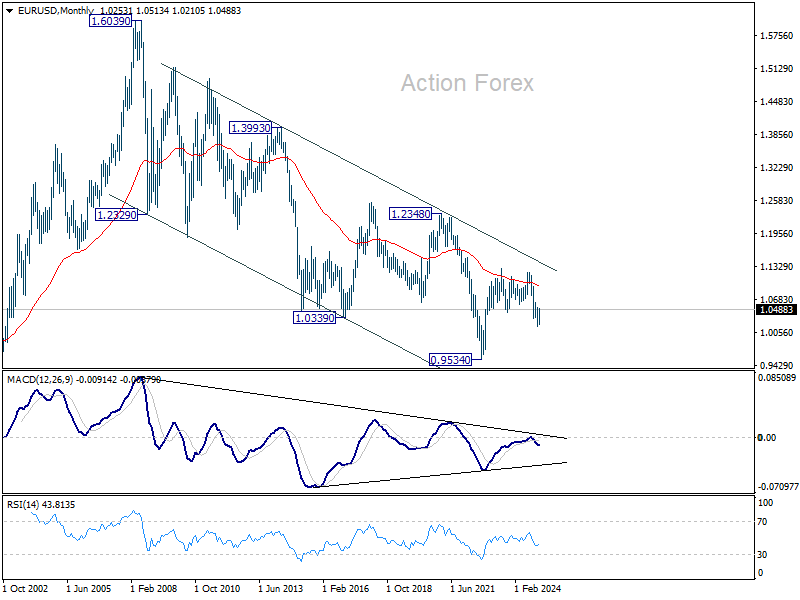
In the long term picture, down trend from 1.6039 remains in force with EUR/USD staying well inside falling channel, and upside of rebound capped by 55 M EMA (now at 1.0929). Consolidation from 0.9534 could extend further and another rising leg might be seem. But as long as 1.1274 resistance holds, eventual downside breakout would be mildly in favor.
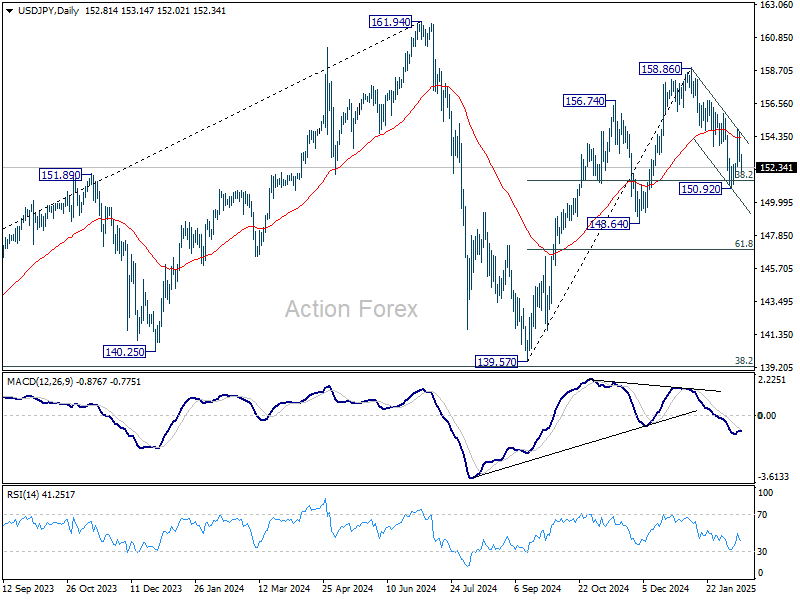
USD/JPY Weekly Outlook
USD/JPY's strong rebound to 154.79 was followed by deep retreat. The development mixed up the near term outlook and initial bias stays neutral this week first. On the upside, break of 154.79 will revive the case that correction from 158.86 has completed at 150.29. Further rise should be seen to retest 158.86 high. However, sustained trading below 38.2% retracement of 139.57 to 158.86 at 151.49 will raise the chance of trend reversal, and target 148.64 support instead.
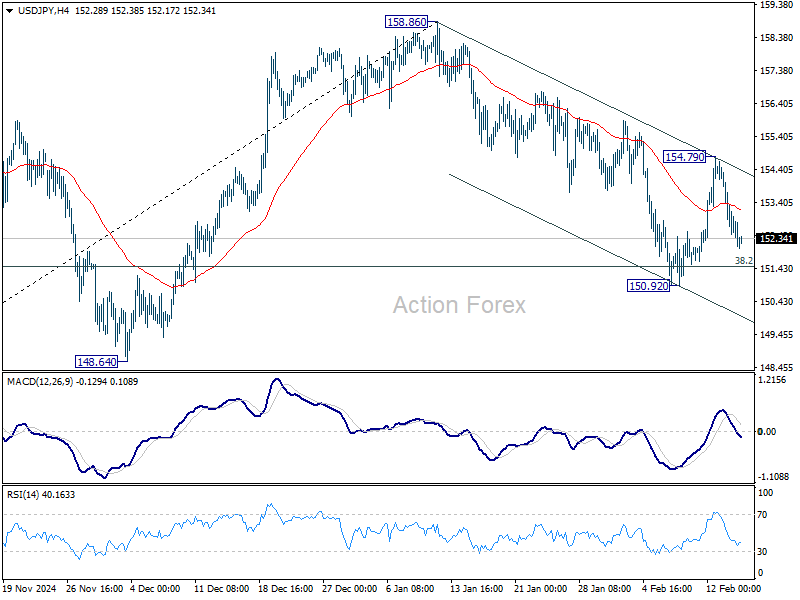
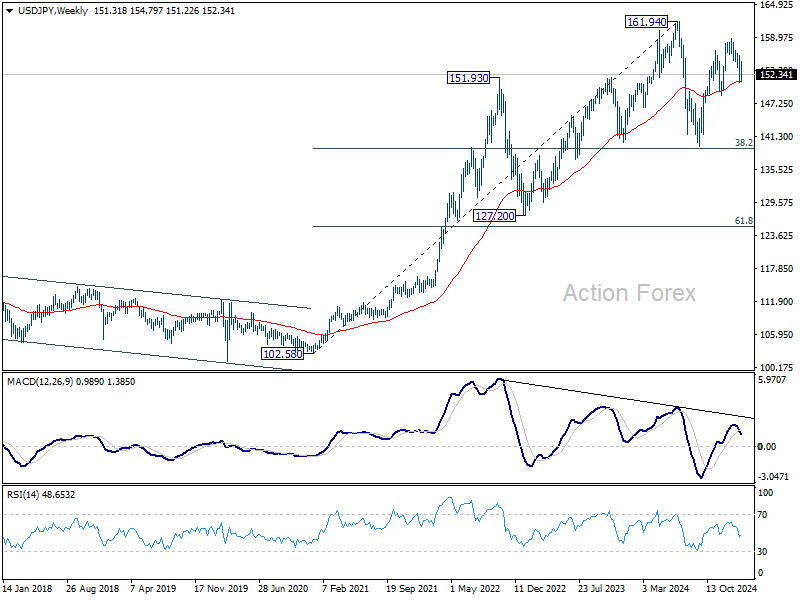
In the bigger picture, price actions from 161.94 are seen as a corrective pattern to rise from 102.58 (2021 low). In case of another fall, strong support should be seen from 38.2% retracement of 102.58 to 161.94 at 139.26 to bring rebound. However, sustained break of 139.26 would open up deeper medium term decline to 61.8% retracement at 125.25.
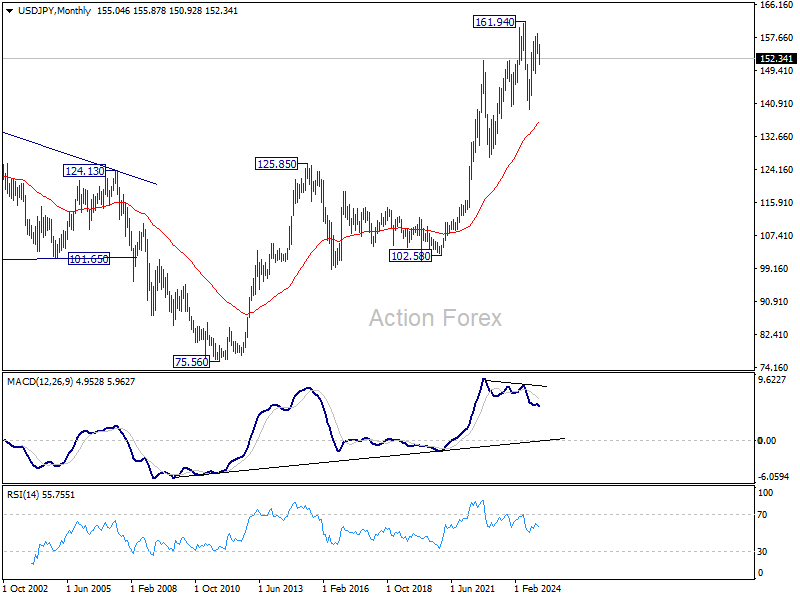
In the long term picture, it's still early to conclude that up trend from 75.56 (2011 low) has completed. A medium term corrective phase should have commenced, with risk of deep correction towards 55 M EMA (now at 136.50).
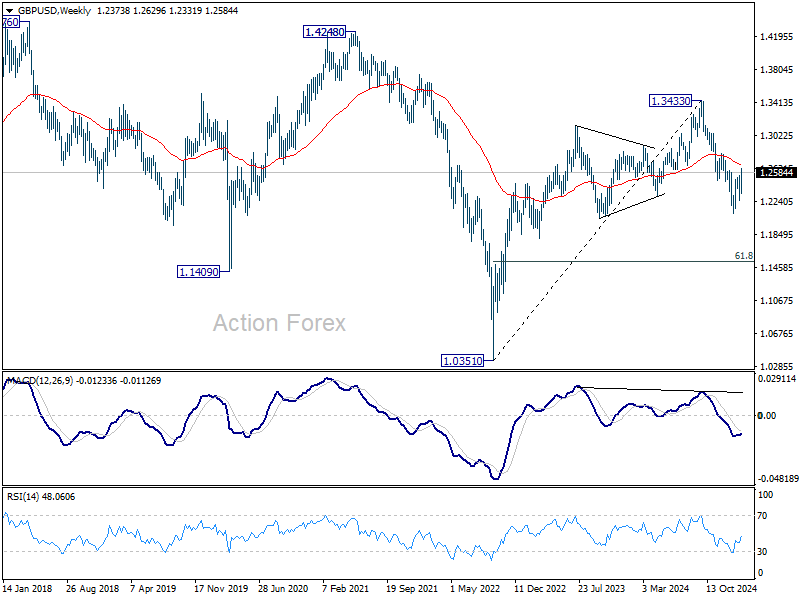
GBP/USD Weekly Outlook
GBP/USD's rebound from 1.2099 resumed last week but failed to sustain above 38.2% retracement of 1.3433 to 1.2099 at 1.2609. Immediate focus stays on 1.2609 this week. Firm break there will raise the chance of near term reversal, and target 61.8% retracement at 1.2923. Nevertheless, on the downside, break of 1.2331 support will suggest that the rebound has completed as a correction, and bring retest of 1.2099 low.
In the bigger picture, rise from 1.0351 (2022 low) should have already completed at 1.3433 (2024 high), and the trend has reversed. Further fall is now expected as long as 1.2810 resistance holds. Deeper decline should be seen to 61.8% retracement of 1.0351 to 1.3433 at 1.1528, even as a corrective move. However, firm break of 1.2810 will dampen this bearish view and bring retest of 1.3433 high instead.
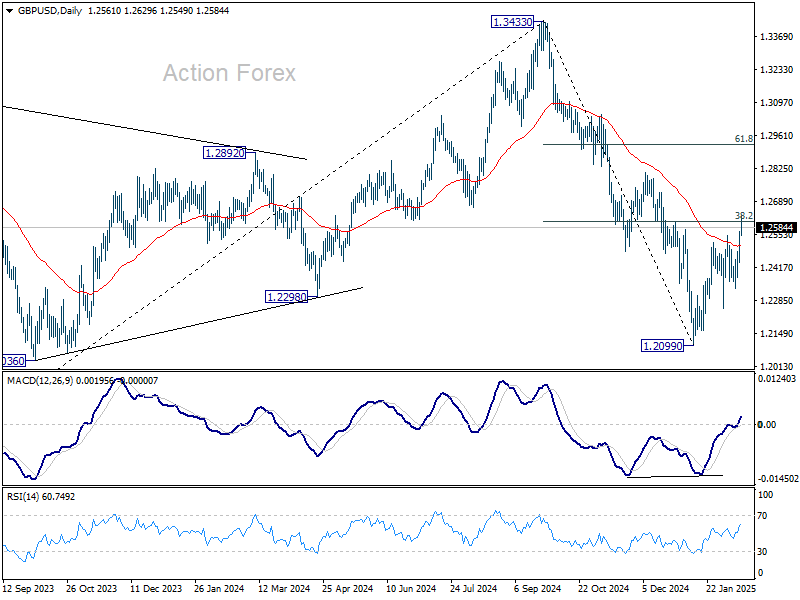
In the long term picture, price actions from 1.0351 (2022 low) are seen as a corrective pattern to the long term down trend from 2.1161 (2007 high) only. Outlook will be neutral at best as long as 1.4248 structural resistance holds, even in case of strong rebound.