Sample Category Title
Daily Technical Analysis: EURUSD, GBPUSD, USDJPY, USDCHF
EURUSD
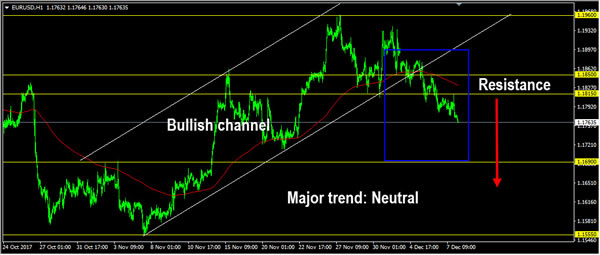
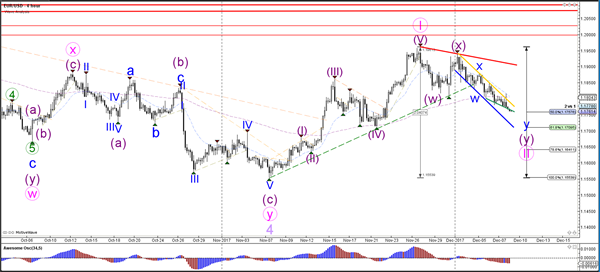
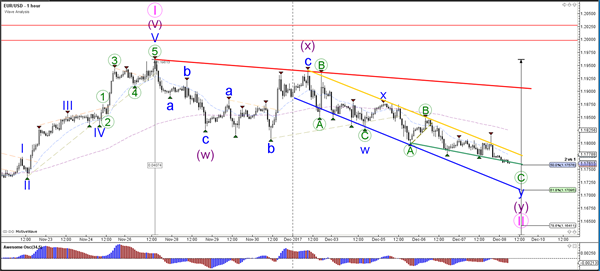
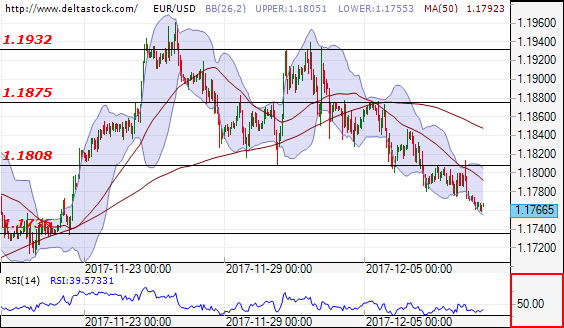
The EURUSD continued its bearish momentum yesterday bottomed at 1.1771 and hit 1.1761 earlier today in Asian session. The bias remains bearish in nearest term testing 1.1690 support area as a part of the bearish phase since broke below the bullish channel as you can see on my H1 chart below. Immediate resistance is seen around 1.1815 followed by 1.1850. On the downside, a clear break and daily/weekly close below 1.1690 would expose 1.1550 region next week. Fundamental focus today will be on the US NFP number. Overall I remain neutral.
GBPUSD
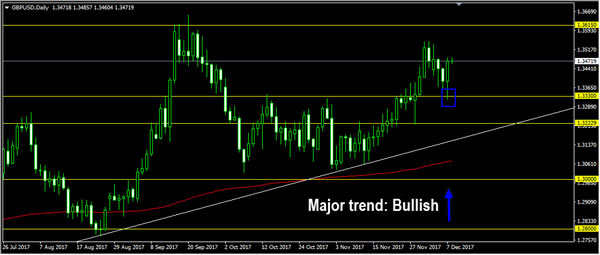
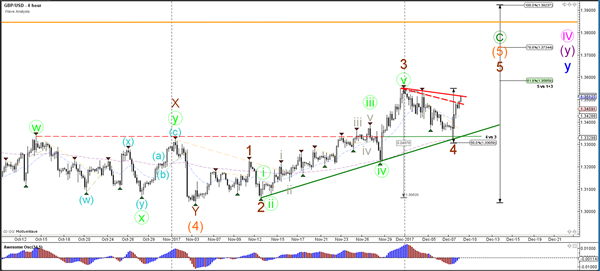
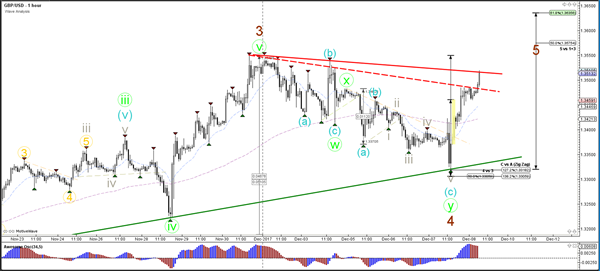
The GBPUSD attempted to push lower yesterday slipped below 1.3330 support area but whipsawed to the upside and closed higher at 1.3472. The bias is bullish in nearest term testing 1.3550 – 1.3615 region. Immediate support is seen around 1.3425. A clear break below that area could lead price to neutral zone in nearest term testing 1.3350/30 region. Overall I remain bullish and any downside pullback should be seen as a good opportunity to buy. Fundamental focus today will be on the US NFP number.
USDJPY
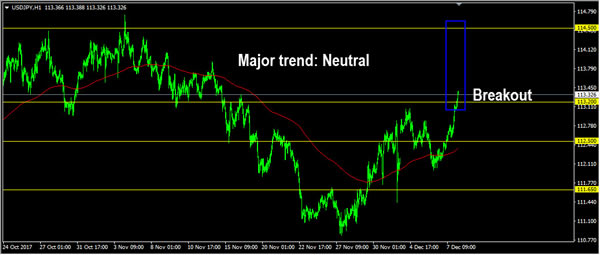
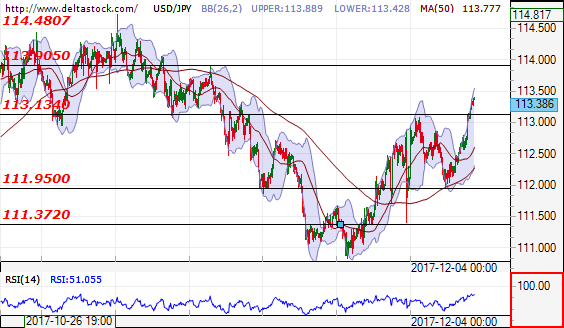
The USDJPY had a bullish momentum yesterday topped at 113.15 and broke above 113.20 resistance earlier today in Asian session, hit 113.38. The bias is bullish in nearest term testing 114.00/50 resistance area. Immediate support is seen around 113.00 – 112.85 area. A clear break back below that area could lead price to neutral zone in nearest term testing 112.35 area. Fundamental focus today will be on the US NFP number. Overall I remain neutral.
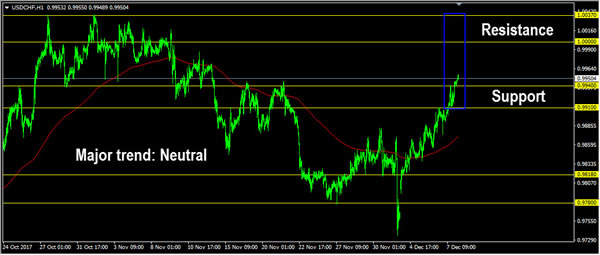
USDCHF
The USDCHF continued its bullish momentum yesterday broke above 0.9940 resistance and hit 0.9955 earlier today in Asian session. The bias is bullish in nearest term testing 1.0000 – 1.0037 resistance area. Immediate support is seen around 0.9910. A clear break back below that area could lead price to neutral zone in nearest term as direction would become unclear. Fundamental focus today will be on the US NFP number. Overall I remain neutral.
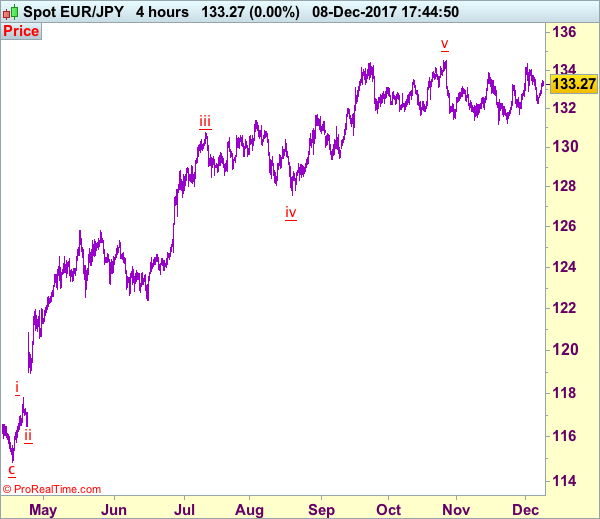
Trade Idea: EUR/JPY – Buy at 132.70
EUR/JPY - 133.27
New strategy :
Buy at 132.70, Target: 134.30, Stop: 132.20
Position: -
Target: -
Stop:-
Although the single currency fell to as low as 132.26, as euro found decent demand there and has staged a strong rebound, suggesting the pullback from 134.38 has possibly ended there and consolidation with mild upside bias is seen for gain to 134.00-05, however, break there is needed to add credence to this view and extend gain to said resistance. Looking ahead, only a break of recent high at 134.50 would retain bullishness and signal a resumption of early upturned has occurred, bring headway to 135.00-10 first.
In view of this, we are looking to buy euro again on dips. as 132.60-70 should limit downside. Only break of said support at 132.26 would abort and shift risk back to the downside for the fall from 134.38 towards 131.90-00, then test of support at 131.72 which is likely to hold on first testing.
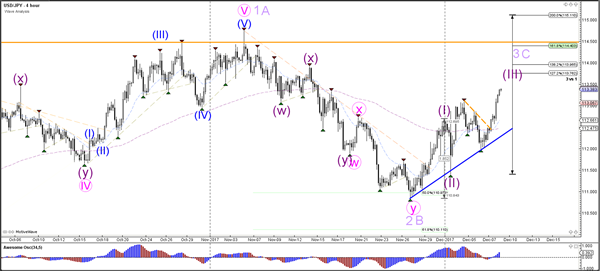
Our latest preferred count is that wave (ii) is ABC-X-ABC which ended at 123.33 and wave (iii) is unfolding with wave iii ended at 100.77, followed by wave iv at 111.57 and wave v as well as the wave (iii) has ended at 97.04, followed by wave (iv) at 111.43 and wave (v) has ended at 94.12 which is also the end of the larger degree v, this also implied the major wave (C) has also ended there, hence major correction has commenced from there with (A) leg unfolding in its lower degree wave c which has possibly ended at 145.69. Under this count, A-B-C wave (B) has commenced with A leg ended at 136.23, wave B at 143.79 and wave C has possibly ended at 149.79.
Our larger degree count is that the decline from 139.26 is wave (C) and is sub-divided into a diagonal triangle i-ii-iii-iv-v with wave i - 105.44, wave ii- 123.33, wave iii - 97.03, wave iv - 111.43, followed by the final wave v as well as the end of wave (C) at 94.12, this also mark the bottom of larger degree wave B. Under this count, major rise in wave C has commenced as an impulsive wave with minor wave III ended at 145.69, wave V is still in progress for further gain to 150.00. Having said that, this so-called wave V could well be the first leg of larger degree 5-waver wave C and this wave C should bring at least a retest of wave A top at 169.97 (July 2008).
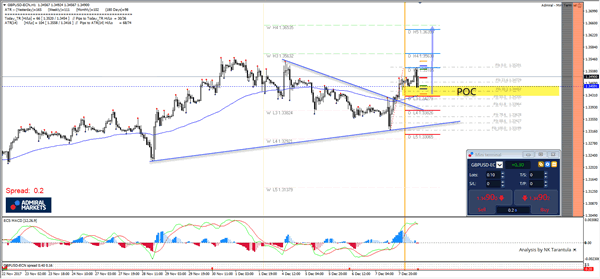
GBP/USD Bullish Momentum Aims For 1.3563 As The First Target
The GBP/USD is enjoying positive momentum, and bullish trend after Foster negotiated border issue with UK PM May through the early hours. It looks like the GBP/USD is aiming for the 1.3550-63 zone. Close above 1.3565 is needed for the continuation of the bullish trend towards 1.3640. Don't forget that today NFP numbers will be released so we might see rejection from 1.3520 first. The POC zone (38.2, D L3, EMA89, order block) .1.3430-60 could reject the price if we see it lower and as long as the pair is above 1.3380, we should see bullish price action.
W L3 - Weekly Camarilla Pivot (Weekly Interim Support)
W H3 - Weekly Camarilla Pivot (Weekly Interim Resistance)
W H4 - Weekly Camarilla Pivot (Strong Weekly Resistance)
D H4 - Daily Camarilla Pivot (Very Strong Daily Resistance)
D L3 – Daily Camarilla Pivot (Daily Support)
D L4 – Daily H4 Camarilla (Very Strong Daily Support)
AUD/USD Update. Lower We Go
Just a quick Friday afternoon update on our AUD/USD short trade that we spoke about last week.
Here's a short extract:
AUD/USD Daily:
Take a look at the levels that I've put the markers on. That's pretty obvious previous short term support turned resistance.
The qualifier for this trade is the fact that price is trending down and that the higher time frame resistance level around the 80c psychological level was rejected so heavily.
Fast forward to the present and take a look at how price reacted to the level:
AUD/USD Daily:
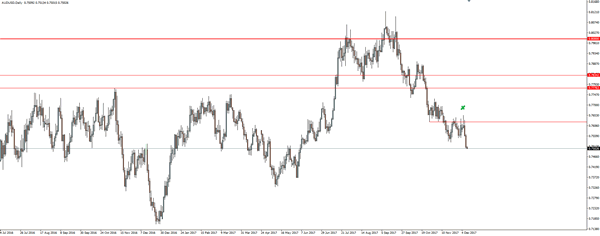
When you have a higher time frame resistance level hold, it then becomes all about selling previous short term support that has the potential to turn to resistance just like this.
Eyes On US Jobs Report And Brexit Developments, Asian Equities Rally
Here are the latest developments in global markets:
FOREX: The dollar rallied overnight against its counterparts on news that US lawmakers agreed to temporarily extend the government spending bill, a day before the deadline on Friday. The pound was on track to post a second day of gains as concerns over a hard-Brexit calmed after the UK and the EU appeared to be reaching a preliminary deal on key elements of the divorce. On the other hand, the euro was heading for a second consecutive weekly loss in the face of a strengthening dollar, while upbeat Chinese trade data did little for the aussie which edged down to a fresh six-month low.
STOCKS: The Nikkei 225 added to yesterday’s sharp gains, finishing the day higher by 1.4%; other Asian markets were also on the rise with Hong Kong’s Hang Seng being last up by 1.3% as upbeat Chinese trade data boosted sentiment in the region. Euro Stoxx 50 futures traded 0.6% up at 0747 GMT. Dow and S&P 500 futures were up by 0.1% and Nasdaq 100 equivalents traded higher by 0.5%.
COMMODITIES: Oil prices were steady on Fridayas a rising dollar offset gains from higher demand from China, which is likely to take the place of the world’s biggest crude importer this year. WTI crude stood at $56.68 per barrel and Brent inched up to $62.27. Gold was 0.25% up on the day at $1,249.30 per ounce, but still not far above the 4-½-month low it touched yesterday.
Major movers: Pound breaks 1.35 as Brexit fear go away; dollar hits fresh highs
After several days of intense talks, the European Commission announced early on Friday that sufficient progress has been made in Brexit talks as both sides reached an agreement on the Irish border issue, flagging that trade talks could begin after a formal approval of the deal at the EU summit starting on December 14. Pound/dollar surged to a four-day high above 1.35 (+0.25%).
The euro dipped to a fresh two-week low of 1.1735 on the back of dollar strength but persisting political uncertainty in Germany also acted as a drag on the currency, with the latest news stating that some members of Merkel’s inner cycle pressed for a minority government despite Merkel’s desire to govern with a stable majority. Besides that, trade data out of Germany failed to provide support as the trade surplus stood below expectations.
Chinese trade figures, though, came in better than expected, with the surplus increasing to a three-month high. Despite encouraging numbers, the aussie inched down to 0.7500 (-0.09%); Australia and China are major trading partners.
The dollar approached the 114 key level, breaking a three-week high of 113.90 (+0.41%). Against a basket of six major currencies, the dollar climbed by 0.20% to a fresh 2-½ -week high of 93.95 (+0.28%).
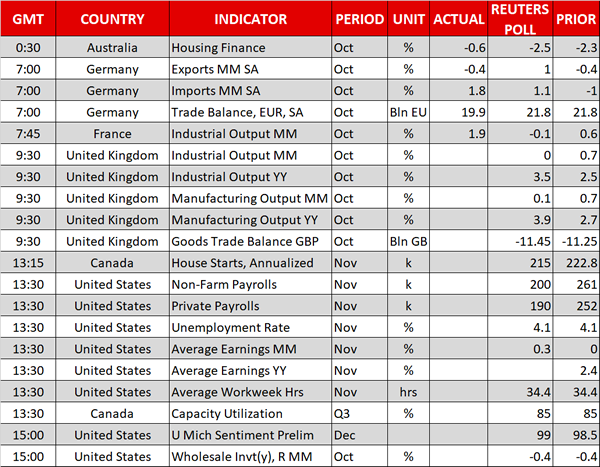
Day ahead: US jobs report, UK manufacturing output and Canadian housing starts on the agenda; Brexit developments eyed
The UK will see the release of October industrial and manufacturing output figures at 0930 GMT. Data on the nation’s goods trade balance for the same month will be made public at the same time as well.
Housing starts for the month of November out of Canada are due at 1315 GMT, but the main release of the day is the US jobs report scheduled for release at 1330 GMT. The world’s largest economy is expected to have added 200k positions in November, with the unemployment rate anticipated to remain at 4.1%, its lowest since late 2000. Average earnings, which are likely to attract more attention, are projected to grow by 0.3% m/m after October’s zero growth. The US will also see the preliminary December release of the University of Michigan’s survey on consumer sentiment at 1500 GMT.
Following reports on a deal on the Irish border, a key issue holding Brexit talks from progressing, developments on this front will be closely watched. UK PM Theresa May is in Brussels and is expected to be holding meetings with EU officials. A press conference will follow after her meeting with European Commission President Jean-Claude Juncker. Sterling has proved incredibly sensitive to Brexit developments.
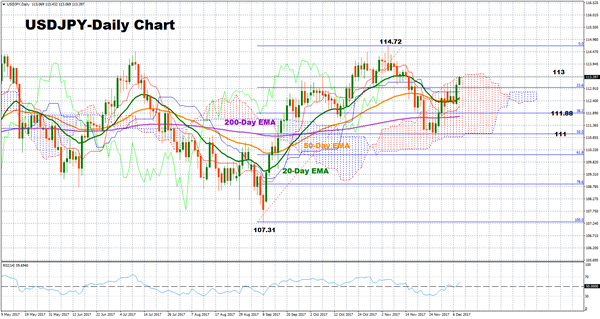
Technical Analysis: USDJPY turns bullish above 113
USDJPY rallied above the 113-key level and the exponential moving average lines, resuming its upleg off the 111 area. Positive signals are also given by the RSI which is currently heading higher, exceeding the 50 neutral-perceived level. Note though that the market is overbought in the 4-hour and the 1-hour charts. However, eyes are on nonfarm payrolls today. A disappointing NFP report could push the pair down to test the area between 112-113. Any close below this range could see the bottom of the recent uptrend at 111 come into focus and consequently turn the bias from bullish to bearish. Sharp decreases could also open the scope for a re-test of the 110 area. Alternatively, if the numbers beat expectations leading to a rise, the pair could find resistance at the nine-month high of 114.72.
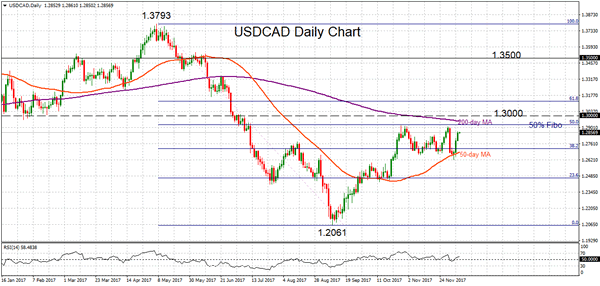
USDCAD Remains In Range From Late October
USDCAD is rising back to the upper end of its range that has been forming since late October. Momentum strength is relatively weak as can be seen by the RSI. The short-term neutral phase is expected to continue as long as the pair is capped by the 200-day moving average.
USDCAD has been unable to make a sustained break through the 50% Fibonacci retracement level (1.2922) of the downtrend from 1.3793 to 1.2061 and has been trading below this level since July. Strong upside momentum is needed for a successful extension above what is a strong resistance zone comprised of the 50% Fibonacci, the 200-day MA and the key psychological 1.3000 level. Such a move would open the way towards 1.3500 and then re-test the 1.3793 peak.
Dips are expected to find good support near the 38.2% Fibonacci (1.2718) and the 50-day MA (1.2685). A break below this area would increase downside pressure and send prices towards the 1.2500 handle and possibly the 1.2061 low.
USDCAD needs a catalyst to push above the range from late October but momentum is weak at the moment. Meanwhile, the underlying downtrend from 1.3793 has not shown any signs of reversing yet as long as the market remains below its 200-day MA, which is keeping the overall bearish outlook.
Dollar Advances Ahead Of NFP, While Oil Remains Steady
The Greenback ventured to a two-week high against a basket of major currencies on Friday morning, amid investor optimism over U.S. tax reforms.
Today's main risk event for the Dollar will be the U.S. non-farm payrolls report, to be released latertoday,which should offer fresh insight on the health of the U.S. job market. With the ADP data released earlier in the week displaying that U.S. private employers added 190k jobs in November versus the 185k forecast, markets will be paying extra attention to see if the pending NFP headline figure produces a similar pattern. The fact that November's U.S. employment report will be released before the last Federal Reserve meeting of the year, is quite significant and has the ability to impact market expectations of higher U.S. rates next year.
Although expectations remain elevated over the Federal Reserve raising U.S. interest rates by 25 basis points next week, a smog of uncertainty remains over what to expect from the central bank beyond 2017. Much focus is likely to be directed towards average hourly wages, as disappointing wage growth may heighten concerns over stubbornly low inflation consequently clouding the prospect of higher rates in 2018.
From a technical standpoint, the Dollar Index has broken above 93.80 which could encourage a further appreciation towards 94.00. A solid NFP report has the ability to instil Dollar bulls with enough inspiration to challenge the 94.00 resistance, with the next level of interest at 94.20. Alternatively, a November NFP disappointment with subdued wage growth may open a path back to 93.50.
Sterling jumps amid Brexit deal optimism
Sterling punched above 1.3500 during early trading on Friday as investors waited to see if Theresa May was able to secure a deal with the DUP and E.U. officials on the Irish border. An agreement between the United Kingdom and Ireland on the post-Brexit Irish land border is likely to come as a breath of fresh air for Sterling, as a major obstacle for opening trade talks with the E.U. will be eliminated. The GBPUSD has been supported by cautious optimism over the Brexit deal with prices trading around 1.3470 as of writing. A positive outcome in Brussels could boost the Pound further with 1.3590 in sight. Alternatively, a disappointing no deal outcome, is likely to send the Sterling tumbling like a house of cards back towards 1.3300.
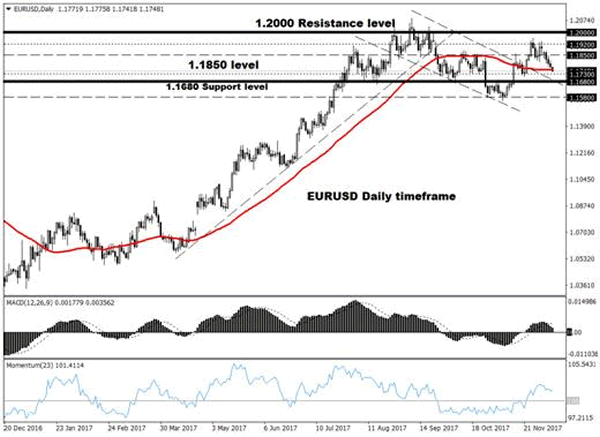
Currency spotlight – EURUSD
This has certainly been a bearish trading week for the EURUSD which has tumbled for five consecutive days. There is a suspicion that the key culprit behind the pair's downside could be a strengthening U.S. Dollar. Taking a look at the technical picture, prices are turning increasingly bearish on the daily charts with the next key level of interest at 1.1730. A decisive breakdown and daily close below 1.1730 is likely to encourage a further selloff towards 1.1680 and 1.1580, respectively.
Commodity spotlight – Oil
WTI Crude appreciated on Thursday with prices trading towards $56.70 on the back of a threatened strike in Nigeria which sparked fears of supply disruptions. Although short-term bulls may exploit the developments in Nigeria and growing Middle East political tensions to elevate oil higher, the question is for how long? With recent data showing an unexpectedly large rise in U.S. inventories of refined fuels last week, Oil markets still remain gripped by the oversupply woes. When keeping in mind how soaring output from U.S. Shale continues to complicate OPEC efforts to rebalance markets, oil is still exposed to downside risks. Taking a look at the technical picture, a failure of prices to stay above $56.00, may trigger a further depreciation towards $55.20. Alternatively, a breakout back above $57 could open a path to $57.60.
EUR/JPY Candlesticks and Ichimoku Analysis
Weekly
• Last Candlesticks pattern: Window
• Time of formation: 24 April 2017
• Trend bias: Up
Daily
• Last Candlesticks pattern: Hammer
• Time of formation: 18 May 2017
• Trend bias: Up
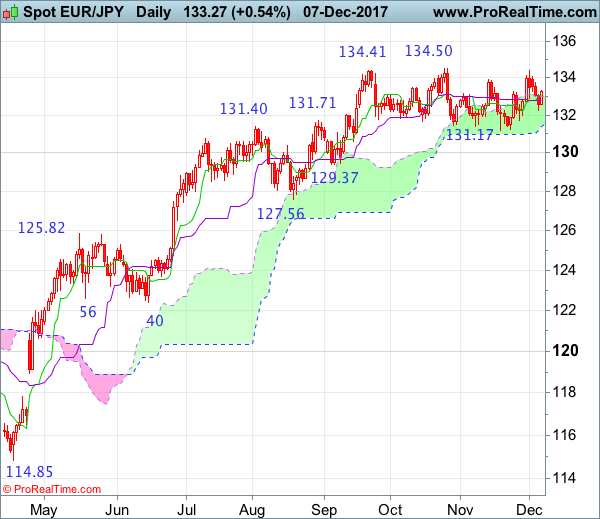
EUR/JPY – 134.00
Although the single currency retreated after early anticipated rally to 134.38, as euro found good support at 132.26 and has rebounded, retaining our bullishness and consolidation with mild upside bias is seen for gain to 134.00 but break of indicated resistance at 134.50 is needed to confirm recent upmove has resumed and extend gain to 135.00, however, near term overbought condition should limit upside to 136.00-10 and reckon 136.90-00 would hold from here, price should falter well below 138.45-50 (1.618 times extension of 109.49-124.10 measuring from 114.85), risk from there has increased for a much-needed correction to take place later.
On the downside, whilst pullback to the Tenkan-Sen (now at 133.05) cannot be ruled out, reckon the Kijun-Sen (now at 132.78) would limit downside and bring another rise later. Only below said support at 132.26 would abort and signal top has been formed at 134.38 earlier this month, bring weakness to 132.00, then test of support 131.72. Looking ahead, a drop below 131.72 would signal the rebound from 131.17 has ended, bring weakness to 131.40, then retest of this level but still reckon downside would be limited to 130.40-50 and psychological level at 130.00 should hold from here.
Recommendation: Hold long entered at 133.00 for 135.00 with stop below 132.25.
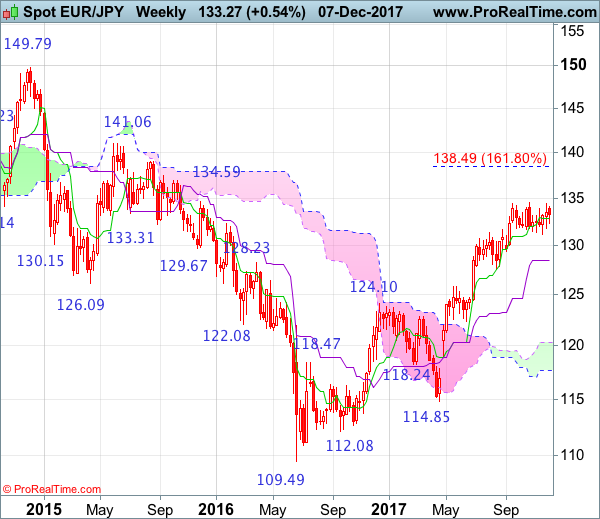
On the weekly chart, as the single currency found renewed buying interest at 131.72 last week and the pair has rebounded again, retaining our bullish view that the pullback from 134.50 has possibly ended at 131.17, hence upside bias remains for another test of said resistance , however, break there is needed to confirm recent upmove from 109.49 (2016 low) has resumed and extend gain to 135.00, then 136.00-10 but reckon upside would be limited and 136.95-00 should hold, price should fatter below 138.45-50 (1.618 times extension of 109.49-124.10 measuring from 114.85), bring retreat later.
On the downside, expect pullback to be limited to 132.90-00 and support at 132.26 should hold, bring such a rise. Below said support at 132.26 would defer and prolong consolidation, risk test of support at 131.72 but only break of indicated strong support at 131.17 would shift risk to downside and suggest a temporary top has been formed earlier at 134.50, bring retracement of recent rise to support at 130.90-00, then 130.20-25 but reckon downside would be limited to 129.37 support and previous support at 127.56 should remain intact.
Daily Wave Analysis: GBP/USD Dips To 50% Fibonacci And Bounces Impulsively
Currency pair GBP/USD
The GBP/USD bounced at the Fibonacci levels of wave 4 vs 3 (brown) as expected in this week's wave analysis. Price is now challenging the resistance trend line (red) and a bullish breakout could see price move towards the Fib levels of wave 5 (orange/brown).
The GBP/USD bearish correction finished at the Fibonacci levels of wave 4 and wave C. The bullish bounce is showing strong bullish momentum, which could indicate that a breakout is likely either now or after a corrective pattern at resistance (red).
Currency pair EUR/USD
The EUR/USD is still in the bearish trend channel. Price action remains choppy and corrective, which is making a wave 1-2 (pink) pattern more likely. The next potential support zone could be at the 50% Fibonacci level but a break below the 100% Fib invalidates this wave pattern.
The EUR/USD has finally reached the 50% Fibonacci level. The Fib levels of wave 2 vs 1 could act as support levels for a potential bullish bounce.
Currency pair GBP/USD
The USD/JPY broke above the resistance trend line (dotted orange) and is building bullish momentum towards the wave 3 (purple) Fibonacci targets.
The USD/JPY bullish breakout could still face some resistance from the previous highs
Forex Technical Analysis: EUR/USD, USD/JPY, GBP/USD
EUR/USD
Current level - 1.1766
The outlook is negative for test of the support level at 1.1736, after the unsuccessful breakthrough of the resistance level from yesterday at 1.1875.
| Resistance | Support | ||
| intraday | intraweek | intraday | intraweek |
|
1.1808 |
1.2090 |
1.1735 |
1.1690 |
|
1.1875 |
1.2090 |
1.1735 |
1.1550 |
USD/JPY
Current level - 113.38
The forecast is positive for test of the support level at 113.90 after the successful breakthrough of the resistance level at 113.13.
| Resistance | Support | ||
| intraday | intraweek | intraday | intraweek |
|
113.90 |
113.90 |
111.95 |
109.50 |
|
114.50 |
114.70 |
109.50 |
107.30 |
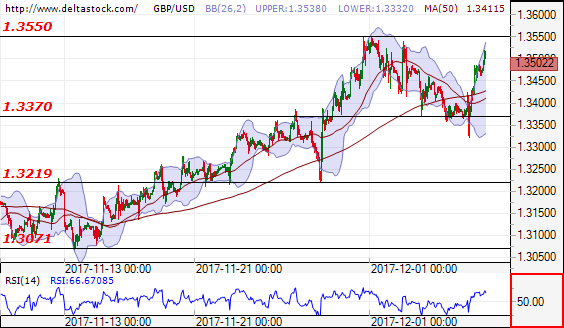
GBP/USD
Current level - 1.3502
The currency pair is before a test of the resistance level at 1.3550. If the breakthrough of that level is successful, the next resistance level will be at 1.3623. In negative direction the support is at 1.3370.
| Resistance | Support | ||
| intraday | intraweek | intraday | intraweek |
|
1.3550 |
1.3460 |
1.3370 |
1.3219 |
|
1.3623 |
1.3660 |
1.3219 |
1.3020 |