Sample Category Title
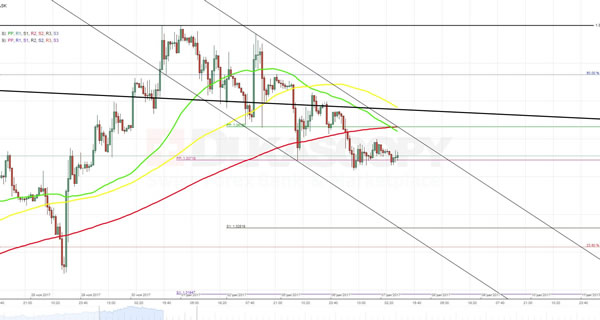
GBP/USD Analysis: Struggles To Bypass Monthly PP
In line with expectations, the overall optimism related to progress made on tax reform and decreased probability of a government shutdown continued to push the cable downwards. Although the pair has crossed the 200-hour SMA, the further plunge was temporarily stopped by the monthly PP at located at the 1.3372 level. But since information background remains positive and the currency rate is located within junior descending channel, it is expected to continue moving to the bottom towards the 1.3340 mark. In any case, an active surge is unlikely as northern side became protected by a combination of the weekly PP, the 55- and 200-hour SMAs. The only factor that might break the above resistance would be political news especially the one that are related to Brexit.
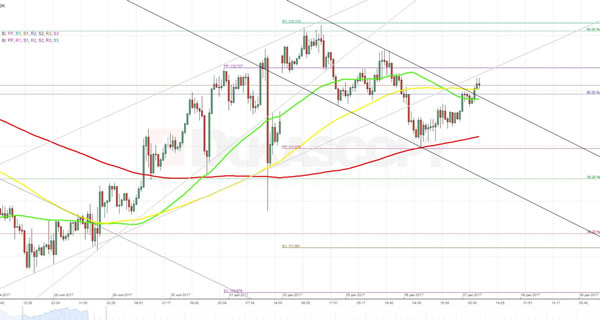
USD/JPY Analysis: Heads Towards 112.70 As Expected
As it was forecasted yesterday, after making a rebound from combined support set up by the weekly PP, the 200-hour SMA and the lower line of a junior descending channel the pair started moving in the opposite direction and managed to bypass two other MAs. The surge happened despite release of negative employment data, which means that markets are mainly focused on situation related to tax reform and the US government shutdown. Today the upward movement is expected to continue as well, even though there is a high chance that it will be stopped, first, by resistance zone near the monthly PP and then by the 50% Fibonacci retracement level located at 113.00. However, a change in information landscape or aggravation of situation with North Korea might alter this generally bullish scenario.
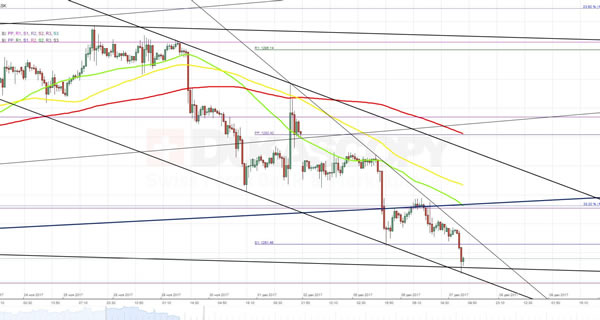
XAU/USD Analysis: Ready To Test Strength Of Dominant Pattern
In essence, the buck is actively appreciating against the gold the third day in a row. A short-term bullish movement towards the 38.2% Fibonacci retracement level at 1,268.00 was the only exception and was attributed to beginning of drills on the Korean peninsula. But, in general, the pair is driven by optimism over the progress of tax bill. Accordingly, today the rate is expected to continue heading downwards until it makes a rebound from the bottom boundary of a currently active two-month long descending channel near 1,255.00. However, the above market sentiment has a good chance to push the rate even more down. If this breakout happens and the pair gains a foothold below the weekly S2, this might be a sign of existence of another unconfirmed four-month long descending channel.
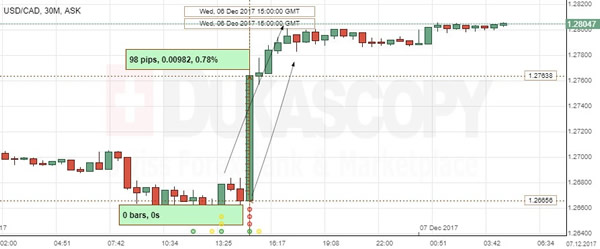
USD/CAD: Bank Of Canada Interest Rate Decision
The Canadian Dollar marked a solid depreciation against the US Dollar, as the country's Central Bank announced its interest rate decision. The USD/CAD currency pair added almost 100 base points in total, trying to offset the losses made during the last week.
The Bank of Canada kept ist cautious mode over the next rate increase, even in the presence of the first signs of healthy recovery. The Bank's polycimakers led by the Governor Stephen Poloz left the key interest rates unchanged at 1% on Wednesday, in line with expectations. The BoC is set to remain dovish, evaluating the economy's sensitivity to higher interest rates, assesing the economic capacity and the growth trends of both wages and inflation.
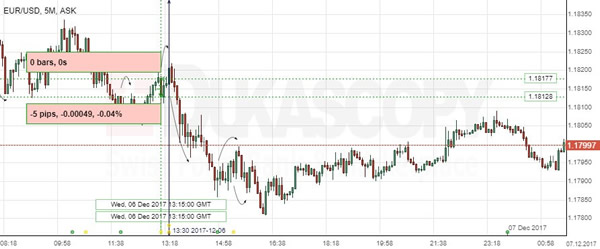
EUR/USD: ADP Non-Farm Employment Change
The Greenback fell modestly against the Euro on the ADP report revealing some weakening in the employment change in November. The EUR/USD lost 5 base points to return ito 1.1810 area and declined further to be seen trading below the 1.1800 area, as the next release was not strong enough to bring the pair back to stronger levels.
The US private sector created 190K jobs in November, down strongly from the prior month, but in line with projections, the ADP report indicated, ahead of more comprehensive the US Labour Departments figures to be issued on Friday. Meanwhile, another data showed the revision of the US unit labour costs, which was at an annualised 0.2% rate in the Q3, compared to the initially reported 0.5% rise.
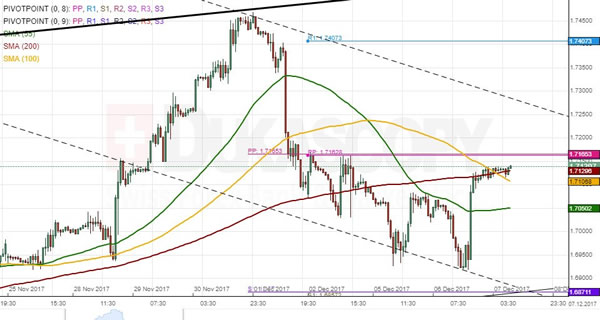
GBP/CAD 1H Chart: Pound pressured by resistance
GBP/CAD has been trading in a channel down since mid-August. The pair, however, has failed to reach the bottom boundary of this pattern several times, thus resembling more an ascending wedge. In the short term, the Pound bounced off the upper channel boundary last week and began trading lower. Given that solid Canadian GDP data release on December 1 strengthened the Loonie, the rate failed to form a proper pattern. Meanwhile, the Pound has lost its strong momentum during the past trading hours, as the combined resistance of the weekly and monthly PPs, the 200– and 100-hour SMAs pressure the given currency near the 1.7150 mark. This might force the pair into a period of consolidation, but nevertheless guide it towards the upper boundary of the short-term channel circa 1.72. In case bears prevail, the nearest support is the weekly and monthly S1s at 1.6860.
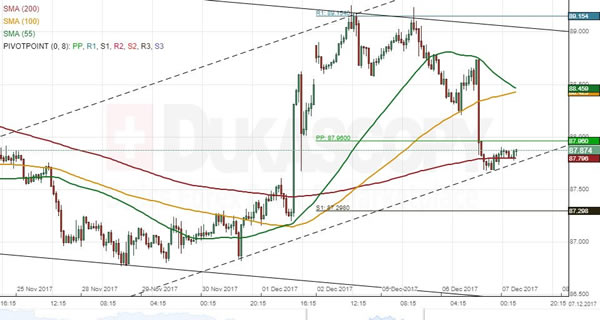
CAD/JPY 1H Chart: Descending Channel Dominates
The Canadian Dollar has weakened against the Japanese Yen during the past two-and-a-half months, thus forming a descending channel. This pattern is a part of a long-term falling wedge which was formed mid-December, 2016. After bouncing off the bottom boundary of the medium-term channel, the Loonie managed to push up to the weekly R1 at 89.15 within a couple of sessions and thus reach the northern boundary of this pattern. From technical point of view, the pair should continue its movement south down to the bottom channel boundary located in the 86.00/86.50 territory. This scenario is likewise confirmed by weekly technical indicators. However, the pair found resistance at the 200-hour SMA in this session. Thus, it might still edge slightly higher before allowing bears to take the upper hand
Swiss Data And SNB Preview: FX Reserve Fell From Record High As SNB Unless Less Pressure To Intervene
SNB's FX reserve slipped to 738.17B franc, from a record high of 741.96B franc (revised from previous estimate of 741.32B franc), in November. The drop is in contrast with consensus of an increase to 745B franc and marks the first drop since June this year. Meanwhile, the sight deposit fell to 576.78B franc in the week ended December 1. Subsequent decline from the August peak has sent sight deposit to the lowest level since June 2017. The movements of both FX reserve and sight deposit have suggested that the SNB is not in a hurry to intervene with the recent weakness in Swiss franc. Separately, the country's unemployment rate stayed unchanged at 3% (seasonally adjusted) in November, compared with expectations of a rise to 3.1%. For the quarterly SNB meeting scheduled on December 14, we expect policymakers to maintain the status quo, i.e. keeping 3-month LIBOR target range unchanged, at between -1.25% and -0.25%, maintaining the interest rate on sight deposits with the SNB at -0.75% and reaffirming that the central bank is committed to intervene in the FX market as necessary. We believe the domestic economic developments since the September meeting have shown gradual improvements, leaving policymakers more room to wait and see.
GDP Growth
Swiss GDP growth picked up to+1.11% y/y in 3Q17, from +0.68% in 2Q17 and +0.48% in 1Q17. While it is true that the most of the growth was driven by the increase in the volatile “net acquisitions of valuables”, other indicators are underpinning the strong growth momentum. For instance, the KOF indicator jumped to a 6-year high of 11.89 in November, after drifting modestly lower in the prior month. The Markit manufacturing PMI jumped to 65.1, the highest since July 2010, in November from 62 in the prior month. The market had anticipated a modest increase to 62.5.
Inflation
Subdued inflation has remained the key reason to leave the policy rate at historical low. Headline CPI steadied at +0.8% in October and averaged at +0.5% y/y in 3Q17. SNB's measure of 6-12 month inflation expectations had risen from +0.3% to +0.5%. Consumer expectations on inflation outlook have also improved. As the latest SECO survey suggested, consumers expectations of positive price developments has risen to 56% in the three months through October, from 45% in the three months though July. However, all measures still suggest the Swiss price levels has remained soft and far below the +2% target.
Exchange Rate
Swiss franc has depreciated -1.8% against the euro and -2.6% against the greenback. Just like what it did at the September meeting, we expect the SNB to soften its complaint over Swiss franc's strength, but reiterate that the franc is still “overvalued” and pledge vigilance over the exchange rate movement. As Governor Thomas Jordan noted in Basel on November 23, the country's' high current account surplus “is not a reflection of an overly weak Swiss franc”. Rather it is driven by several reasons including statistical distortion - overstatement, structural reasons – aging population and the skew towards pharmaceuticals and merchanting industries which are relatively insensitive to exchange rate fluctuations. Jordan reiterated in his speech that “the Swiss franc remains highly valued” and “inflation is still low and production capacity is not yet fully utilized”.
Mint Ratio Signals Gold’s Moment Of Truth
Gold has finally broken 1260.00 long-term support in early Europe as the gold/silver (mint) ratio hits new highs suggesting a much more substantial down move could now occur.
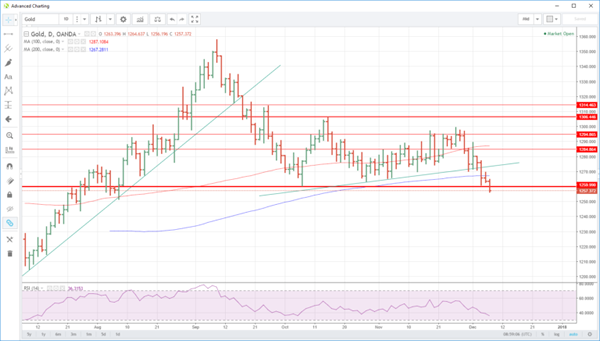
GOLD
Gold attempted a comeback rally after Tuesday's calamitous sell-off, but it was quickly snuffed out and failed ahead of 1270.00. Instead, the yellow metal ended the day with a whimper, closing near its lows at 1263.70 and appearing to be preparing itself for a severe test of critical long-term support. Gold traders will face a nervous end to the week as gold fails to rally even as the U.S. yield curve continues to flatten and ahead of crucial payroll data tomorrow evening.
With Asian shares solidly in the red and a general risk-off mood permeating the markets, it is significant that gold cannot find any support. The safe-haven bid that would typically appear in times such as these has disappeared from the market's thoughts. It is yet another black market against the yellow metal.
Gold has now closed two days in a row under its 200-day moving average at 1267.30 and now intra-day resistance. This is followed by 1270.00 and then 1273.30.
The downside looks far more ominous, with gold breaking the critical long-term support at 1260.00 in early Europe, trading to a low of 1256.00 as stop losses set in. We have had a small rebound to 1259.00 but have been unable to recapture 1260.00. A daily close below this level could set of structural unwinding of long positioning, and the technical picture shows no meaningful support for gold until the 1200.00 regions.
While it is still too soon to suggest a significant sell-off is on the cards, the charts do imply that gold may well be about to break out of its three-month trading range.
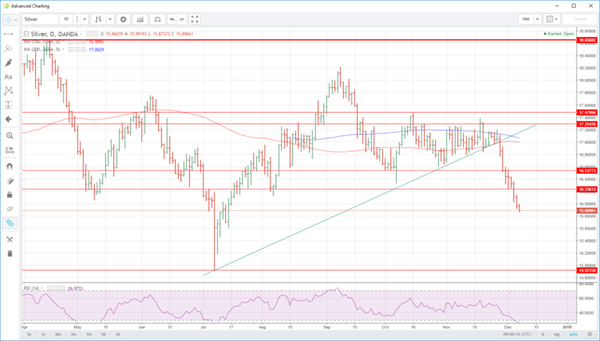
Silver
Silver has led gold lower over the last week. The break of its five-month trendline support at 17.0000 also took out it's 100 and 200-day moving averages. Silver has since plunged over the past week to the 15.8900 lows we have seen today. Resistance is at 16.2360 and 16.5380, but the charts have no meaningful support until 14.9200, still another dollar away.
Temporary salvation may be at hand though. The daily Relative Strength Index (RSI) is now at very oversold levels. This is an excellent short-term indicator when used with precious metals and commodities. It suggests that Silver may have done enough for now and that a bounce could be on the cards in the short-term at least
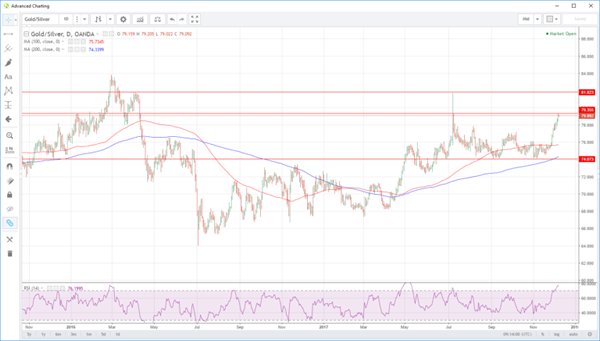
Gold/Silver (Mint) Ratio
The mint ratio has hit six-month highs overnight, moving to the 79.00 regions. Traders should note that the ratio's daily RSI is at extreme overbought levels. This implies that either silver is hugely oversold (see above), or that gold is not yet at fair values, ie overbought versus silver. (see gold above)
Whichever way you chose to cut it, the mint ratio and its RSI are telling us that that gold could go lower and or that silver should remain unchanged or move higher.
The mint ratio also has interim resistance just above at 79.35 will strong resistance at 81.80. Support is at 75.75 and then 74.00 which is a massive level, being multiple daily lows over the last six months.
The fact that support is so far away as compared to resistances again reinforces the case that the mint ratio could be signalling more downside for gold.
NZDUSD Sees Strengthening Bearish Momentum In Near Term
NZDUSD has a negative undertone as the flow is back to the downside following a break below the key 0.6900 level.
On the 4-hour chart, the RSI is bearish while the 20 and 50-period moving averages are negatively aligned.
The rapid pullback from yesterday’s 0.6916 high suggests NZDUSD does not have enough momentum to resume the uptrend from 0.6780 to 0.6945 (November 17-28 rise).
As long as NZDUSD remains above the 0.6816 low then the pair is expected to remain neutral and to consolidate the recent gains. A move back above 0.6900 would shift focus back to the upside to target 0.6916 and set the market on a path towards 0.7000.
Meanwhile, breaking below the 0.6816-0.6800 zone could see a re-test of the 0.6780 low and likely see the start of a new downtrend.
The fact that the market has retraced more than 61.8% of the 0.6780 to 0.6945 upleg keeps the NZDUSD vulnerable to additional weakness.