Sample Category Title
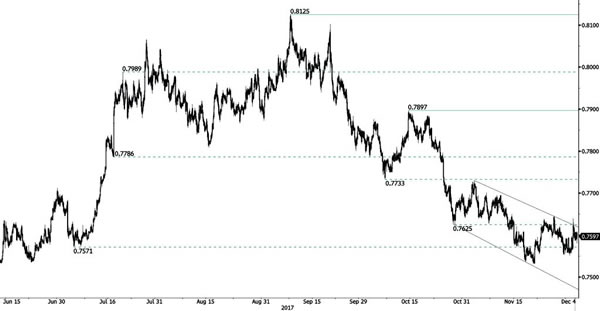
AUD/USD Riding Downtrend Channel
AUD/USD is ready to go even lower showing that downside pressures are still lively. Hourly resistance is given at a distance at 0.7897 (13/10/2017 high). Expected to show renewed pressures towards key support at 0.7535 (22/06/2017 low).
In the long-term, the trend is turning positive. Key supports stands at 0.6009 (31/10/2008 low) . A break of the key resistance at 0.8164 (14/05/2015 high) is needed to invalidate our long-term bearish view.
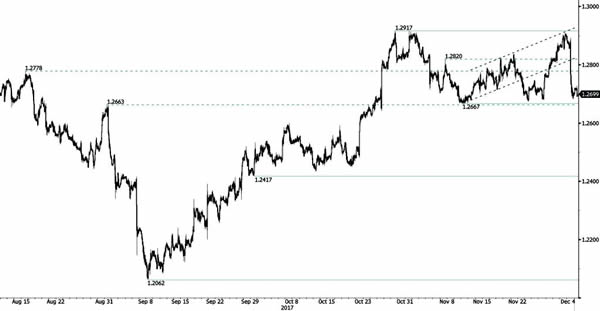
USD/CAD Monitoring Resistance At 1.2667
USD/CAD is approaching hourly support lies at 1.2667 (10/11/2017 low). Hourly resistance stands at 1.2917 ( 27/10/2017 high).Expected to show further bearish pressures.
In the longer term, the pair has broken longterm support that can be found at 1.2461 (16/03/2015 low). Strong resistance is given at 1.4690 (22/01/2016 high). The pair is likely to head further lower.
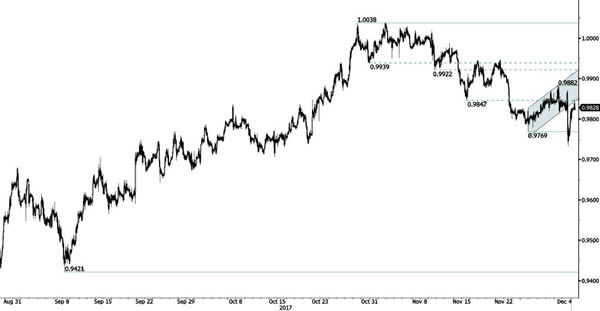
USD/CHF Lack Of Follow-Through
USD/CHF has been very volatile lately. The technical structure indicates further downside risks. The pair has failed to hold consistently above the parity. The road is wide-open for further decline.
In the long-term, the pair is still trading in range since 2011 despite some turmoil when the SNB unpegged the CHF. Key support can be found 0.8986 (30/01/2015 low). The technical structure favours nonetheless a long term bullish bias since the unpeg in January 2015.
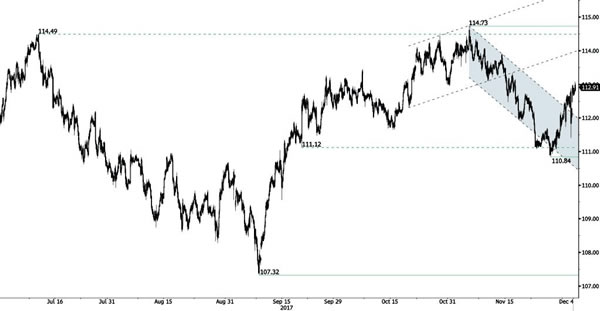
USD/JPY Short-Term Increase
USD/JPY keeps on pushing higher. The pair has strongly bounced back. Hourly resistance is given at 112.70 (30/11/2017 high).
We favor a long-term bearish bias. Support is now given at 99.02 (10/08/2013 low). A gradual rise towards the major resistance at 125.86 (05/06/2015 high) seems unlikely. Expected to decline further support at 93.79 (13/06/2013 low).
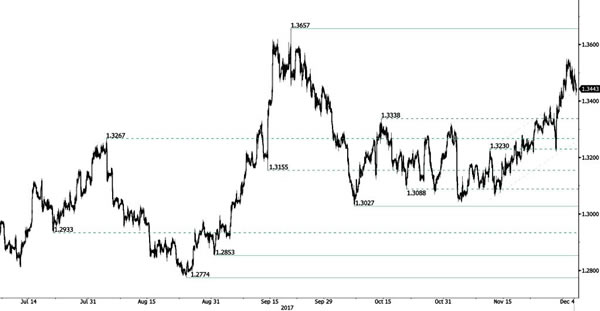
GBP/USD Strong Buying Demand
GBP/USD has been trading lower over the past few days but the technical structure indicates an extension of bullish momentum. Support is given at a distance at 1.3027 (06/10/2017 low). Expected to show continued increase above towards resistance at 1.3657 (20/09/2017 high).
The long-term technical pattern is reversing. The Brexit vote had paved the way for further decline. Long-term support can be found at 1.1841 (07/10/2017 low). Long-term resistance given around 1.35 is at stake and indicates a long-term reversal in the negative trend. Yet, it is very unlikely at the moment.
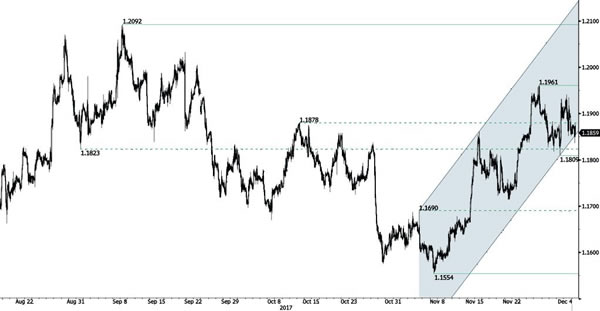
EUR/USD Ready To Bounce Back
EUR/USD's bullish momentum continues. Hourly resistance is now given at 1.1961 (27/11/2017 high). Hourly support is given at 1.1809 (30/11/2017 low). Expected to show continued increase.
In the longer term, the momentum is now turning largely positive. We favour a continued bullish bias. Key resistance is holding at 1.2252 (25/12/2014 high) while strong support lies at 1.0341 (03/01/2017 low).
EUR/USD Starts New Week At 1.1870
On Friday, the pair fluctuated quite intensively amid contradicting reports that the US Senate is ready to vote for tax reform, while General Flynn pledged guilty to lying to the FBI. Despite that an anticipated resistance at 1.1936 and the 200-hour SMA at 1.1860 managed to retain the rate. A s a result, it is still fluctuating in a junior ascending channel and is about to clash with the upper boundary of a dominant descending channel.
As for today, the pair started new trading week in a limbo between the 100- and 200-hour SMAs. Although the upper side is additionally filled with the 55-hour SMA at 1.1884, the 61.8% Fibonacci retracement level at 1.1887 and the weekly PP at 1.1890, the Euro is still projected to pave the path to the north.
However, this assumption holds true unless traders interpreted Friday's plunge as a rebound from larger pattern.
GBP/USD Reaches Two Month Maximum At 1.3550
As it appears from hourly chart, the 1.3550 mark signified the two month maximum that the cable could not surpass. In result of a rebound, a new junior descending channel has been formed.
The pattern is expected to stay in force at least until the rate will reach support set up by the 100-hour SMA and the weekly PP near 1.3420.
If this barrier becomes broken, a more mature support zone should be formed by the 200-hour SMA and the monthly PP at 1.3371.
However, there is an assumption about formation of two other medium ascending channels whose lower boundaries might intersect with the 23.6% Fibonacci retracement level located at 11.3256 and the monthly S1 at 1.3195. In that case, bears are likely to take the lead for the upcoming two-three weeks.
USD/JPY Falls From Rising Wedge By 1.22%
An announcement made by General Flynn that led to rapid sell-off of the buck against all major currencies perfectly matched with a breaking point of a readjusted rising wedge formation.
Fortunately, bulls managed to create support near the 111.80 mark that was surrounded by the 100- and 200-hour SMAs as well as the bottom boundary of an ascending channel.
As this event occurred shortly before markets got closed, new trading session the pair started straight from the pre-fall 112.80 level. Accordingly, the pair has once again returned back into boundaries of the above rising wedge pattern.
Since further path to the top is obstructed by the 50% Fibonacci retracement level at 113.00 and the weekly R1 at 113.11, the pair might actually make another turnaround. If a rebound happens, it might confirm validity of a new junior channel down.
XAU/USD Trades Near Upper Boundary Of Dominant Channel
In full accordance with expectations, in first half of the previous trading session the buck continued to trade against the gold in a limbo between the 1,270.50 and 1,276.70 marks that were located just above the lower trend-line of a large dominant ascending channel.
However, the subsequent admission of guilt by General Flynn led to 0.76% rise in demand for safe haven metal just in one hour. But as it was an impulse reaction, a combination of the 100- and 200-hour SMAs managed to neutralize the surge.
Since there are no impactful news planned for today, the rate is likely to spend this trading day between the 55-hour SMA at 1,279.00 and the above bottom boundary located near 1,270.00.
In larger perspective, bulls are expected to take the lead once again, although the pair might prolong consolidation for the next couple of days.