Sample Category Title
XAUUSD Intraday Analysis
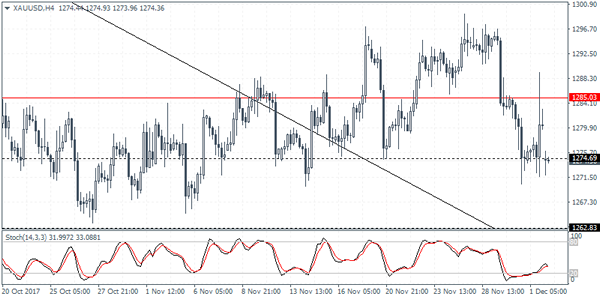
XAUUSD (1274.36): Gold prices remain volatile as price attempted to test the resistance level at 1285 before closing lower. The retest back to the support level at 1274.70 signals a possible move back to the upside. However, with the support level seen to be weak, there is a potential for gold prices to post a decline. Failure to bounce off 1274.70 region could keep gold prices weaker with the next test of support seen at 1262.83 region. In the near term, the volatile ranging price action in gold is expected to continue. Above 1285 resistance, gold prices could once again be seen targeting the previous highs near 1296 region with further gains likely to stretch price to test the 1300 level of resistance.
USDJPY Intraday Analysis
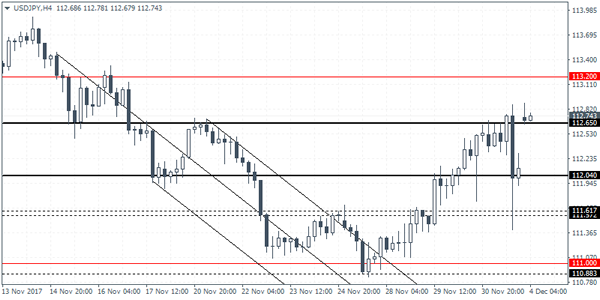
USDJPY (112.74): The USDJPY formed an outside bar on Friday and closed bearish. The intraday rally towards 112.65 was met with strong resistance as the U.S. dollar pared gains. Price action closed on Friday right near the lower support level at 112.04. We expect to see the broader range within 112.65 and 111.61 being maintained in the short. The currency pair also fell to this support level briefly before pulling back higher to settle at the next support level. There is also a possibility that USDJPY will be forming an inverse head and shoulders pattern with the neckline resistance seen at 112.65. Therefore, watch for potential reversals within 112.04 and 111.61 which could signal a move back to the neckline resistance
EURUSD Intraday Analysis
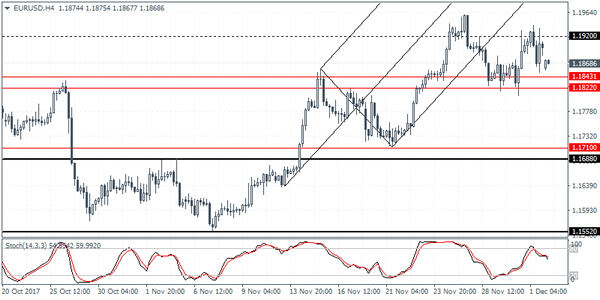
EURUSD (1.1868): The EURUSD was seen asrather volatile on Friday, as price action closed nearly flat and gapped lower at today’s open. The consolidation seen just below the 1.1954 level of resistance signals a potential change of sentiment in the short term. Unless EURUSD manages to close convincingly above 1.1954 we expect the bias to shift to the downside with the major support at 1.1704 in focus. In the short term, EURUSD will need to breach the initial hurdle. Strong intraday support is seen near 1.1843 - 1.1822. A break down below this level will however signal the declines to 1.1704. To the upside, the resistance level near 1.1920 will be critical for price action. However, watch the lower high that was formed last week which could signal a move to the downside.
U.S. Senate Passes Tax Reforms By A Narrow Vote
The markets closed on Friday on a rather sombre note. However later in the night, the U.S. Senate approved the tax bill which was passed by a narrow vote. The latest hurdle being crossed places the much talked about tax reforms one step closer. Both the Senate and the House are now expected to craft a joint bill.
On the economic front, the ISM's manufacturing PMI released on Friday showed that the U.S. manufacturing activity slipped slightly to 58.2. This was lower than forecasts and down from 58.7 in October. Friday was also data heavy from Canada. The monthly employment report showed Canadian unemployment rate falling to 5.9% from 6.3% the month before. GDP data for the month also showed a modest increase of 0.2% which was higher than the forecasts.
Looking ahead, Monday starts off with the UK's construction PMI. Forecasts point to a modest increase to 51.2 in November, up from October's 50.8. This comes after Friday's manufacturing PMI showed strong gains. The Eurozone Sentix investor confidence data is also expected to come out later followed by the factory orders report from the U.S. later in the day.
Daily Technical Analysis: EURUSD, GBPUSD, USDJPY, USDCHF
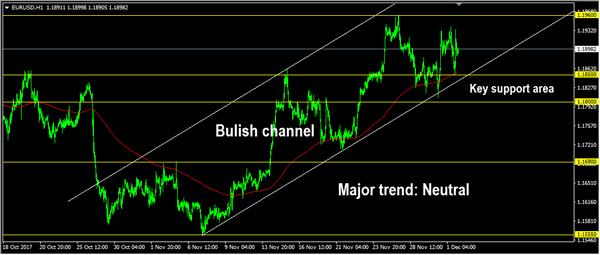
EURUSD
The EURUSD was indecisive last week. Price attempted to push lower bottomed at 1.1808 but closed higher at 1.1898 after bounced-off the lower line of the bullish channel as you can see on my H1 chart below. The bias is neutral in nearest term but as long as stay inside the bullish channel and above 1.1800 price is still in a bullish phase. Immediate resistance is seen around 1.1960. A clear break and daily close above that area would expose 1.2000 – 1.2090 region. On the downside, a clear break below 1.1800 would expose 1.1690 or lower. Overall I remain neutral.
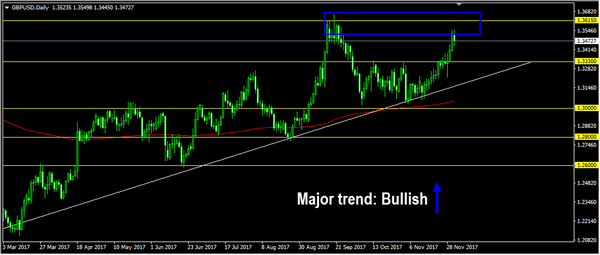
GBPUSD
The GBPUSD continued its bullish momentum last week topped at 1.3549 but closed a little bit lower at 1.3472. The bias is neutral in nearest term. Immediate support is seen around 1.3445. A clear break below that area could trigger further bearish pressure testing 1.3385 area. Immediate resistance is seen around 1.3550. A clear break above that area could trigger further bullish pressure retesting 1.3615 key resistance. Overall I remain bullish.
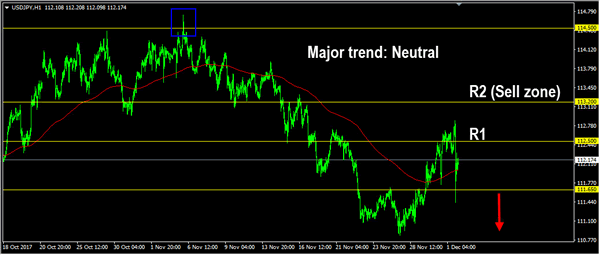
USDJPY
The USDJPY was volatile but indecisive last week.The bias is neutral in nearest term. Overall I still prefer a bearish scenario at this phase as a part of the bearish pin bar scenario on daily chart, but need a clear break below 111.65 to continue the bearish run with nearest target seen at 110.65 area. Immediate resistance is seen around 112.50. A clear break above that area could trigger further bullish pressure testing 113.20 which remains a good place to sell. Overall I remain neutral.
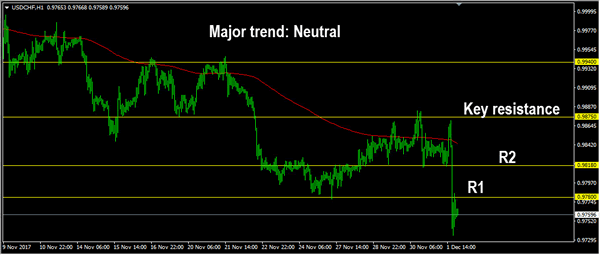
USDCHF
The USDCHF was indecisive last week. Price attempted to push higher, topped at 0.9882 but whipsawed to the downside and closed lower at 0.9759. The bias is bearish in nearest term testing 0.9700 region. Immediate resistance is seen around 0.9780 followed by 0.9818 but key resistance remains at 0.9875 which remains a good place to sell with a tight stop loss. On the downside, a clear break and daily close below 0.9700 would expose 0.9600 region. Overall I remain neutral.
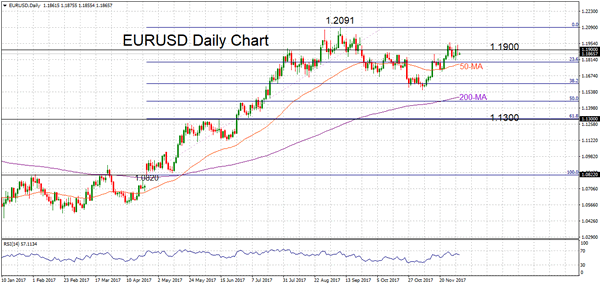
EURUSD Neutral In Near-Term, Bullish Outlook Intact
EURUSD is consolidating recent gains after a strong rally from the 1.1600 area to 1.1900. A neutral phase is expected in the near-term as the market became overextended and the daily RSI indicator is indicating momentum has weakened after reaching near overbought levels at 70.
EURUSD is expected to be supported on dips at key Fibonacci levels. The first level is at 1.1790, which is the 23.6% Fibonacci retracement level of the uptrend from 1.0820 to 1.2091. Below this, there is a support zone between 1.1553 (November 7 low) and 1.1606 (38.2% Fibonacci). Any further extension lower would target 1.1455 and the key 1.1300 area. From here the trend would start turning bearish.
The overall bullish undertone is expected to remain strong as long as EURUSD stays above the 50-day moving average (currently at 1.1776). Breaking key resistance at 1.1900 would open the way for a re-test of 1. 2091.This is a level not seen since the end of 2014 and so rising above it would propel the market towards the 1.2600 handle.
The broader uptrend remains in progress with no signs of a reversal. The 50 and 200-day moving averages are positively aligned and supporting the bullish outlook.
Forex: Geo-Politics Will Be The Focus Of The Week
This week will be dominated by Geo-Politics as the US Tax Bill needs to be reconciled between the Senate and House, whilst UK Prime Minister May meets Jean-Claude Juncker, the President of the European Commission, Brexit Secretary, David Davis, and his opposite number Michel Barnier, plus, in an all-important oversight role, the President of the European Council, Donald Tusk, who represents the leaders of the 28 EU member states, to move the Brexit process forward.
Early on Saturday saw the US Senate approve the tax overhaul bill. The approval marks a first significant “win” for President Trump and his Republican Party after months of failed proposals. The Bill is a sweeping overhaul of the US tax code that would cut individual rates and slash the corporate tax rate from 35% to 20% starting in 2019. Congress now needs to reconcile both the House and Senate bills this week – a task that should be relatively simple, as the Senate and House Bills are very similar with only minor amendments needed. The news has reinforced risk-on sentiment in the markets. However, the Trump administrations' celebrations might be short-lived as reports suggest that former US National Security Adviser Michael Flynn pleaded guilty to lying to the FBI and said he would cooperate with the probe into Russian meddling in the U.S. presidential election.
UK Prime Minister Theresa May is hoping her talks with Jean-Claude Juncker today will ensure the EU will open the second phase of Brexit negotiations concerning relations after Britain's withdrawal on March 30, 2019. The challenge being that the EU will only do that if there is “sufficient progress” in agreeing “divorce” terms, notably on three key issues: a financial settlement, guaranteed rights for EU citizens in Britain and a “soft border” with Ireland. Reports suggest the financial settlement has been agreed and sources close to the process have suggested that there were indications of agreement on citizens' rights and of an understanding of how at least to move forward on the Irish border issue to avoid holding up the rest of the package. As a result of the talks today, there is hope from May that the EU Commission could then say there is sufficient progress to move to Phase 2. The markets are likely to see GBP volatility on any statements/comments coming out of these discussions.
EURUSD is little changed from Friday's close, currently trading around 1.1870.
USDJPY is unchanged in early Monday trading at around 112.80.
GBPUSD is 0.2% higher in early session trading at around 1.3465.
Gold is unchanged, trading around $1,274.50.
WTI is 0.6% lower, currently trading around $57.93.
Major data releases for today:
At 09:30 GMT: the UK Chartered Institute of Purchasing & Supply and Markit Economics will release PMI Construction for November. The previous release of 50.8 is likely to see an improvement following the recent reports that the UK has come to an agreement on the Brexit divorce payout.
At 10:00 GMT: Eurostat will release Eurozone Producer Price Index for October (MoM & YoY). Month-on-Month data is expected to come in at 0.3% (prev. 0.6%) and Year-on-Year data is expected at 2.6% (prev. 2.9%), both data sets slightly worse than previous. If there is significant deviation from the forecasted data the markets will see EUR volatility.
At 15:00 GMT: the US Census Bureau will release Factory Orders (MoM) for October. The previous reading of 1.4% is unlikely to be touched with this release. Forecasts are calling for 0.6%. Any significant deviation from the forecast will see USD volatility.
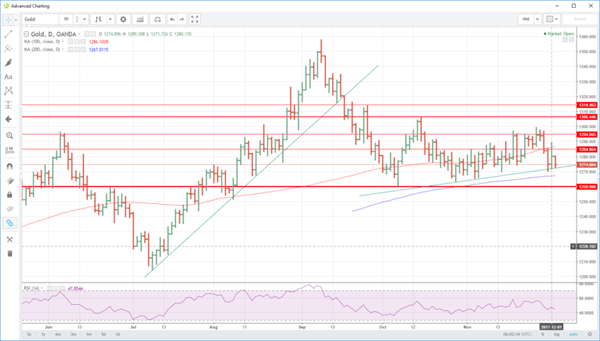
Gold Tests Support After Friday’s Failure
Gold gaps lower this morning as U.S. tax progress and higher yields put the boot into Friday's failed recovery.
Gold traded in a very choppy and impressive 20 dollar range on Friday but finished with a whimper, settling mid-range 1280.00. It did not pass go at the open this morning in Asia, with gold starting trading four dollars lower at 1276.00 before falling to support at 1272.50 before staging a dead cat bounce to 1274.70.
The street is ignoring President Trump's political woes and concentrating on firming U.S. yields as the U.S. tax reform bill passed its Senate vote. The House and Senate will now meet to horse trade their respective versions and come up with a workable version the President can sign into law. The rapid progress and intent on completing the exercise in the new two weeks while avoiding a government shutdown have had traders scrambling to reassess the Fed's interest rate trajectory for 2018. With potentially higher yields (always our thesis), precious metals prices have continued to suffer.
The failure last week at 1300.00 and the rapid unwinding of the multi-week gold recovery, has set a negative tone from a technical perspective. Gold has resistance at the 100-day moving average at 1286.50, the scene of its failure on Friday. Behind this, the 1300.00 area looms as formidable now capping gold rallies.
Support appears at 1272.50, the days low today and the two-month trendline support. The 200-day moving average is just behind this at 1267.00 with a daily close below setting up an attack on critical long-term support at 1260.00. A break of this region may well see longer-term gold positioning exit the market en-masse.
Euro Remains Bullish Vs US Dollar
Key Highlights
- The Euro made a nice upside move and is placed well above the 1.1840 support against the US Dollar.
- There is a key bullish trend line forming with support at 1.1850 on the 4-hours chart of EUR/USD.
- The US ISM Manufacturing Index declined from the last reading of 58.7 to 58.2 in Nov 2017.
- Today, the US Factory Orders figure for Oct 2017 will be released, which is forecasted to increase by 0.6% (MoM).
EURUSD Technical Analysis
The Euro mostly traded with a positive bias above 1.1800 this past week against the US Dollar. The EUR/USD pair is now above 1.1850 and remains in an uptrend.
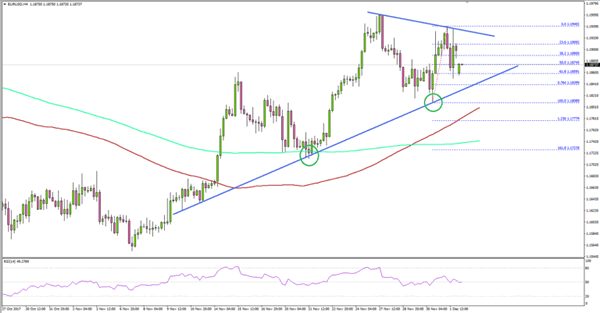
The pair started a downside correction from the 1.1940 swing high and traded well below the 1.1900 level recently. It has breached the 50% Fib retracement level of the last wave from the 1.1808 low to 1.1940 high.
However, there is a key bullish trend line forming with support at 1.1850 on the 4-hours chart. Moreover, the 61.8% Fib retracement level of the last wave from the 1.1808 low to 1.1940 high near 1.1859 is also acting as a support.
Overall, as long as the pair is above the 1.1840-1.1850 support levels, it remains in the bullish zone in the near term.
US ISM Manufacturing Index
Recently in the US, the Institute for Supply Management (ISM) Manufacturing Index for Nov 2017 was released. The market was looking for a decline from the last reading of 58.7 to 58.4.
However, the actual result was a bit on the lower side since there was a decline in the index from 58.7 to 58.2. Looking at the New Orders Index, there was an increase of 0.6% from the last reading of 63.4 to 64.0.
Moreover, the Production Index posted a solid increase of 2.9% from 61.0 to 63.9, and the Employment Index posted a decline of 0.1% from 59.8 to 59.7.
Overall, the result was positive and pushed the EUR/USD pair down from 1.1900. However, losses remain limited by the 1.1850 support area.
Daily Wave Analysis: EUR/USD Wedge Pattern Awaits Bearish Or Bullish Breakout
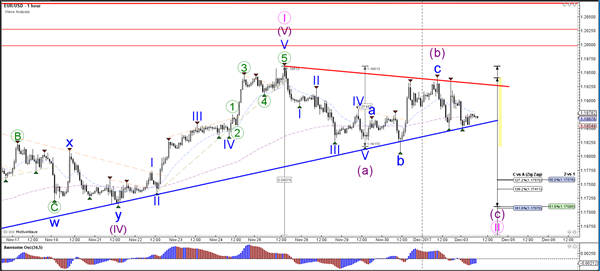
Currency pair EUR/USD
The EUR/USD could be in a wave B (purple) bearish retracement If price is able to break below the support trend line (blue). A bearish breakout could see price fall and challenge the Fibonacci levels of wave 2 vs 1 (pink).
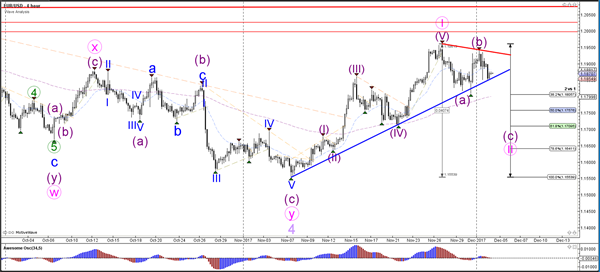
The EUR/USD break below support (blue) could see price fall towards the Fibonacci levels of wave 2 (pink). A break above the resistance trend line (red) could indicate an extension of wave 1 (pink), although new resistance levels are nearby (red lines).
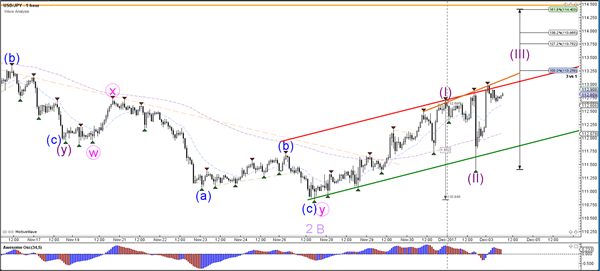
Currency pair USD/JPY
The USD/JPY has made another higher high within the uptrend channel and therefore a new bullish pattern (wave 3) seems more likely at the moment than an extended WXY correction within an uncompleted wave 2 or B (light purple).
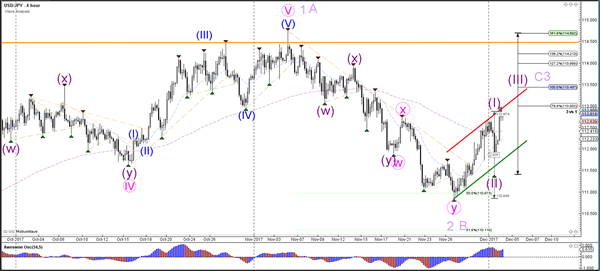
The USD/JPY will need to break above the resistance (red/orange) now or later to confirm the wave 3 pattern (purple).
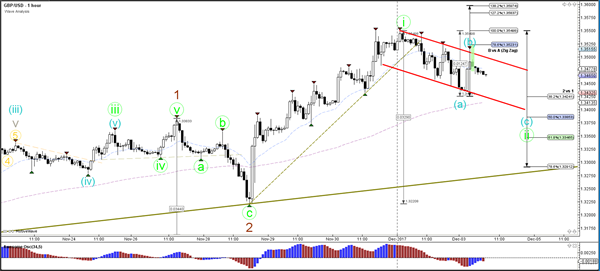
Currency pair GBP/USD
The GBP/USD could be in a wave 1-2 (green) unless price breaks below the 100% Fibonacci level of wave 2 vs 1. The broken resistance (dotted red) level is equal to the 61.8% Fibonacci support level.
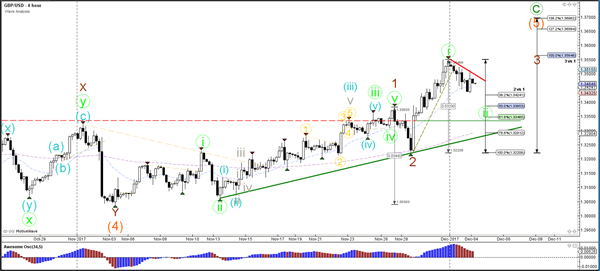
The GBP/USD is in a bearish trend channel and could be building a wave C (blue) within an ABC (blue).