Sample Category Title
Growth in Canada Slowed in Q3 – But to a Still ‘Above-Potential’ Rate
Highlights:
- Canadian Q3 GDP rose 1.7% - broadly in line with market expectations for a 1.6% gain.
- Household spending was stronger-than-expected and business investment rose for a third straight quarter
- GDP rose 0.2% in September, marking somewhat stronger-than-expected momentum at the end of Q3.
- We continue to expect GDP growth has moderated from the outsized pace from mid-2016 to mid-2017 but to a still 'above-potential' 2% rate on balance.
Our Take:
The 1.7% (annualized) gain in GDP was down from the (unsustainably strong) 3.6% average increase over the prior four quarters. The increase was still modestly above most estimates of the economy's long-run 'potential' growth rate, though. Indeed, the slower GDP growth didn't prevent the unemployment rate from falling again in the third quarter - with the separately released November employment report this morning pointing to further labour market improvement to-date in Q4. GDP growth in Q3 continued to be concentrated in household spending with a stronger-than-expected 4.0% increase that built onto a 5.0% surge in Q2. Government investment spending also jumped higher, though, and business investment rose for a third straight quarter - albeit at a more modest pace than over the first half of the year. Offset came from a large, but expected, pullback in net trade.
Monthly GDP data, also released this morning, were perhaps more encouraging than the quarterly data in terms of near-term growth implications. September GDP rose a stronger-than-expected 0.2% (non-annualized) to more-than-retrace a 0.1% dip in August. That left somewhat stronger momentum at the end of the quarter than we previously assumed. The data is still pointing to a slowing in underlying GDP growth from the outsized pace from mid-2016 to mid-2017 but is also still fully consistent with our - and the Bank of Canada's - view that growth will be sustained at a modestly above trend 2% pace going forward.
Loonie Rallied Strongly after Upbeat Canadian GDP/Jobs Data
Canadian dollar surged against US dollar on Friday and hit three-day low, driven by upbeat domestic GDP and jobs data.
Fresh acceleration retraced over 61.8% of USDCAD's four-day rally which commenced from 1.2680 (Monday's low) and hit the highest at 1.2909 on Thursday.
Canada's economy grew at annualized rate of 1.7% in the third quarter, beating forecast at 1.6%, while economy added 79.5K new jobs in November well above forecasted 10K and jobless rate fell to 5.9% in November from 6.3% in October and 6.2% consensus.
Fresh fall weakened pair's bullish structure which strengthened on acceleration from double-top at 1.2670 zone.
Recovery stall on approach to key 1.2916 barrier and subsequent fall turned near-term bias lower, with close below cracked Fibo 61.8% support at 1.2761, needed to confirm bearish stance and open way for retest of 1.2670 higher base.
Res: 1.2782; 1.2820; 1.2855; 1.2909
Sup: 1.2740; 1.2670; 1.2653; 1.2624
Bond Market Signals: Sign, Sign, Everywhere a Sign
Highlights
- A narrowing US Treasury 10-2yr spread can be an early warning sign that the American economy is headed for a recession, but we don't believe recent dynamics reflect this outcome. Domestic and global quantitative easing (QE), financial regulation, and low inflationary pressures are keeping the spread lower than it would be otherwise.
- For this reason, it is the term premium causing the flattening and not expectations for a monetary policy error, which is different from historic observations. By our estimation, the UST 10-2yr spread conveys a probability of a recession occurring within the next 12 months to be 20-30%. But, when we adjust for the presence of QE, it reduces that outcome to 5-15%.
- One should not look at yield curve dynamics in isolation. When appropriately combined with other leading economic and financial variables, the message is further reinforced that the U.S. economy still has room to run.
There is considerable media discussion surrounding the relative flatness of the U.S. yield curve. With the UST 10-2yr spread at approximately 60 bps, the lowest level in a decade, is it time to sound the recession alarm bells? In short, no. Yield curve compression is certainly a valid and early-warning signal of recession risks, but it's premature to sound the alarm. To understand why, we examine both financial and economic variables to get a better idea on how far away we are from recession.
The Accuracy of the Yield Curve
First, it's important to distinguish the reliability of recession signals offered by yield inversion versus compression. A recession has typically been preceded by an inversion in the yield curve (Chart 1). Clearly, before we hit the stage of inversion, compression must first occur, and various researchers have tried to identify meaningful thresholds that either increase the odds or are a precursor to a looming recession. One such report came from the Federal Reserve Bank of New York, "Monetary Cycles, Financial Cycles, and the Business Cycle". This paper is grounded in a supply-side notion that flat yield curves create conditions that affect bank profitability, bank lending, and subsequent real economic activity. In this paper, the authors use the UST 10yr-3m spread and state that a level below 93 basis points (bps) predicts an increase in the unemployment rate. In turn, this is mostly consistent with a recession occurring within 12-18 months. Today's equivalent spread is very close to that threshold at roughly 100bps.
There are many versions of this "spread" warning signal. Some use the UST 30-5yr spread, and others abide by the spread on minimum yield. This latter approach emphasizes the lowest yield on the UST 10yr observed during the cycle against the current 3 month yield 1. Applying this exercise, the minimum UST 10yr in this cycle closed at 1.50% during Brexit turmoil in 2016 (the intraday level was lower at 1.32%). This means that a cross could happen after the next one or two FOMC rate hikes. But, this pick-and-choose spread analysis can become a bit of a data-mining exercise, which is part of the point we're making. It's important to understand the broader context of yield compression and look at the message that's also being conveyed from other indicators in order to get a clearer read of a recession signals. In other words, the yield curve is a fairly reliable recession-indicator, but by no means is it perfect, and even when it gets it right, it still leaves much interpretation on the exact timing of a downturn.
Specifically, there are long lags associated with a recession signal. Over the last three decades, the UST 10-2yr spread hit zero on average 2 years before a recession. If one sold out of the S&P 500 on this signal, they would have missed significant equity market appreciation over the last 3 cycles.
In addition, the UST 10-2yr signal sometimes misses. During the 1957 and 1960 recessions, the yield curve did not invert. In addition, it has provided a number of false/too early signals over the years. Relative to the NY Fed paper, the 10yr-3m (93 basis point) spread threshold has offered false signals (1997, 1995, and 1963).
The Cause Behind the Flattening:
It is important to keep in mind a few important details regarding a flattening yield curve. First, it is a natural by-product of a central bank hiking cycle. As the Fed conducts its rate hiking cycle, it communicates that the path of rates will rise over the coming years. The UST 2yr reflects the average of expected short rates over that period (plus a term premium). The same is true for the UST 10yr over the 10 period. Given the very forward looking nature of the UST 10yr, at the initial stage of the Fed's rate hiking cycle, that long yield will move up faster than the short end. This generally marks the peak of the 10-2yr spread in a cycle. As the central bank continues to press forward through the rate hiking cycle, the UST 2yr adjusts, hence causing the spread compression. Within our financial forecast, the process of spread compression is not yet complete. We expect a terminal spread of about 35bps, with an understanding that market movements can temporarily push this even lower.
What is interesting in this cycle is that the spread between pure market rate-expectations of the 10yr and 2yr are still very positive (Chart 2), whereas the term premium spread is causing most of the compression. Historically, it is the rate-expectations part of the spread that signals recession (ie: a Fed policy error). So, we are witnessing something new with the compression being the result of the term premium. This reflects the influence of QE, regulation, and low inflation.
Call these distortional impacts or the new status quo, but in both cases, historical yield curve analysis offers little parallel reference to judge the accuracy of its current predictive ability. There was no previous historical context for QE until this cycle. Adjusting the UST 10yr yield solely for the influence of the Fed's asset purchases program lifts the yield by 30 basis points or more. Put another way, we wouldn't be having this discussion on whether narrowing spreads are signalling a recession (Chart 3). When we estimate the probability of a recession using just the UST 10-2yr spread, we find the odds to be around 25-30%, but when we adjust for the presence of QE, it reduces that outcome to about 5-15%.
However, this analysis doesn't take into account the fact that it's not just U.S. monetary policy actions anchoring down the long end of the curve. Many central banks are engaging in similar asset-purchase activity (BoE, ECB, BoJ). In fact, the Federal Reserve is the only central bank that is truly on a normalization path, marked by four rate hikes and early steps towards balance sheet run-off. The majority of the remaining global central banks are, at best, applying less pressure to the emergency stimulus accelerator. We have written numerous times on the tight correlation of long-term UST to international yields (roughly 70% of the movement linked to global common factors). So, the combined purchases of central banks act as an additional weight on long-term yields, layered on top of the usual influences from domestic policy, increased regulatory demand and, of course, flare-ups in geopolitical risk (cue North Korea).
Solid Conditions for Economic Growth
To get a better gauge of risks, we combine the yield curve slope with our Financial Stress Indicator, which captures movements in volatility within equity, bond, and foreign exchange markets (Chart 4). A reading above zero implies a 20% change in the probability of recession and if the indicator moves above 1%, the probability of recession within the next 6 months jumps close to 50%.
One reason other financial market indicators have been so strong is because the U.S. macro backdrop is not only solid, but strengthening. Evidence of this can be found by looking at a broad suite of macroeconomic indicators. For starters, labor market conditions have strengthened considerably. The unemployment rate is below NAIRU and has historically remained there for an average of 3 years preceding a recession. Furthermore, initial claims have continued to trend downwards and have reached their lowest level since 1973 (Chart 5). Both of these measures are in our probability of recession models and if they tick up, we will not only receive a recession signal, but it will also give us a better idea on the window of timing. Realistically, a recession risk is always present in any business cycle, so timing does matter.
On this front, residential investment also paints a picture of an economy that has room to grow. Since, the late 1940's, real residential investment as a share of real GDP has peaked about 3 years prior to the onset of a recession. At the moment, the share is rising, but is historically low. Rising wages should help preserve home affordability in an environment of increasing interest rates, thereby supporting American housing market activity.
Equity prices are another metric of importance. With the Dow Jones and S&P 500 continuing to make new historic highs, current valuations do give some cause for concern. Using metrics including Tobin's Q and CAPE, there is evidence that equity valuations are flashing yellow, rather than red (Chart 6). The recent gains have been fostered in part by optimism surrounding the ability for corporations to increase earnings in response to the global growth surge, low interest rates, and potentially lower tax rates. In this way, there is some justification for current valuations. Further, investor leverage as measured by debit balances in margin accounts at broker dealers has not accelerated to the point of hubris - something that occurred before previous recessions (Chart 7).
Lastly, the production side of the economy also depicts a strong economic backdrop. As illustrated in Chart 8, the ISM Manufacturing Composite Index is clearly in expansionary territory. If this drops to 50 or below, we will have to raise the risk of recession.
FOMC: Can they Read the Sign?
With the changing of the guard at the Fed, and many seats vacant or being filled, it's difficult to know their reaction function to a flatter curve. History has not been on their side. During periods when the 10-2yr yield curve inverted, the Fed continued to hike in 1989, 2000, and 2005. Put differently, they ignored inversion as a recession signal. All periods ended in a recession within 2 years. This is often why economists (including us) refer to recessions as being the outcome of policy errors - i.e. the Fed over-tightens relative to the neutral r*, which suffocates growth.
However, this time around, we are doubtful that the incoming FOMC will ignore the yield curve signal for several reasons. First, the Fed has been very focused on paying attention to market reaction to its policy and communication. If near-term yields start to price too sharp of a policy path relative to the UST 10yr, you can be sure that the Fed will alter communication to help adjust market pricing.
Second, incoming Chair, Powell appears more markets oriented and has not given the impressions of having a dogmatic approach. This, in combination with the changing FOMC composition, their already-cautious policy approach and high media attention, suggests we will see a Fed that proceeds more cautiously to this signal than in the past.
If nothing else, a spread that approaches the zero bound would be a market signal to the Fed that inflation expectations are coming down (due to the anchor on 10yr yields). And, during this cycle, we have seen a Fed that's quite sensitive to the direction and level of inflation expectations. A potential first clue that the Fed is weighing this yield curve predictor more heavily could be another migration down in the near-term part of the dot plot (early 2018), particularly if this occurs against a strengthening U.S. economy and/or fiscal stimulus.
To sum up, key takeaways are:
- Yield compression is a normal late cycle phenomenon, but at 60bps there's plenty of cushion and it is not yet given a recession signal.
- The current level of the UST 10-2yr spread is being distorted by central bank policies, both global and domestic. The spread is low because of the term premium rather than pure expectations for policy rates (the opposite of what we have seen historically).
- The Fed will likely be sensitive to the shape of the yield curve and adjust communication and policy according to the risks it's conveying.
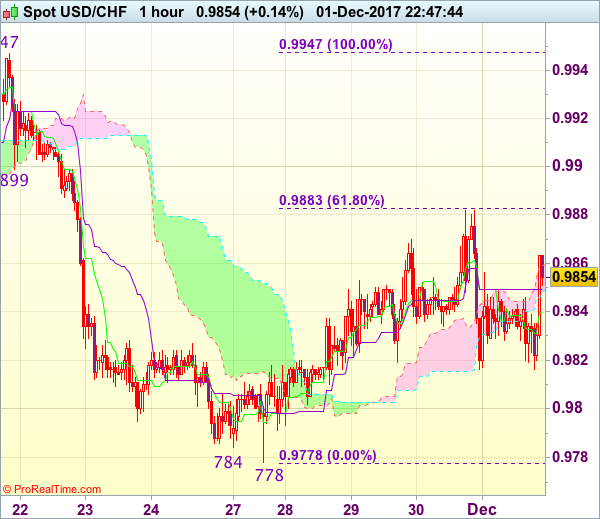
Trade Idea Wrap-up: USD/CHF – Exit short entered at 0.9860
USD/CHF - 0.9855
Most recent candlesticks pattern : N/A
Trend : Near term down
Tenkan-Sen level : 0.9840
Kijun-Sen level : 0.9849
Ichimoku cloud top : 0.9859
Ichimoku cloud bottom : 0.9848
Original strategy :
Sold at 0.9860, Target: 0.9760, Stop: 0.9885
Position : - Short at 0.9860
Target : - 0.9760
Stop : - 0.9885
New strategy :
Exit short entered at 0.9860,
Position : - Short at 0.9860
Target : -
Stop : -
The greenback continued finding good support at 0.9816 and has staged a strong rebound in NY morning, dampening our bearishness and risk of another bounce to 0.9882-83 (yesterday’s high and 61.8% Fibonacci retracement of 0.9947-0.9778) cannot be ruled out, however, reckon upside would be limited to previous support at 0.9899 and price should falter well below resistance at 0.9947, bring another decline next week.
In view of this, would be prudent to exit short entered at 0.9860 and stand aside for now. Below said support at 0.9816 would revive bearishness and signal the rebound from 0.9778 has ended at 0.9882, bring retest of this level later, a break of this support is needed to confirm recent decline from 1.0038 top has resumed and extend weakness towards 0.9730-37 support area but reckon support at 0.9705 would hold from here.
Weekly Focus: Weakening Nordic Housing Markets in Focus
Market movers ahead
- In the US, we expect to see a catching up effect for non-farm payrolls in November. We expect an increase of 195,000 driven mainly by the service sector.
- Brexit remains in the spotlight, as the EU says an agreement on phase 1 must be reached on Monday at the latest in order to assess whether 'sufficient progress' has been made in the negotiations' phase 1 to move to phase 2 (future relationship).
- In all Scandinavian countries, we have interesting data out on housing markets. Sweden and Norway in particular draw our attention following recent weakening. We expect to see declining house prices in both countries.
- In Norges Bank's regional survey, we expect to see the aggregated output index unchanged at around 1.1.
Global macro and market themes
- US curve flattening continues; and we look at possible explanations.
- We believe the factors that have driven the flattening, including expected market pricing of more Fed hikes in 2018, in a low inflation environment will continue to flatten the US curve over the next couple of quarters.
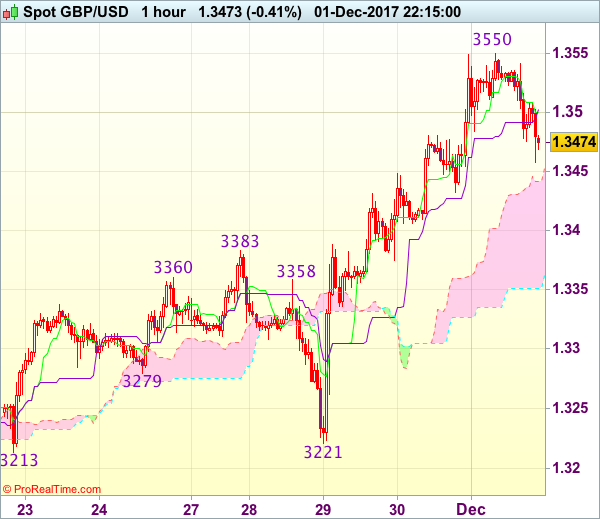
Trade Idea Wrap-up: GBP/USD – Buy at 1.3410
GBP/USD - 1.3472
Most recent candlesticks pattern : N/A
Trend : Near term up
Tenkan-Sen level : 1.3500
Kijun-Sen level : 1.3502
Ichimoku cloud top : 1.3432
Ichimoku cloud bottom : 1.3351
Original strategy :
Buy at 1.3440, Target: 1.3560, Stop: 1.3405
Position : -
Target : -
Stop : -
New strategy :
Buy at 1.3410, Target: 1.3540, Stop: 1.3375
Position : -
Target : -
Stop : -
As cable has retreated after meeting resistance at 1.3550, suggesting consolidation below this level would be seen and pullback to 1.3435-40 is likely, however, reckon 1.3400-10 would limit downside and bring another rise later, above 1.3505-10 would bring retest of 1.3550 but break there is needed to confirm recent rise has resumed for headway to 1.3570-75 and later towards 1.3600.
In view of this, would not chase this rise here and would be prudent to buy sterling on subsequent pullback as 1.3400-05 would limit downside and bring another rise. Below 1.3374 support would abort and signal top has been formed, bring further fall to 1.3340-45.
Canadian Job Market Unstoppable in November, Adding 79.5k Jobs
The Canadian labour market added to its winning streak last month, adding a whopping 79.5k jobs in November and marking the 12th straight month of employment gains. Strong hiring and a largely unchanged labour force led the unemployment rate to tumble to 5.9% from 6.3% in October.
Part-time jobs led the gains, up 49.9k, but full-time employment also increased robustly, rising 29.6k. Full-time jobs are up 3% year-on-year - its fastest pace in fifteen years.
Job gains were concentrated in the private sector (+72.4k), with the public sector kicking in an additional 10.6k.
Both goods and service-producing industries added positions at a solid clip. Goods industry jobs were up 37.4k, led by manufacturing, which added 30.4k, with construction kicking in a solid 16.8k. Services industries added 42.1k, with trade industries accounting for nearly all of the gains, up 38.8k.
Regionally, Ontario accounted for half the gains, up 43.2k, pushing the unemployment rate in the province to 5.5% (from 5.9%). Quebec also added a healthy 16.2k jobs, leading the unemployment to a new record-low of 5.4% (from 6.1% in October). Alberta also saw a significant drop in its unemployment rate to 7.3% (from 7.8%).
The hourly wage rate accelerated to 2.7% on a year-on-year basis from 2.4% in October. The only fly in the ointment was a deceleration in hours worked to 1.0% (y/y) from 2.7%. However, much of this was a base year effect, with a surge in hours worked in November 2016.
Key Implications
The Canadian labor market appears unstoppable at this point, with a twelfth consecutive month of job gains. During the last 40 years the unemployment rate has only been (marginally) lower in one month - December 2007 when it hit 5.8%.
With strength concentrated in full-time work, there is little doubt that the economy is operating at full capacity and pushing into excess demand territory. This notion is corroborated by the acceleration in wage growth. It's hard to fathom that just a few months ago analysts (ourselves included) were decrying its weakness. The path up from its nadir of 0.6% in April has been rocket-like.
The strength in the labor market will not go unnoticed by the Bank of Canada. Risks to the outlook notwithstanding, the broad-based strength in jobs and wage growth suggest that the Bank of Canada should continue to normalize monetary policy. The Bank of Canada may choose to hold off next week, but the next rate hike is likely not more than a few months away.
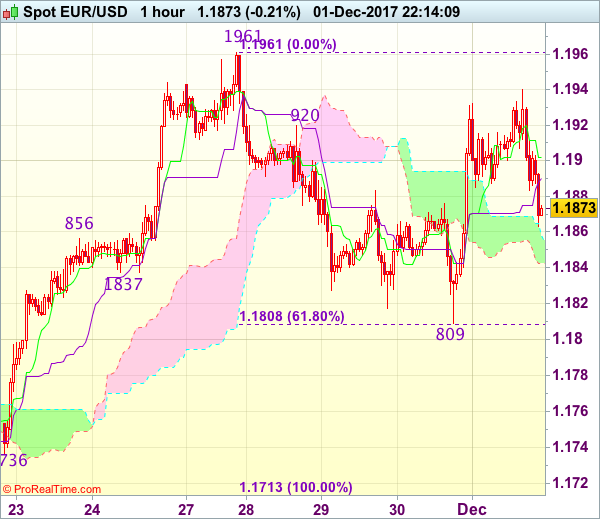
Trade Idea Wrap-up: EUR/USD – Hold long entered at 1.1865
EUR/USD - 1.1866
Most recent candlesticks pattern : N/A
Trend : Near term up
Tenkan-Sen level : 1.1902
Kijun-Sen level : 1.1890
Ichimoku cloud top : 1.1858
Ichimoku cloud bottom : 1.1843
Original strategy :
Bought at 1.1865, Target: 1.1965, Stop: 1.1855
Position : - Long at 1.1865
Target : - 1.1965
Stop : - 1.1855
New strategy :
Hold long entered at 1.1865, Target: 1.1965, Stop: 1.1855
Position : - Long at 1.1865
Target : - 1.1965
Stop : - 1.1855
As the single currency found decent demand at 1.1809 yesterday and has staged a strong rebound, price broke above previous resistance at 1.1920, adding credence to our view that the pullback from 1.1961 has ended there, hence bullishness remains for a retest of this level, however, break there is needed to confirm recent upmove has resumed for headway to 1.1990-00 which is likely to hold from here.
In view of this, we are holding on to our long position entered at 1.1865. Below 1.1855-60 would abort and prolong consolidation and risk weakness to 1.1835-40, having said that, said support at 1.1809 should remain intact, bring rebound later.
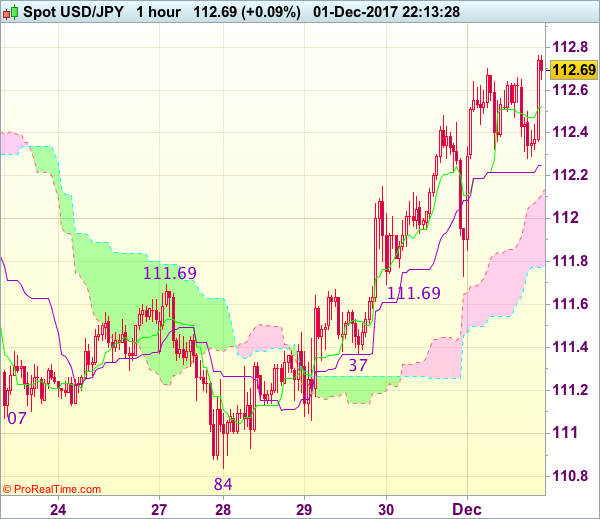
Trade Idea Wrap-up: USD/JPY – Buy at 112.00
USD/JPY - 112.67
Most recent candlesticks pattern : N/A
Trend : Near term up
Tenkan-Sen level : 112.52
Kijun-Sen level : 112.25
Ichimoku cloud top : 112.11
Ichimoku cloud bottom : 111.77
Original strategy :
Buy at 112.00, Target: 113.00, Stop: 111.65
Position : -
Target : -
Stop : -
New strategy :
Buy at 112.00, Target: 113.00, Stop: 111.65
Position : -
Target : -
Stop : -
As the greenback has surged again after holding above indicated support at 111.69 (just missed our long entry at 111.70) and bullishness remains for the rise from 110.84 low to extend gain to 112.72 resistance, break there would bring subsequent rise to previous support at 113.09, however, near term overbought condition should limit upside and resistance at 113.33 should hold from here.
In view of this, we are still looking to buy dollar on pullback as 112.00 should limit downside. Only break of said support at 111.69 would abort and signal top is formed, bring weakness to 111.50, then test of support at 111.37.
EUR/USD Mid-Day Outlook
Daily Pivots: (S1) 1.1830; (P) 1.1881 (R1) 1.1953; More....
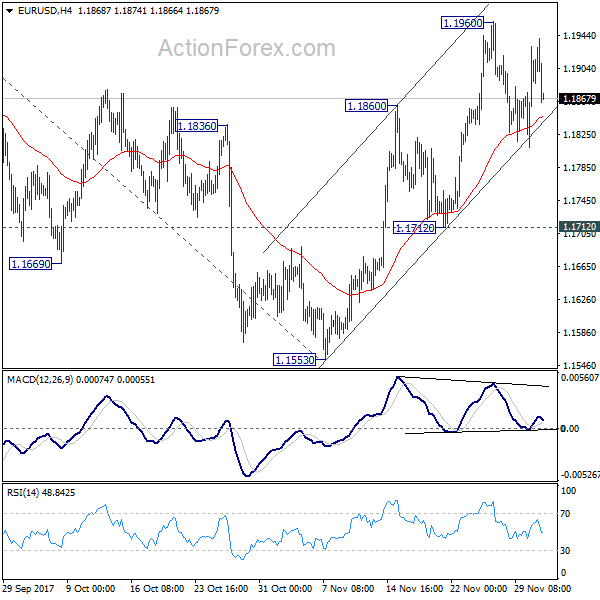
EUR/USD is still bounded in range below 1.1960 and intraday bias remains neutral first. With 1.1712 support intact, rise from 1.1553 is expected to resume later. Break of 1.1960 will turn bias to the upside for retesting 1.2091 high first. Break there will resume medium term up trend from 1.0339 and target 61.8% projection of 1.0569 to 1.2091 from 1.1553 at 1.2494, which is close to 1.2516 long term fibonacci level. We'd expect strong resistance from there to bring reversal. On the downside, break of 1.1712 will indicate completion of the rise from 1.1553 and turn near term outlook bearish.
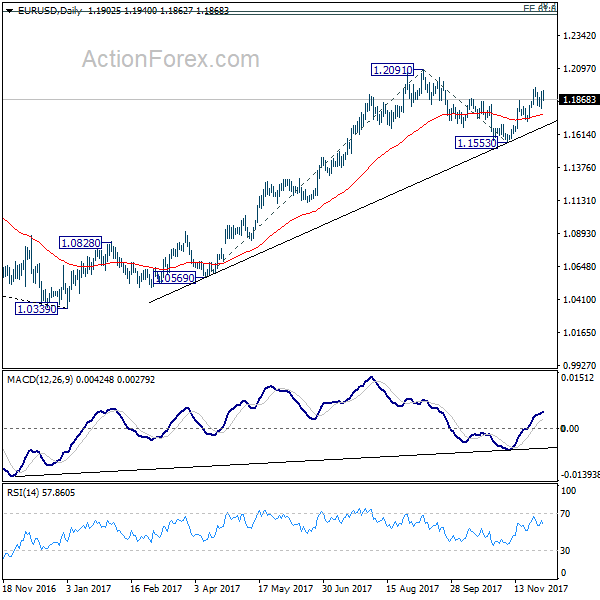
In the bigger picture, rise from 1.0339 medium term bottom is seen as a corrective move for the moment. Therefore, in case of another rally, we'd be expect 38.2% retracement of 1.6039 (2008 high) to 1.0339 (2017 low) at 1.2516 to limit upside and bring reversal. Meanwhile, sustained trading below 55 week EMA (now at 1.1393) will suggest that such medium term rebound is completed and could then bring retest of 1.0339 low.