Sample Category Title
Elliott Wave Analysis: EURUSD And AUDUSD Update
Markets did not move much since Sunday open, so trends since Friday are still intact.
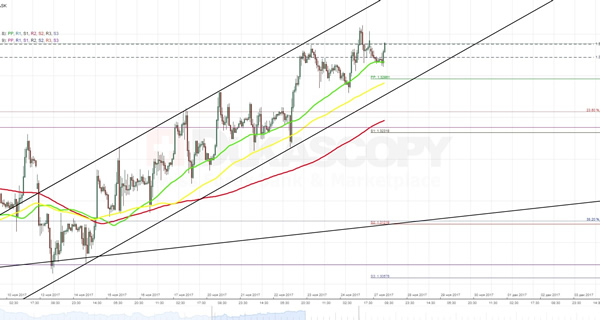
We have seen an interesting strong run up on EURUSD right into Sep 24 gap where pair slowed down last week, but not for long as we see market making a corrective wave four which is expected to find a base at 1.1910/1.1880 area.
EURUSD, 1H
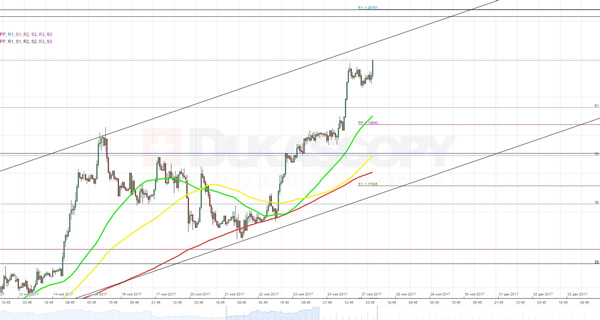
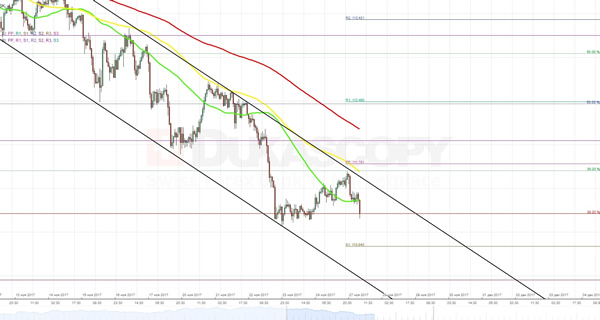
Finally after a very long-time commodity currencies area moving in-line with current euro gains. We see Aussie turning up with five-waves within wave A, first part of a three-wave bullish reversal and now even breaching higher towards wave C. Wave C must also unfold five minor waves, which means more upside may follow on AUDUSD, idally towards 0.7667 level.
AUDUSD, 1H
USD On The Back Foot Again
It's been a relatively slow start to what is otherwise likely to be a busy week for the markets, with appearances from prominent central bankers being accompanied by numerous data releases.
As is so often the case, Monday is looking a little quiet compared to what is to come although we will hear from two notable central bankers – FOMC voter Neel Kashkari and Bank of England Chief Economist Andy Haldane. Kashkari is arguably the most dovish of the current crop of voters on the FOMC and has been open about his objection to further rate hikes which would suggest he's preparing to dissent at the meeting in December, when the central bank is expected to raise interest rates. I would expect him to remain of this opinion when he speaks today.
Haldane on the other hand was one of those on the Monetary Policy Committee that backed a rate hike having not done so previously and it will be interesting to see whether he supports the current outlook of two of the next few years, or whether he feels further action is warranted in the more immediate future. I imagine Haldane will take a more conservative approach once again, with the recent hike having come at a very uncertain and difficult time for the UK economy.
US equity markets are poised to open a little higher again on Monday after having recovered in the latter part of last week to trade back at record highs. A strong showing for online retailers on Black Friday may have boosted sentiment, with Cyber Monday having the potential to be even better in a sign that the consumer is healthier than other numbers this year have indicated. New home sales from the US will also be in focus today.
The US dollar is starting the week on the back foot again after coming under significant pressure in the latter part of last week. While progress is being made on tax reforms, traders may well be doubting how quickly they will be enacted and how significant the final draft will be for the economy and therefore interest rates.
Technical Outlook: SPOT GOLD – Daily Cloud Base Continues To Cap Near-Term Action
Spot Gold maintains bullish bias on weaker dollar and concerns about Fed's next steps regarding interest rates, but upside attempts were repeatedly limited.
Recovery faces very strong resistance, provided by the base of widening daily cloud which repeatedly resisted several attacks last week.
Firmly bullish daily techs suggest further upside and test of $1297 (Fibo 38.2% of $1357/$1260 descend) and psychological $1300 barrier, which requires firm break above cloud base (1294). Stronger bullish acceleration would expose another key barrier at $1309 (daily cloud top/50% retracement) break of which is needed to confirm bullish continuation. Conversely, repeated close below daily cloud would signal further extension of near-term congestion and also keep the downside at risk.
Res: 1297, 1300, 1306, 1309
Sup: 1286, 1283, 1281, 1274
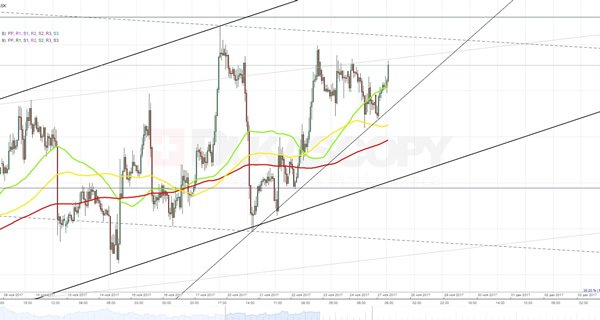
Technical Outlook: AUDUSD – Limited Recovery But Key 20SMA / Trendline Barriers Remain Under Pressure
The pair remains congested between 10 SMA (0.7596) and 20SMA (0.7632) which caps upside attempts for the third straight day, along with bear-trendline from 0.8102 (20 Sep high).
Corrective action from 0.7530 (21 Nov low) is likely to be capped here as overall trend remains bearish and overbought slow stochastic is generating negative signal on daily chart.
However, bullishly aligned near-term studies are supportive for further upside on firm break above trendline / 20SMA.
Extended upticks would look for 55SMA barrier (0.7677) and expected to be capped by 200SMA (0.7694), before bears resume for retest of key 0.7530 support.
Res: 0.7632, 0.7665, 0.7667, 0.7694
Sup: 0.7596, 0.7584, 0.7555, 0.7530
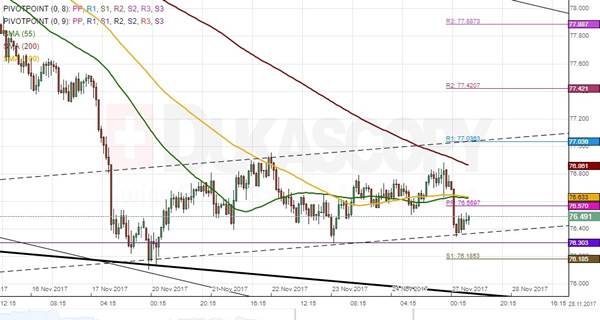
NZD/JPY 1H Chart: Kiwi Moves Sideways
The NZD/JPY currency pair has been guided by three channels. The most senior one was formed mid-June. The Kiwi tested a 2016/2017 high at 84.00 a month later and then edged lower. Meanwhile, the pair bounced off the bottom boundary of the senior channel and the monthly S1 at 76.3025 last week. It started to move in a slight movement up, but has nevertheless failed to accelerate. Currently, the pressure of the monthly S1 and the 200-hour SMAs from both sides are squeezing the Kiwi in a continually narrowing trading range. In case the latter is breached, a subsequent surge is expected to occur towards the monthly PP at 78.86. Conversely, a breakout of the strong support cluster formed by the monthly and weekly S1s at 76.2960 are likely to guide the Kiwi down to the monthly S2 at 74.80.
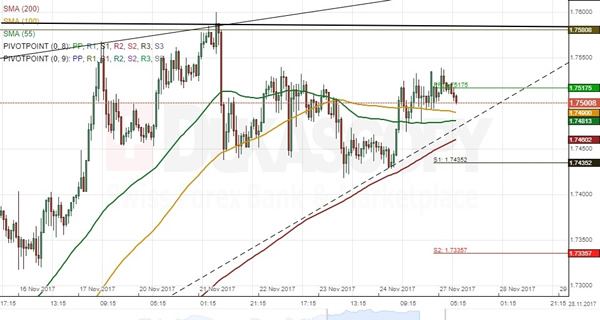
GBP/AUD 1H Chart: Pound Tests Long-Term Pattern
GBP/AUD has been trading in a flat channel down since mid-2016. Also, two additional channels up have prevailed within this senior pattern. After halting near the 1.62 mark and thus failing to reach the lower boundary of the senior channel in August, the Pound has since pushed up to the 1.76 area. This level coincides with the upper boundaries of both long– and medium-term channels. Despite testing 1.76 last Tuesday, the pair has since remained near this mark. This suggests that bulls might not yet be ready to give up their positions. Moreover, technical indicators likewise favour further advance during the next week. If the 1.76 area is breached, the rate might push up to 1.78 mark where the weekly R3 and the monthly R2 are located. On the other hand, a reversal of the 1.76 area is likely to guide the Pound towards the monthly PP at 1.7134.
EURUSD Analysis: Climbs To 1.1940 And Ready To Move Forwards
Even though the Euro climbed more sharply than expected amid the news that Merkel agreed to form coalition with the SD, the movement remained in line with general expectations. As long as the pair stays within the ascending channel that is backed up by the rising 55-, 100- and 200-hour SMAs, it is likely to continue advancing against the Dollar towards the 1.2000 mark that represents an intersection of the pattern’s upper boundary and the monthly R2. In shorter perspective bears might try to gain a momentum, although the plunge is unlikely to exceed the 1.1870 level, as this area is secured by the 61.8% retracement level, one of the above MAs and the weekly PP. However, the red scenario is unlikely due to formation of a minor pennant pattern, which presupposes further surge.
GBPUSD Analysis: Surges To 1.3360 But Then Retreats
On hourly chart the British Pound is continuing to gain value against the Dollar in a two-week long ascending channel. Generally, the cable is projected to continue heading to the top in the above pattern using support continuously provided by the rising 55- and 100-hour SMAs. The ultimate goal is located near the 1.3430 level and presents location of the upper boundary of a long-term dominant descending channel. However, before that the surge of the currency rate is likely to be stopped in the 1.3370-1.3380 resistance area. In case of retreat, strengthening of the buck in unlikely to exceed the 1.3300 mark, as this support zone is backed up by the updated weekly PP and the above 100-hour SMA. Finally, the only macro release, which might cause notable volatility will the US Prelim GDP.
USDJPY Analysis: Prepares To Test Support At 111.20
In line with expectations, by the end of the previous trading session the currency rate has reached the upper boundary of a currently active descending channel. As this barrier was additionally backed up by the 38.2% Fibonacci retracement level as well as the falling 100-hour SMA, the pair was forced to rebound. During first half of the day the pair is likely to get back to the 11.60 mark amid the push made by the 55-hour SMA. But subsequently the pair is expected to test support area between the 111.20-111.10 levels. Unless the Yen receives a proper impulse this barrier might ruin the pattern. However, such scenario unlikely to lead to rapid recovery of the buck, as on daily chart road to north is blocked by a combination of the 100- and 200-day SMAs.
XAUUSD Analysis: Heads Towards 1,293.00 Again
During the previous trading session the rate formed and made a breakout from junior symmetrical triangle pattern. Fortunately, a combined support formed by the 100-hour SMA and the updated weekly PP at 1,286.16 managed to turnaround the pair. In short run, the surge of the yellow metal once again is likely to be halted near the 1,293.00 and 1,295.00 resistance levels, which might lead to formation of a minor ascending triangle. But in larger perspective the pair is projected to reach the upper boundary of a medium-term ascending channel near the 1,300-1,302.00 marks. In support of this assumption, 55% of traders remain bullish on the given pair. Moreover, since that area is backed up by the 23.6% Fibonacci retracement level there is little chance that the pair will manage to breakout to the top.