
Sample Category Title
EUR/USD Mid-Day Outlook
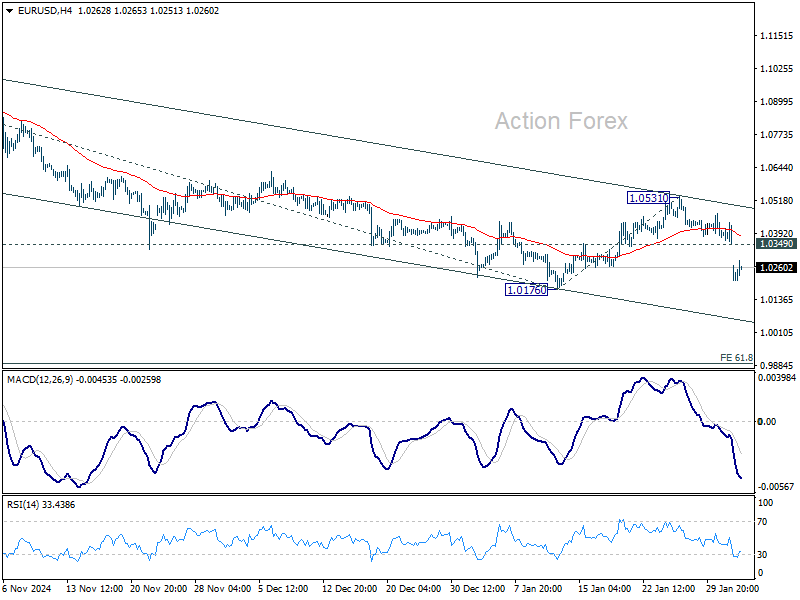
Daily Pivots: (S1) 1.0328; (P) 1.0381; (R1) 1.0412; More...
Intraday bias in EUR/USD remains on the downside for the moment. Decisive break of 1.0176 will resume whole fall from 1.1213. Next target will be 61.8% projection of 1.1213 to 1.0176 from 1.0531 at 0.9890. On the upside, above 1.0349 resistance will turn intraday bias neutral again first. But outlook will stay bearish as long as 1.0531 resistance holds, in case of strong recovery.
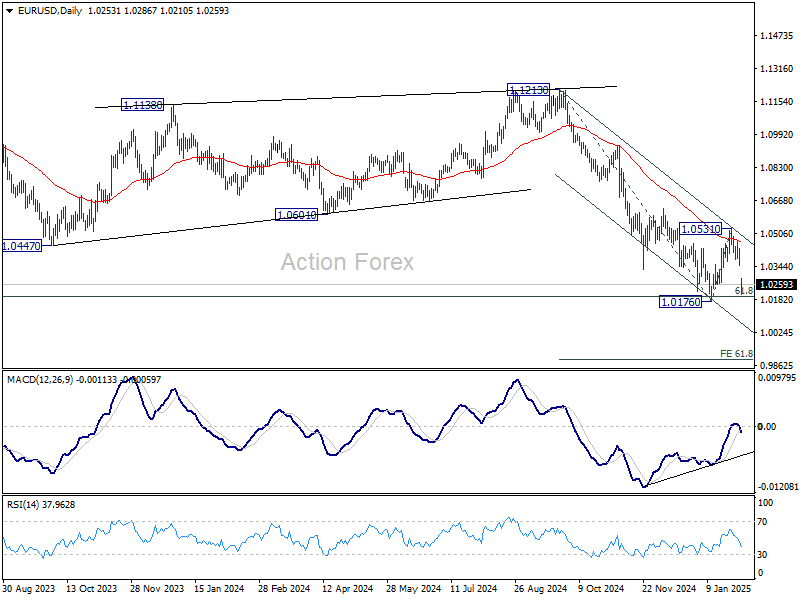
In the bigger picture, immediate focus is back on 61.8 retracement of 0.9534 (2022 low) to 1.1274 (2024 high) at 1.0199. Sustained break there will solidify the case of medium term bearish trend reversal, and pave the way back to 0.9534. For now, risk will stay on the downside as long as 1.0531 resistance holds, in case of rebound.
Eurozone CPI rises to 2.5% in Jan, core unchanged at 2.7%
Eurozone CPI rose from 2.4% yoy to 2.5% yoy in January, above expectation of 2.4% yoy. CPI core (ex-energy, food, alcohol & tobacco) was unchanged at 2.7% yoy, above expectation of 2.6% yoy.
Looking at the main components, services is expected to have the highest annual rate in January (3.9%, compared with 4.0% in December), followed by food, alcohol & tobacco (2.3%, compared with 2.6% in December), energy (1.8%, compared with 0.1% in December) and non-energy industrial goods (0.5%, stable compared with December).
UK PMI manufacturing finalized at 48.3, outlook remains weak
UK manufacturing sector remained in contraction at the start of 2025, with January’s final PMI rising slightly to 48.3 from December’s 11-month low of 47.0. Despite the modest improvement, four of the five key components—output, new orders, employment, and stocks of purchases—declined. The only positive indicator was longer average vendor lead times, which typically reflect supply chain constraints rather than stronger demand.
Rob Dobson, Director at S&P Global Market Intelligence noted that Weak domestic and international demand remains a key drag on the sector, with no clear signs of recovery in sight. Rising cost pressures are also adding to the strain, with input price inflation reaching a two-year high.
The effects of last year’s Budget changes, particularly increases in the minimum wage and employer National Insurance contributions, are expected to feed further into rising costs. These factors could keep pressure on profit margins and limit any near-term rebound in manufacturing activity. Business confidence remains low, hovering near December’s two-year low, reflecting ongoing uncertainty in both economic conditions and policy direction.
Eurozone PMI manufacturing finalized at 46.6, still too early to talk about greenshoots
Eurozone PMI Manufacturing was finalized at 46.6, up from December’s 45.1, marking an eight-month high. While still in contraction, the data suggests a slowdown in the sector’s decline. Germany’s PMI rose to 45.0, while France rose to 45.0. Austria (45.7) and Italy (46.3) also saw multi-month highs. Greece (52.8) and Spain (50.9) remained in expansion.
According to Cyrus de la Rubia, Chief Economist at Hamburg Commercial Bank, despite the improvement, manufacturing remains under pressure. It is "too early" to signal a full recovery. Rising input costs, driven by nearly 7% increase in oil prices, pose risks for firms already facing weak demand. ECB’s easing path could also be complicated if inflationary pressures persist.
The US is expected to impose tariffs on European exports. However, business confidence has improved, with future output expectations rising four points above the long-term average, partly driven by optimism surrounding upcoming elections in Germany and possibly France.
While Germany and France remain the weakest performers, the pace of contraction has slowed across multiple sectors. De la Rubia noted that over 90% of Eurozone exports go to markets outside the US, limiting the immediate impact of potential tariffs.
Aussie Falls to Five-Year Low on Trump, China Data
The Australian dollar is coming off a nasty week, declining 1.6%, and the slide has continued on Monday. AUD/USD fell as In the European session, AUD/USD is trading at 0.6146, down 1% on the day. Earlier, the Australian dollar fell as low as 0.6082, its lowest level since April 2020.
Trump tariffs, China PMI send Aussie reeling
It has been a dismal start to the trading week for the Australian dollar. There are two factors behind the Aussie’s latest troubles. First, US President Trumph has imposed 25% tariffs on Mexico and Canada, effective Tuesday. Mexico and Canada have both announced retaliatory tariffs in response, in what could quickly spiral into a full-blown trade war in the world’s largest trade zone.
Trump has also said he will go ahead on Tuesday with 10% tariffs against China, the world’s second largest economy. Global markets have been hit by fears of a global trade war resulting from the US tariffs and the Australian dollar, a risk curency, has been hit hard.
The Australian dollar has also reacted negatively to weak data out of China. The Caxain Manufacturing PMI slowed in January to 50.1, down from 50.5 in December and shy of the market estimate of 50.5. The reading was barely above the 50 level that separates expansion from contraction and indicated stagnation in factory activity.
Domestic demand improved in January but this was offset by a decline in export orders, as manufacturers rushed to ship orders in December to avoid the US tariffs. China’s government has introduced stimulus measures to prop up the economy and there has been improvement, such as in domestic demand. However, the Trump tariffs and a possible all-out trade between China and the US will hurt growth in both countries. So far, China has refrained from announcing retaliatory tariffs but China is unlikely to continue pulling its punches once the US tariffs take effect.
AUD/USD Technical
- AUD/USD is testing support at 0.6131. Below, there is support at 0.6062
- There is resistance at 0.6171 and 0.6240
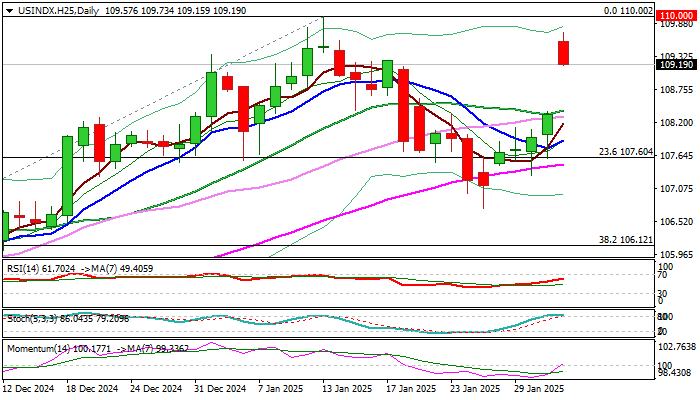
Dollar Surges Across the Board on US Trade Tariffs
The dollar index opened with gap-higher on Monday (up 1.1%), lifted by threats of trade war after US President Donald Trump imposed tariffs on imports from Canada, Mexico and China.
Two top US trading partners, Canada and Mexico immediately announced the counter measures, while China will look for assistance from World Trade Organization.
Although the dollar eased from the session peak, near-term structure remains firm, as daily studies improved (14-momentum emerged from negative territory, RSI rose above neutral 50 zone and MA’s turned into full bullish setup.
Markets see strong potential for further dollar’s rise in the environment of growing uncertainty over the negative consequences of trade war that fuels risk aversion.
Res: 109.73; 110.00; 110.50; 111.06
Sup: 108.61; 108.40; 107.89; 107.59
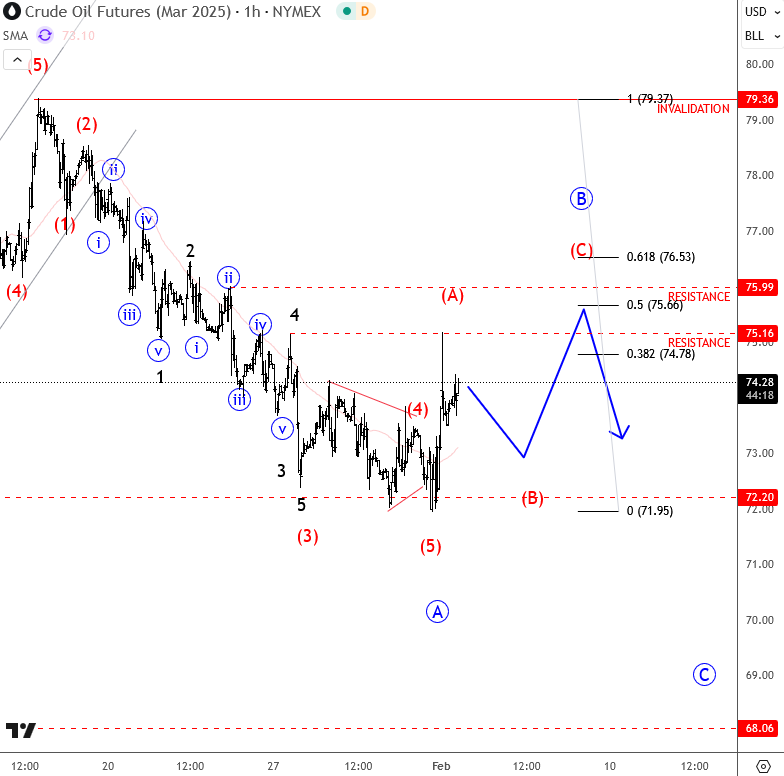
Crude Oil: More Weakness After Rally
Crude oil started the week with some volatility, driven by tariffs and trade war concerns. Despite the initial recovery, I see this as a temporary corrective reaction higher in Elliott wave terms, and that sooner or later weakness could resume. The most important is a five-wave impulsive decline from above $79, that suggests that the trend may have shifted, signaling further downside after an intraday wave B rally.
The first resistance is already around 75.16, but with the sharp price movement into this area, I think there’s room for slightly higher prices within the a-b-c structure. Still, I expect bears to be back this week, as long as the market remains below the 79.36 invalidation level.
US30: Decline Ahead
US30, Daily
US30 bounced from the crucial 45000 resistance level and faces the 44000 support level.
- %R and MFI leave the overbought zone, with the price breaches below the DEMA and TEMA lines, giving a bearish sentiment.
- Consider a short trade if it breaks below the 44000 support level, with the target at 43300.
Market Analysis: GBP/USD and EUR/GBP Fall Into The Red
GBP/USD failed to climb above 1.2500 and trimmed all gains. EUR/GBP is declining and trading below the 0.8400 support level.
Important Takeaways for GBP/USD and EUR/GBP Analysis Today
- The British Pound is showing bearish signs below 1.2400.
- There is a short-term declining channel forming with resistance near 1.2280 on the hourly chart of GBP/USD at FXOpen.
- EUR/GBP is declining and showing bearish signs below 0.8400.
- There is a key bearish trend line forming with resistance at 0.8370 on the hourly chart at FXOpen.
GBP/USD Technical Analysis
On the hourly chart of GBP/USD at FXOpen, the pair started a fresh decline from the 1.2470 zone. As mentioned in the previous analysis, the British Pound struggled to extend gains and declined below the 1.2360 support level against the US Dollar.
There was a clear move below the 1.2320 level. The pair even settled below the 1.2300 level and the 50-hour simple moving average. The pair tested the 1.2250 support zone.
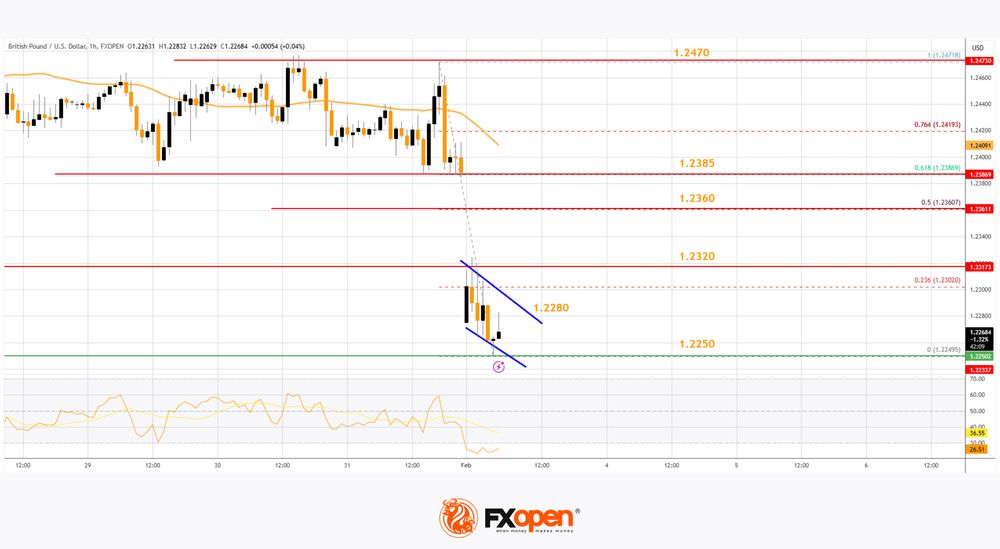
A low was formed at 1.2249 and the pair is now consolidating losses. On the upside, the GBP/USD chart indicates that the pair is facing resistance near 1.2280 and a short-term declining channel. The next major resistance is near the 1.2320.
A close above the 1.2320 resistance zone could open the doors for a move toward the 50% Fib retracement level of the downward move from the 1.2471 swing high to the 1.2249 low at 1.2360.
Any more gains might send it toward the 61.8% Fib retracement level of the downward move from the 1.2471 swing high to the 1.2249 low at 1.2385. If not, the pair could resume its decline below 1.2250. On the downside, there is a key support forming near 1.2220.
If there is a downside break below the 1.2220 support, the pair could accelerate lower. The next major support is near the 1.2150 zone, below which the pair could test 1.2050. Any more losses could lead the pair toward the 1.2000 support.
EUR/GBP Technical Analysis
On the hourly chart of EUR/GBP at FXOpen, the pair struggled to gain pace for a move above 0.8420. The Euro settled below 0.8400 and started a fresh decline against the British Pound.
There was a clear move below the 0.8350 pivot level. The EUR/GBP chart suggests that the pair settled below the 50-hour simple moving average and 0.8340. A low is formed near 0.8307 and the pair is now consolidating losses.
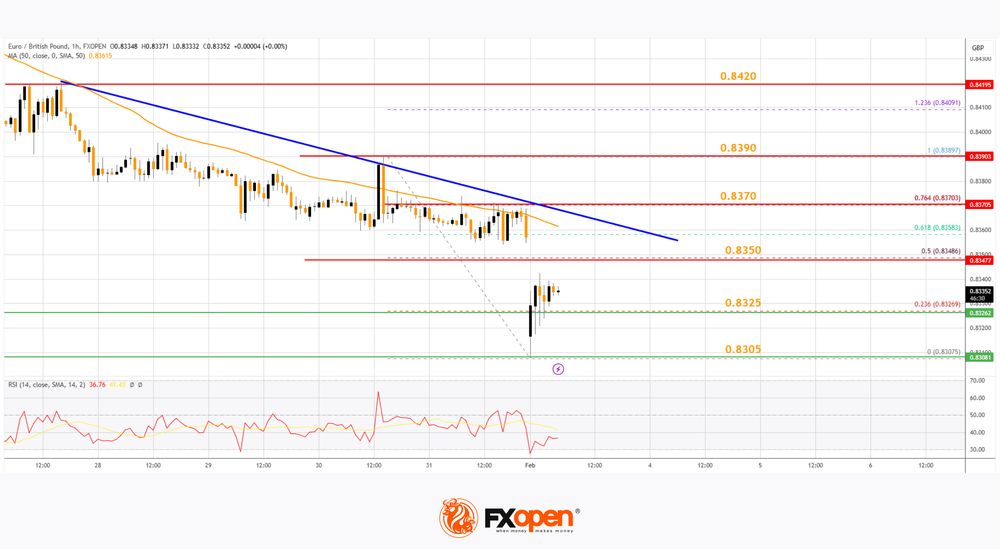
Immediate resistance is near the 50% Fib retracement level of the downward move from the 0.8389 swing high to the 0.8307 low at 0.8350.
The next major resistance could be near the 50-hour simple moving average and the 61.8% Fib retracement level of the downward move from the 0.8389 swing high to the 0.8307 low at 0.8370. There is also a key bearish trend line forming with resistance at 0.8370.
A close above the 0.8370 level might accelerate gains. In the stated case, the bulls may perhaps aim for a test of 0.8420. Any more gains might send the pair toward the 0.8450 level.
Immediate support sits near 0.8325. The next major support is near 0.8305. A downside break below the 0.8305 support might call for more downsides. In the stated case, the pair could drop toward the 0.8265 support level.
Trade over 50 forex markets 24 hours a day with FXOpen. Take advantage of low commissions, deep liquidity, and spreads from 0.0 pips. Open your FXOpen account now or learn more about trading forex with FXOpen.
This article represents the opinion of the Companies operating under the FXOpen brand only. It is not to be construed as an offer, solicitation, or recommendation with respect to products and services provided by the Companies operating under the FXOpen brand, nor is it to be considered financial advice.
Trump’s Tariffs Push USD/CAD to a 22-Year High
As promised during his election campaign, US President Donald Trump introduced tariffs just two weeks after his inauguration:
→ 25% on goods from Canada and Mexico, prompting both countries to vow retaliatory measures.
→ 10% on Chinese goods, with China announcing plans to challenge the decision at the World Trade Organization.
The tariffs will take effect on 4 February. Trump acknowledged potential economic pain but justified the measures as necessary to combat illegal immigration and drug trafficking, arguing that the long-term benefits would outweigh the costs.
Trump’s decision:
→ Led to a decline in US stock indices, as analysts fear a potential trade war and global stagflation (sluggish economic growth amid high inflation). Further tariffs on Europe may follow.
→ Strengthened the US dollar, which gained around 1% against major currencies.
According to the USD/CAD chart, the Canadian dollar is trading around 1.4700 against the US dollar—a level last seen in early 2003.
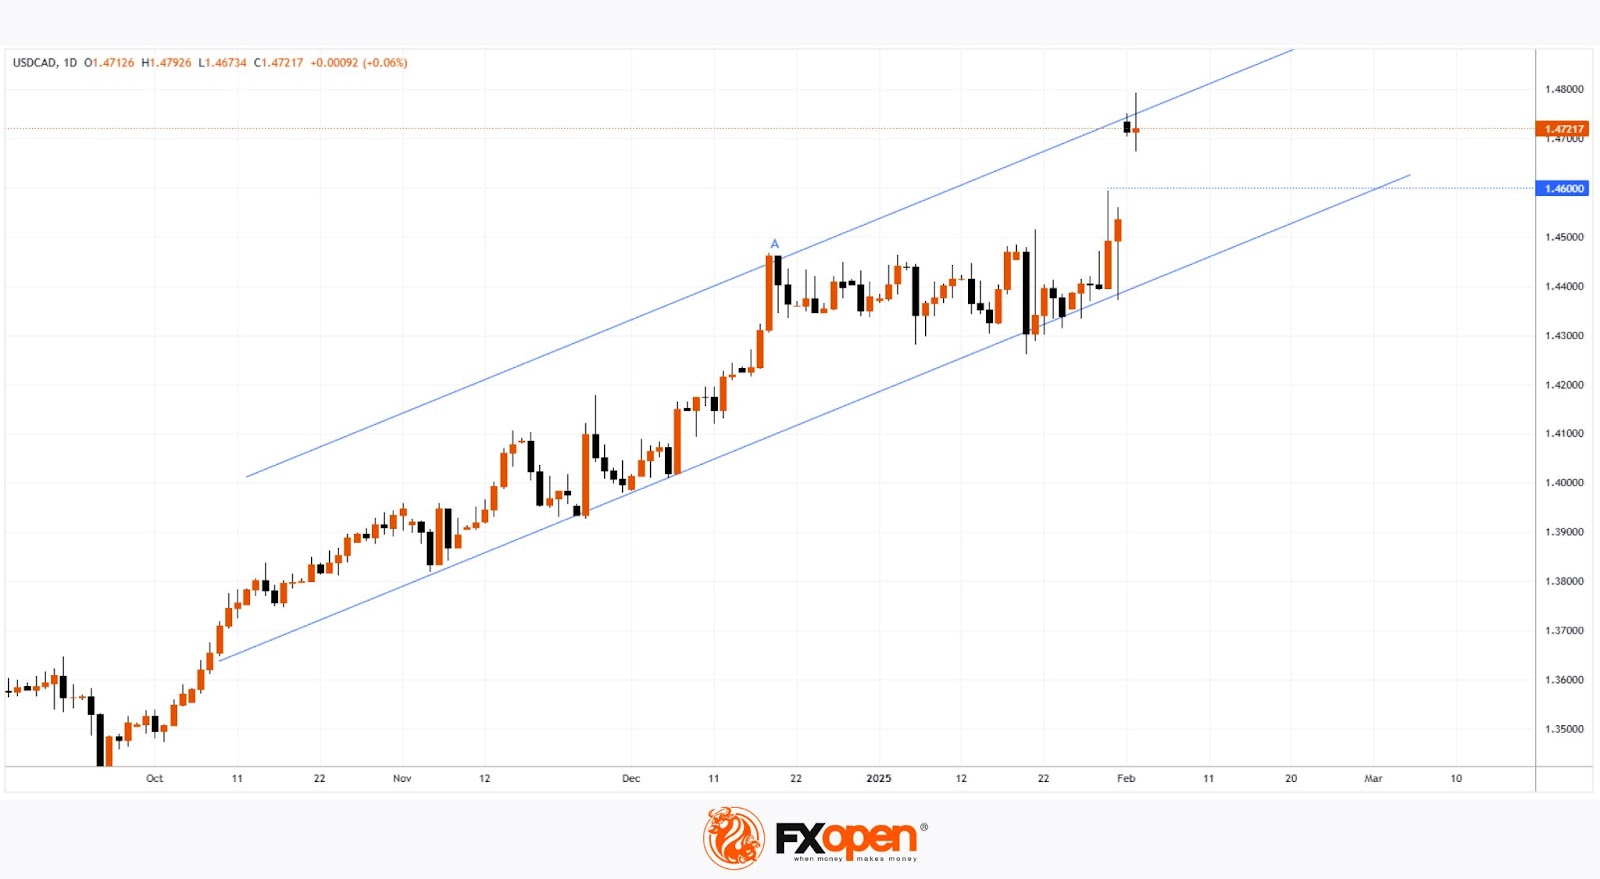
On 30 January, our USD/CAD technical analysis highlighted the significance of a key trendline supporting the uptrend since last autumn. Now, by drawing a parallel line through December’s peak (A), we can identify a resistance level where the pair is currently stabilising.
A large bullish gap has also formed on the chart. The lower boundary around 1.4600 may act as technical support in the short term, though broader price movements will likely be driven by fundamental factors.
Trade over 50 forex markets 24 hours a day with FXOpen. Take advantage of low commissions, deep liquidity, and spreads from 0.0 pips. Open your FXOpen account now or learn more about trading forex with FXOpen.
This article represents the opinion of the Companies operating under the FXOpen brand only. It is not to be construed as an offer, solicitation, or recommendation with respect to products and services provided by the Companies operating under the FXOpen brand, nor is it to be considered financial advice.