Sample Category Title
GBP/USD Candlesticks and Ichimoku Analysis
Weekly
• Last Candlesticks pattern: Shooting star
• Time of formation: 31 Jul 2017
• Trend bias: Down
Daily
• Last Candlesticks pattern: Morning star
• Time of formation: 25 Aug 2017
• Trend bias: Near term up
GBP/USD – 1.3211
Although cable fell briefly to 1.3070 late last week, lack of follow through selling on break of previous support at 1.3088 and the subsequent rebound formed a doji star (with a long lower shadow) followed by a white candlestick, suggesting further choppy trading would be seen and recovery to 1.3225-30 cannot be ruled out, however, still reckon upside would be limited to 1.3279-87 resistance area and bring retreat later. A daily close above this level would suggest the retreat from 1.3338 has ended at 1.3070, then another leg of corrective rise from 1.3027 low would take place for test of 1.3338, break there would extend gain to 1.3400, then test of previous resistance at 1.3455 which is likely to hold on first testing.
On the downside, whilst pullback to 1.3140-50 cannot be ruled out, said support at 1.3070 should remain intact and bring another rebound later. A break below this level would revive bearishness and bring retest of recent low at 1.3027 but only a drop below this level would confirm early decline from 1.3658 top has resumed and extend weakness to 1.3000, then towards 1.2940-50 later.
Recommendation: Stand aside for this week.
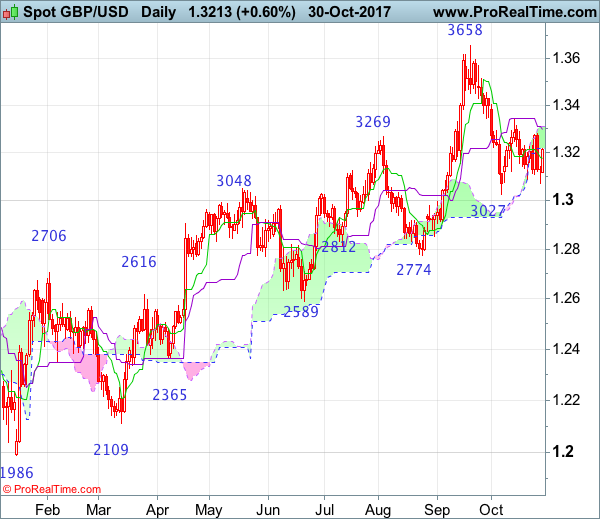
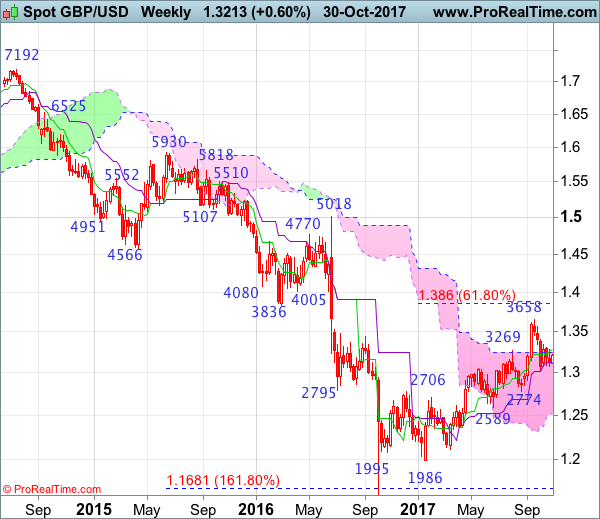
On the weekly chart, despite last week’s fall to 1.3070, lack of follow through selling on break of previous support at 1.3088 and the subsequent bounce suggest sterling has remained confined within near term established range, hence further sideways trading is in store and recovery to 1.3225-30 cannot be ruled out, however, as outlook remains consolidative, reckon upside would be limited to 1.3279-87, price should falter below resistance at 1.3338 and bring retreat later. Only above 1.3338 would signal the retreat from 1.3658 has possibly ended, bring a stronger rebound to 1.3400-05 and possibly towards but price should falter well below said resistance at 1.3658. In the event sterling breaks above 1.3571 resistance, this would bring a retest of this last month’s high at 1.3658, break there would extend recent erratic rise from 1.1986 low to 1.3750-60 and 1.3800 but overbought condition should prevent sharp move beyond 1.3860 (61.8% Fibonacci retracement of 1.5018-1.1986).
On the downside, expect pullback to be limited to 1.3125-30 and said support at 1.3070 should hold, bring another rebound. A weekly close below 1.3070 support would signal the rebound from 1.3027 low has ended, bring retest of 1.3027, break of this support would add credence to our view that top has been formed at 1.3658, bring further fall to 1.3000, then towards support at 1.2909, however, anticipated near term oversold condition should prevent sharp fall below previous chart support at 1.2774 and price should stay well above another previous chart support at 1.2589, bring rebound later.
USD/CHF Candlesticks and Ichimoku Analysis
Weekly
• Last Candlesticks pattern: Shooting star
• Time of formation: 7 Mar 2017
• Trend bias: Sideways
Daily
• Last Candlesticks pattern: Morning star
• Time of formation: 9 May 2017
• Trend bias: Near term up
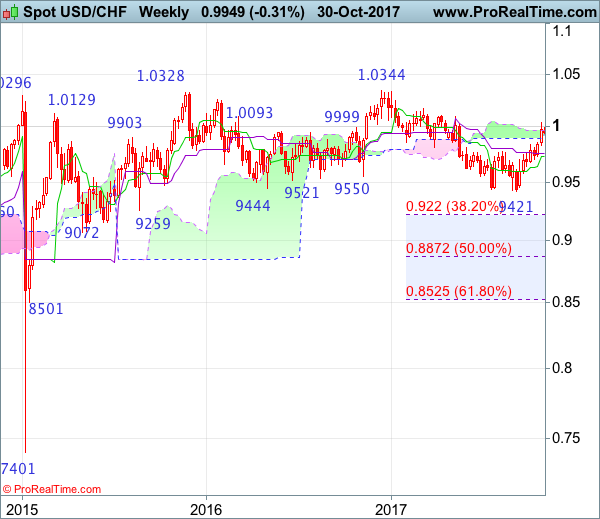
USD/CHF – 0.9970
Although the greenback rose briefly to 1.0039 late last week, the subsequent quick retreat from there formed a shooting star candlestick reversal pattern, hence consolidation below this level would be seen with initial downside bias for pullback to the Tenkan-Sen (now at 0.9888), however, reckon the Kijun-Sen (now at 0.9841) would limit downside and bring another rise later, above said resistance at 1.0039 would extend the rise from 0.9421 low for retracement of early decline from 1.0344 to 1.0050, then towards resistance at 1.0100 which is likely to hold on first testing.
On the downside, a daily close below the Kijun-Sen (now at 0.9841) would bring weakness to 0.9770, however, only a daily close below support at 0.9737 would signal top has been formed instead, bring at least a retracement of recent rise to 0.9700, then test of minor support at 0.9670. A drop below this level would suggest the rise from 0.9421 has ended instead, risk further fall to 0.9642 support but reckon downside would be limited to 0.9590-00 and support at 0.9565 should remain intact.
Recommendation: Buy at 0.9830 for 1.0030 with stop below 0.9730.
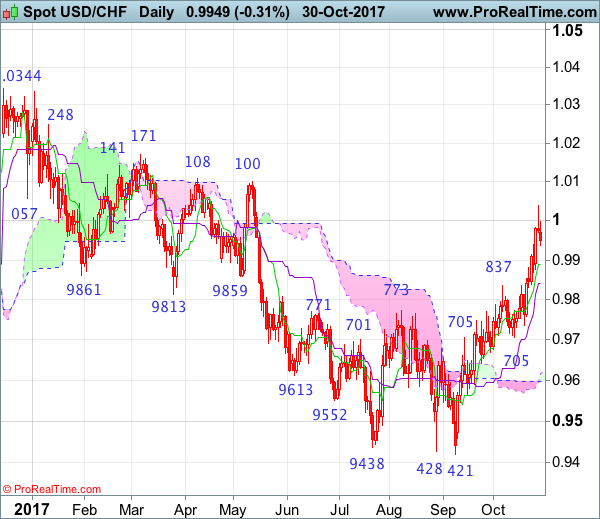
On the weekly chart, last week’s rally to 1.0039 formed another white candlestick, adding credence to our near term bullish view that the rebound from 0.9421 low is still in progress and upside bias remains for this move to extend further gain towards resistance at 1.0100-08, however, near term overbought condition should prevent sharp move beyond previous resistance at 1.0171 and 1.0200-10 should hold from here, risk from there is seen for a retreat to take place later.
On the downside, although initial pullback to 0.9890-00 is likely, reckon 0.9800 would limit downside and bring another rise later. Below the Kijun-Sen (now at 0.9761) would bring test of 0.9730-37 (current level of the Tenkan-Sen and previous support) but break there is needed to signal top is formed and suggest first leg of rebound from 0.9737 has ended and bring weakness to 0.9690-00, however, reckon support at 0.9642 would limit downside and price should stay above support at 0.9565 and the greenback shall stage another strong rebound next month.
GBP/USD Elliott Wave Analysis
GBP/USD – 1.3210
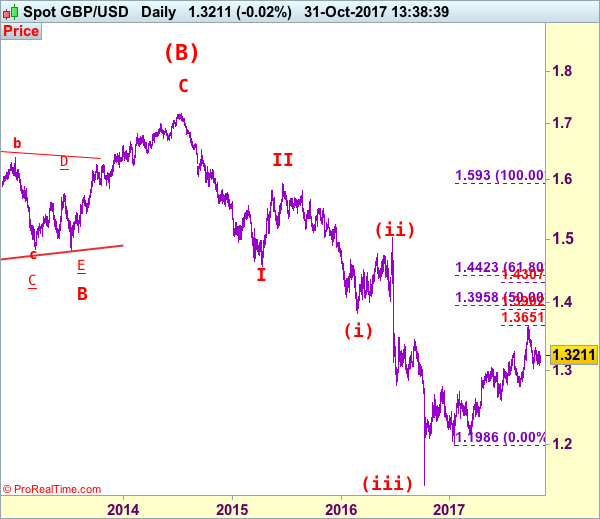
Despite falling to 1.3070 late last week, lack of follow through selling on break of previous support at 1.3088 and the subsequent rebound suggest the decline from 1.3658 top is not ready to resume yet, hence further consolidation would take place and recovery to 1.3279-87 resistance cannot be ruled out, however, resistance at 1.3338 should hold from here. Only a break of 1.3338 would signal another leg of rebound from 1.3027 is underway for further subsequent gain to 1.3400 and possibly towards resistance at 1.3455. Having said that, if our view that top has been formed at 1.3658 is correct, upside would be limited to 1.3500-10 and bring another decline later.
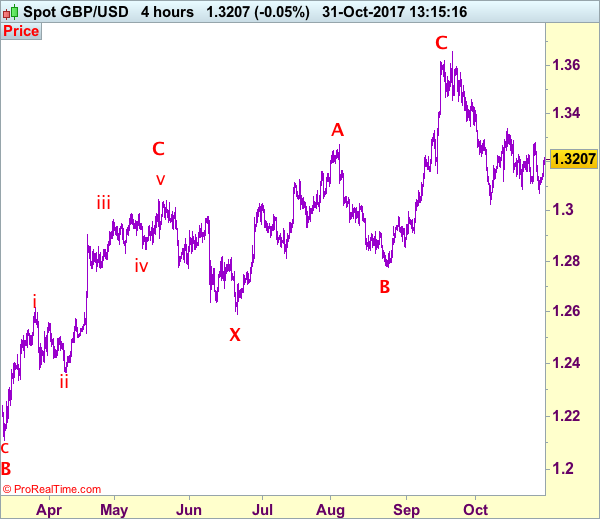
Our preferred count on the daily chart is that cable's rebound from 1.3500 (wave (A) trough) is unfolding as a wave (B) with A ended at 1.7043, followed by triangle wave B and wave C as well as wave (B) has possibly ended at 1.7192, below support at 1.4232 would add credence to this count, then further fall to 1.4000 level would follow but reckon downside would be limited to 1.3655 support and price should stay above previous support at 1.3500.
On the downside, whilst pullback to 1.3150 cannot be ruled out, reckon 1.3100-10 would limit downside and bring another rebound later. Only a drop below said support at 1.3070 would revive bearishness and signal early rebound from 1.3027 has ended at 1.3338, bring retest of this level. Looking ahead, a drop below 1.3027 would confirm the fall from 1.3658 top has resumed for weakness to 1.3000, then towards 1.2950 but support at 1.2909 should limit downside and another previous support at 1.2852 would remain intact.
Recommendation: Short entered at 1.3300 stopped profit at 1.3250 and would stand aside for this week.
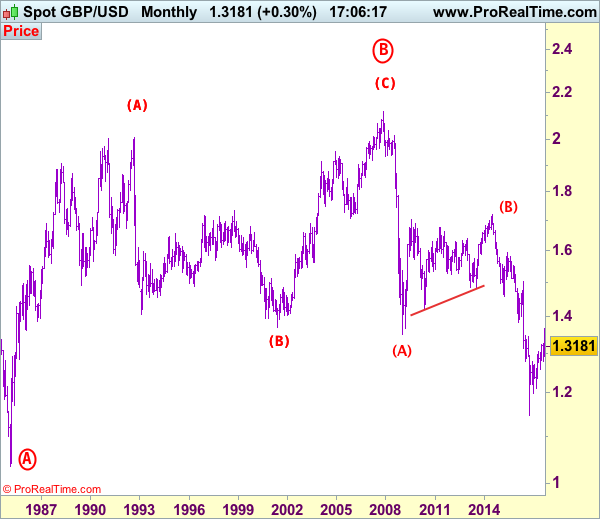
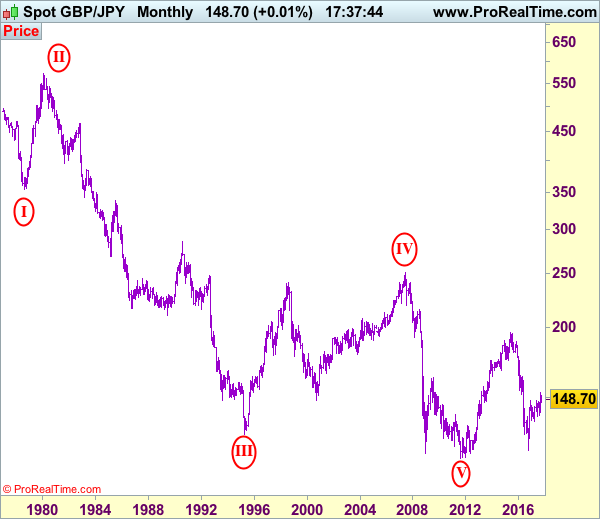
Longer term - Cable's rise from 1.0520 (Feb 1985) to 2.0100 (September 1992) is seen as [A], the decline to 1.3682 is labeled as (B) and (C) wave rally has ended at 2.1162 (9 Nov, 2007) which is also the top of larger degree wave B with circle. The selloff from there is a 5-waver with wave (A) ended at 1.3500 (23 Jan 2009), wave (B) itself is labeled as A: 1.6733, triangle wave B: 1.4813 and wave C as well as top of wave (B) ended at 1.7192 (2014), hence the selloff from there is an impulsive wave (C) with wave I : 1.4566, wave II 1.5930, an extended wave III is unfolding and already exceeded our downside target at 1.3500 and 1.3000, hence weakness to 1.2500 and possibly 1.2000 cannot be ruled out, however, price should stay well above psychological level at 1.0000.
GBP/JPY Elliott Wave Analysis
GBP/JPY – 149.35
Although sterling rose to as high as 151.40 last week, the subsequent retreat suggests consolidation below this level would be seen and pullback to 148.50-60 is likely, however, break of support at 147.75-80 is needed to signal the rebound from 146.95 has ended, then another leg of corrective decline from 152.85 top is underway for retracement of recent rise to 146.00, then towards support at 145.25 but near term oversold condition should limit downside to 144.50 and 143.95-00 should remain intact.
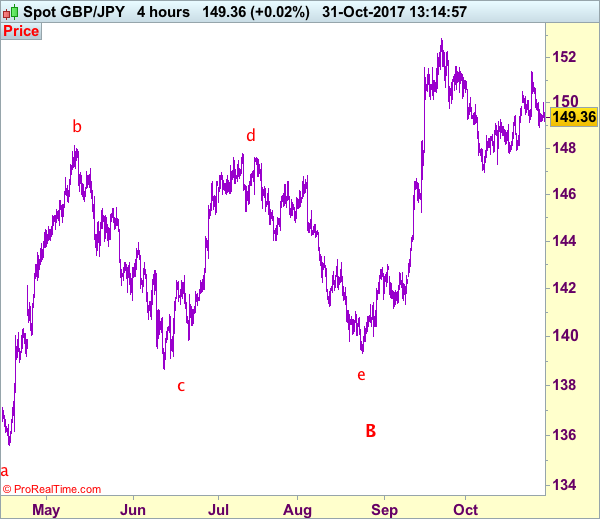
Our preferred count is that larger degree wave V with circle is unfolding from 251.12 with wave (I) 219.34, (II): 241.38 and wave (III) is subdivided into 1: 192.60, 2: 215.89 (23 Jul 2008) and wave 3 ended at 118.87 earlier in 2009. The correction from there to 162.60 is wave 4 which itself is a double three and is labeled as first a-b-c ended at 151.53, followed by wave x at 139.03, 2nd a ended at 162.60, 2nd b at 146.75 and 2nd c leg of wave 4 ended at 163.00. Therefore, the decline from 163.00 to 116.85 is now treated as wave 5 which also marked the end of larger degree wave (III), hence wave (IV) major correction has commenced for retracement of the wave (III) from 241.38 and upside target at 183.95-00 (50% Fibonacci retracement of the wave (II) from 241.38) had been met, a drop below 160.00 would suggest wave (IV) has ended at 195.85, bring decline in wave (V) for initial weakness to 130 (already met) and 120.
On the upside, whilst initial recovery to 150.50-55 cannot be ruled out, said resistance at 151.40 should remain intact and bring further consolidation. A daily close above said resistance at 151.40 would signal the rebound from 146.95 is still in progress and may extend gain to 152.00 but said recent his at 152.85 should remain intact, bring further consolidation. A break of this level would extend recent upmove from 120.50 low (wave v trough) for subsequent gain to 153.50-60, then 154.00-10, however, sharp move beyond 155.00 should not be repeated, risk from there has increased for a correction to take place later.
Recommendation: Stand aside for this week.
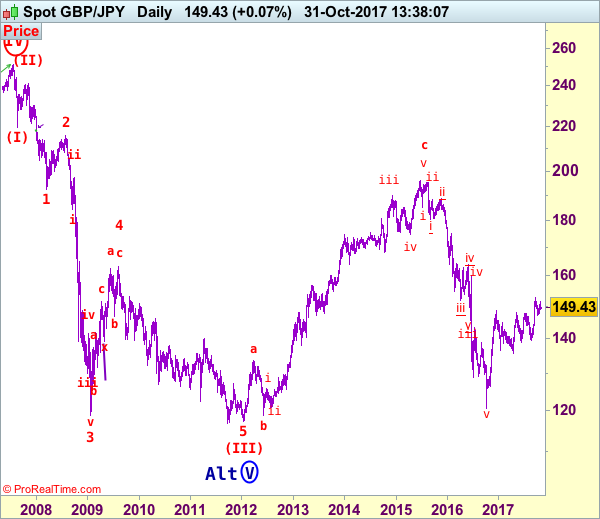
The long-term downtrend from 570.99 (29 Feb 1980) is labeled as an impulsive wave with III with circle ended at 129.77 (20 Apr 1995) and the corrective rebound to 251.12 (20 Jul 2007) is treated as wave IV with circle and the wave V with circle selloff from 251.12 has possibly ended at 116.80 (almost reached our indicated target at 116.00) and major correction has commenced from there and indicated upside target at 183.90-00 (50% Fibonacci retracement of 251.10-116.85) had been met, reckon upside would be limited to 199.80-90 (61.8% Fibonacci retracement) and bring wave (V) decline in later part of 2017.
Trade Idea: GBP/USD – Hold short entered at 1.3195
GBP/USD – 1.3210
Original strategy :
Sold at 1.3195, Target: 1.3030, Stop: 1.3255
Position: - Short at 1.3195
Target: - 1.3030
Stop: - 1.3255
New strategy :
Hold short entered at 1.3195, Target: 1.3030, Stop: 1.3255
Position: - Short at 1.3195
Target: - 1.3030
Stop:- 1.3255
As sterling has maintained a firm undertone after staging a strong rebound from 1.3070, suggesting near term upside risk remains and marginal gain from here cannot be ruled out, however, as broad outlook remains consolidative, reckon upside would be limited to 1.3240-50 and bring retreat later, below 1.3115-20 would suggest the rebound from 1.3070 has ended, bring test of this level, below there would extend weakness towards 1.3027 support. Looking ahead, a break below there is needed to confirm early decline from 1.3658 top has resumed for further fall to psychological support at 1.3000 first.
In view of this, we are holding on to our short position entered at 1.3195. Above 1.3240-50 would defer and prolong choppy consolidation, risk rebound to indicated resistance area at 1.3279-87 which is likely to hold from here. Our preferred count is that (pls see the attached chart) the wave IV is unfolding as a complex double three (ABC-X-ABC) correction with 2nd wave B ended at 1.2774, hence 2nd wave C could have ended at 1.3658.
Our preferred count on the daily chart is that cable's rebound from 1.3500 (wave (A) trough) is unfolding as a wave (B) with A ended at 1.7043, followed by triangle wave B and wave C as well as wave (B) has ended at 1.7192, the subsequent selloff is the larger degree wave (C) which is still unfolding with minor wave (III) of larger degree wave 3 ended at 1.1986, hence wave (IV) correction is in progress which could either be a triangle wave (IV) of a complex formation but upside should be limited to 1.3500 and price should falter well below 1.4000, bring another decline in wave (V) of 3 for weakness to 1.1500, then 1.1200.
Market Morning Briefing: Keep On Eye On Possible Big Movement In Dollar-Yen
STOCKS
Global stock indices are all strong and the bulls do not seem to leave the ground just now except Shanghai and Nikkei. Nikkei could be vulnerable to a fall in the coming sessions while Shanghai remains range-bound.
Dow (23348.74, -0.36%) has been stable near current levels for the last 3-4 sessions. 23250-23500 region holds for now with a possible break on the upside towards 23750 in the medium term.
Dax (13229.57, +0.09%) was almost stable yesterday and there is scope of a rise towards 13300-13500 in the coming sessions. Near to medium term looks bullish.
21700 is the immediate support on the Nikkei (21991.16, -0.08%) but the index is likely to come below 21700-21600 levels in the medium term. The fall in Dollar Yen has from 114.50 levels could be indicative of a fall in Nikkei going forward. In that case a test of 22666 on the upside for Nikkei is doubtful.
Shanghai (3380.51, -0.29%) is trading well within the 3360-3425 region and this range could hold for some sessions in the near term. A re-test of 3350 looks likely.
Nifty (10363.65, +0.39%) is trying to reach towards 10400, attempting a break above current resistance for the last 3-sessions. A break above 10400, if seen could open up chances of 10500-10600 in the near term; else a sharp correction from 10400 could be expected towards 10250.
COMMODITIES
Gold (1275.74) has immediate support zone of 1260-1240 which is likely to hold in the near term. Some stable movement with a possible downside extension is possible in early November followed by a bounce back towards 1300 levels. A break below 1240, if seen could turn very bearish for the coming weeks.
Silver (16.81) is almost stable and could trade within 16.50-17.00 region for the next few sessions.
Brent (60.83) has almost moved up to our initial target of 61 and it would be crucial to see if the price comes off from there or breaks higher to make fresh highs in the current rally, heading towards 63. A rejection is expected either from 61 just now or from higher levels near 63. Near term looks bullish.
WTI (54.07) is also quiet and could possibly attempt a rise towards 55-56 levels in the near to medium term before coming off from there.
Copper (3.1035) could come off to test immediate support near 3.05 which is likely to hold in the first testing, producing a bounce to 3.15/20 again.
FOREX
Keep on eye on possible big movement in Dollar-Yen.
As warned, Dollar-Yen (113.08) has come down to a low of 112.97, dragging the Euro-Yen (131.59) lower with it even as the Euro (1.1636) recovered a bit.
The dip in Dollar-Yen possibly confirms the strength of the 114.50-115.00 Resistance and opens up chances of further fall towards 112. A Day Close below 113.00 is needed to confirm. The Euro-Yen too looks like it can dip further to 130 at least.
This suggests the Euro will be subdued around 1.16. We have a Bear SHS target near 1.15.
As expected, the Pound (1.3203) is trading sideways between 1.3040-3300 and can move to the upper end of the range. The Aussie (0.7675) rose to almost 0.7700 yesterday. It has Support at 0.7630-20 and might try to move up further while that holds.
Dollar-Yuan (6.6317) has dipped a bit from yesterday's 6.6438. Dollar-Rupee (64.8550) has dipped to 64.80 yesterday. Need to see if it continues to hold above 64.70 today or not.
INTEREST RATES
There's been a sharp dip in US yields (5Yr 1.99%, 10Yr 2.36% and 30Yr 2.87%) compared to 2.04%, 2.43% and 2.94% respectively. This is a bit of a surprise ahead of tomorrow's FOMC meeting even as the US PCE moved up to +1.14% (y/y) yesterday.
As expected, however, the US yield curve has flattened again a bit, with the 30-5 (0.88%) coming down from 0.91%.
The US-Japan 10Yr Spread (2.30%) has seen dip from levels near 2.38% last week. A break below 2.30%, if seen, could be bearish for Dollar-Yen. This is to be kept an eye on.
Trade Idea: GBP/JPY – Hold short entered at 150.00
GBP/JPY - 149.40
Original strategy:
Sold at 150.00, Target: 148.00, Stop: 150.60
Position: - Short at 150.00
Target: - 148.00
Stop: - 150.60
New strategy :
Hold short entered at 150.00, Target: 148.00, Stop: 150.60
Position: - Short at 150.00
Target: - 148.00
Stop:- 150.60
Although sterling rebounded yesterday to 150.00, the British pound did meet renewed selling interest there and has retreated, adding credence to our bearish view (we recommended to sell at 150.00 and a short position was entered) that the rebound from 146.95 has ended at 151.40 last week, hence consolidation with downside bias remains for weakness to 148.50, then 148.00, however, break of support at 147.80 is needed to retain bearishness and signal another leg of decline from 152.85 top is underway for further fall towards said support at 146.95.
In view of this, we are holding on to our short position entered at 150.00. Above 150.50-60 would prolong consolidation and bring rebound to 151.00 but said resistance at 151.40 should hold. Only a break of this resistance would revive bullishness and extend the rebound from 146.95 towards 151.90-00 first.
Our preferred count is that larger degree wave V with circle is unfolding from 251.12 with wave (I) 219.34, (II): 241.38 and wave (III) is subdivided into 1: 192.60, 2: 215.89 (23 Jul 2008) and wave 3 ended at 118.87 earlier in 2009. The correction from there to 162.60 is wave 4 which itself is a double three and is labeled as first a-b-c ended at 151.53, followed by wave x at 139.03, 2nd a ended at 162.60, 2nd b at 146.75 and 2nd c leg of wave 4 ended at 163.00. Therefore, the decline from 163.00 to 116.85 is now treated as wave 5 which also marked the end of larger degree wave (III), hence wave (IV) major correction has commenced for retracement of the wave (III) from 241.38 and upside target at 183.95-00 (50% Fibonacci retracement of the wave (II) from 241.38) had been met, a drop below 160.00 would suggest wave (IV) has ended at 195.85, bring decline in wave (V) for initial weakness to 130 (already met) and 120.
Trade Idea: EUR/JPY – Sell at 132.70
EUR/JPY - 131.55
Original strategy:
Sell at 132.70, Target: 130.70, Stop: 133.30
Position: -
Target: -
Stop: -
New strategy :
Sell at 132.70, Target: 130.70, Stop: 133.30
Position: -
Target: -
Stop:-
As the single currency has remained under pressure after dropping sharply from 134.50 and the breach of previous support at 131.66 adds credence to our view that top has been formed there, hence consolidation with downside bias remains for a correction of early upmove to 131.00, then towards 130.50-60, however, near term oversold condition should limit downside to psychological level at 130.00, bring rebound later.
In view of this, we are still looking to sell euro on recovery as 132.70-80 should limit upside and bring another decline later. Above 133.10 would defer and suggest first leg of corrective decline from 134.50 top has ended, risk a stronger rebound to 133.50-60 but still reckon upside would be limited to 133.95-00, price should falter well below said last week’s high at 134.50, bring another selloff later.
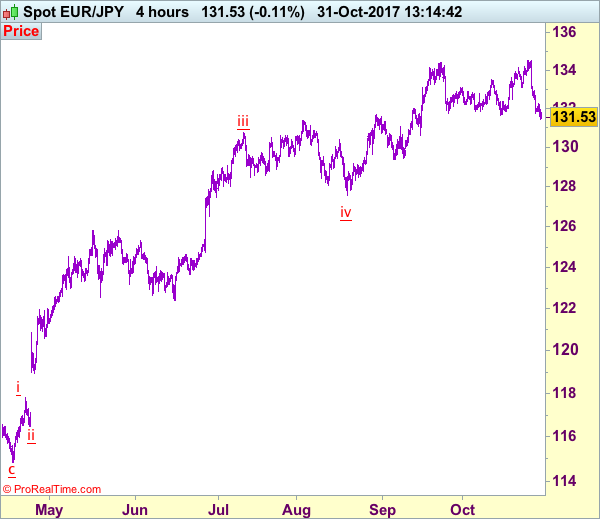
Our latest preferred count is that wave (ii) is ABC-X-ABC which ended at 123.33 and wave (iii) is unfolding with wave iii ended at 100.77, followed by wave iv at 111.57 and wave v as well as the wave (iii) has ended at 97.04, followed by wave (iv) at 111.43 and wave (v) has ended at 94.12 which is also the end of the larger degree v, this also implied the major wave (C) has also ended there, hence major correction has commenced from there with (A) leg unfolding in its lower degree wave c which has possibly ended at 145.69. Under this count, A-B-C wave (B) has commenced with A leg ended at 136.23, wave B at 143.79 and wave C has possibly ended at 149.79.
Our larger degree count is that the decline from 139.26 is wave (C) and is sub-divided into a diagonal triangle i-ii-iii-iv-v with wave i - 105.44, wave ii- 123.33, wave iii - 97.03, wave iv - 111.43, followed by the final wave v as well as the end of wave (C) at 94.12, this also mark the bottom of larger degree wave B. Under this count, major rise in wave C has commenced as an impulsive wave with minor wave III ended at 145.69, wave V is still in progress for further gain to 150.00. Having said that, this so-called wave V could well be the first leg of larger degree 5-waver wave C and this wave C should bring at least a retest of wave A top at 169.97 (July 2008).
Trade Idea: AUD/USD – Sell at 0.7720
AUD/USD – 0.7675
Original strategy:
Sell at 0.7720, Target: 0.7550, Stop: 0.7780
Position: -
Target: -
Stop:-
New strategy :
Sell at 0.7720, Target: 0.7550, Stop: 0.7780
Position: -
Target: -
Stop:-
Aussie’s recovery after finding support at 0.7625 late last week suggests consolidation above this level would be seen and corrective bounce to 0.7700 cannot be ruled out, however, reckon 0.7720-25 would limit upside and bring another decline later, below said support would add credence to our view that recent decline from 0.8125 top is still in progress and may extend further weakness to 0.7600, having said that, loss of downward momentum should prevent sharp fall below 0.7550 and reckon 0.7500 would hold from here, bring rebound later.
In view of this, we are looking to reinstate short on recovery as 0.7720-25 should limit upside and bring another decline. Above previous support at 0.7770 would defer and suggest a temporary low is possibly formed, bring rebound to 0.7800 and then towards 0.7825-35 later.
On the 4-hour chart, recent upmove from 0.7329 is unfolding as an impulsive rise with wave 3 as well as smaller degree wave (iii) extending, only minor wave v of (iii) has ended at 0.8125, hence bullishness remains for this move to extend headway to 0.8200, then towards 0.8300, however, reckon upside would be limited to 0.8400 and the final wave 5 should falter below 0.8500, bring correction later.

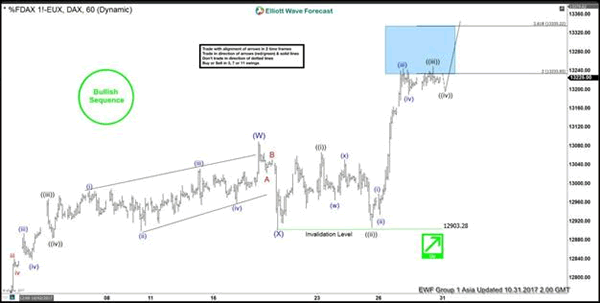
Elliott Wave View: DAX Short-Term
DAX shows a 5 swing Elliott Wave bullish sequence from 8/29 low, suggesting further upside is likely. The rally from 8/29 low is unfolding as a double three Elliott Wave structure where Intermediate wave (W) ended at 13089 and Intermediate wave (X) ended at 12903. The rally from 12903 low appears to be unfolding as an impulse where Minute wave ((i)) ended at 13066, Minute wave ((ii)) ended at 12906.5, and Minute wave ((iii)) ended at 13249.5. Near term, while pullbacks stay above 12903 low, expect Index to extend higher. We don’t like selling the Index.
DAX 1 Hour Elliott Wave Analysis
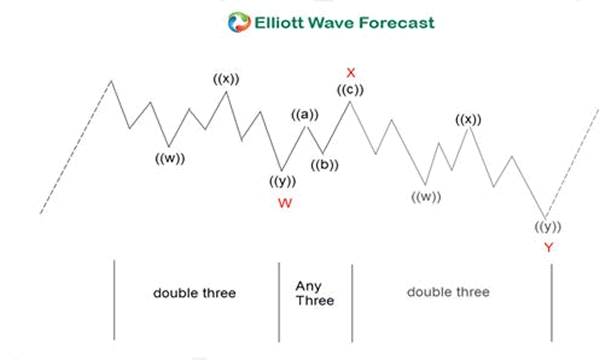
Double three ( 7 swings) is the most important pattern in Elliott wave’s new theory. It is also probably the most common pattern in the market these days. Double three is also known as a 7-swing structure. It is a very reliable pattern that gives traders a good opportunity to trade with a well-defined level of risk and target areas. The image below shows what Elliott Wave Double Three looks like. It has labels (W), (X), (Y) and an internal structure of 3-3-3. This means that all 3 legs has corrective sequences. Each (W) and (Y) is formed by 3 wave oscillations and has a structure of A, B, C or W, X, Y of smaller degrees.