GBP/JPY – 149.35
Although sterling rose to as high as 151.40 last week, the subsequent retreat suggests consolidation below this level would be seen and pullback to 148.50-60 is likely, however, break of support at 147.75-80 is needed to signal the rebound from 146.95 has ended, then another leg of corrective decline from 152.85 top is underway for retracement of recent rise to 146.00, then towards support at 145.25 but near term oversold condition should limit downside to 144.50 and 143.95-00 should remain intact.
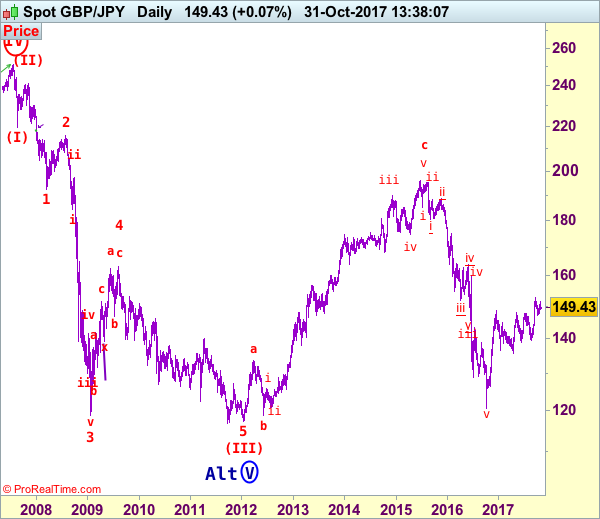
Our preferred count is that larger degree wave V with circle is unfolding from 251.12 with wave (I) 219.34, (II): 241.38 and wave (III) is subdivided into 1: 192.60, 2: 215.89 (23 Jul 2008) and wave 3 ended at 118.87 earlier in 2009. The correction from there to 162.60 is wave 4 which itself is a double three and is labeled as first a-b-c ended at 151.53, followed by wave x at 139.03, 2nd a ended at 162.60, 2nd b at 146.75 and 2nd c leg of wave 4 ended at 163.00. Therefore, the decline from 163.00 to 116.85 is now treated as wave 5 which also marked the end of larger degree wave (III), hence wave (IV) major correction has commenced for retracement of the wave (III) from 241.38 and upside target at 183.95-00 (50% Fibonacci retracement of the wave (II) from 241.38) had been met, a drop below 160.00 would suggest wave (IV) has ended at 195.85, bring decline in wave (V) for initial weakness to 130 (already met) and 120.
On the upside, whilst initial recovery to 150.50-55 cannot be ruled out, said resistance at 151.40 should remain intact and bring further consolidation. A daily close above said resistance at 151.40 would signal the rebound from 146.95 is still in progress and may extend gain to 152.00 but said recent his at 152.85 should remain intact, bring further consolidation. A break of this level would extend recent upmove from 120.50 low (wave v trough) for subsequent gain to 153.50-60, then 154.00-10, however, sharp move beyond 155.00 should not be repeated, risk from there has increased for a correction to take place later.
Recommendation: Stand aside for this week.
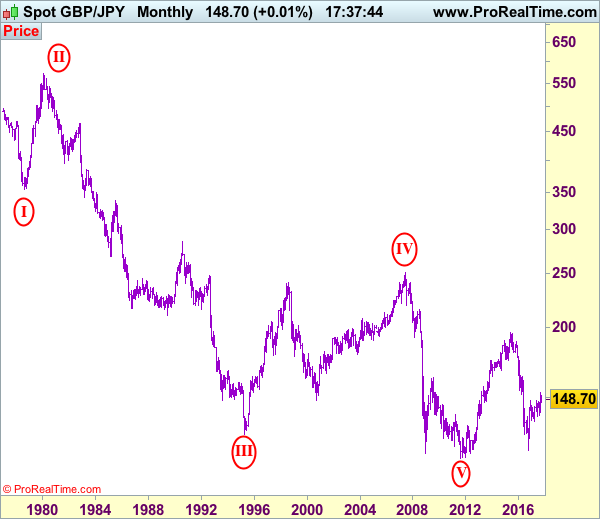
The long-term downtrend from 570.99 (29 Feb 1980) is labeled as an impulsive wave with III with circle ended at 129.77 (20 Apr 1995) and the corrective rebound to 251.12 (20 Jul 2007) is treated as wave IV with circle and the wave V with circle selloff from 251.12 has possibly ended at 116.80 (almost reached our indicated target at 116.00) and major correction has commenced from there and indicated upside target at 183.90-00 (50% Fibonacci retracement of 251.10-116.85) had been met, reckon upside would be limited to 199.80-90 (61.8% Fibonacci retracement) and bring wave (V) decline in later part of 2017.