Sample Category Title
Strategy: All Eyes On The ‘Talking Heads’
Key points
- Global central bankers are busy on the news wires but new research indicates that the accuracy of forecasting financial and macroeconomic variables has not improved.
- Market to focus on what 'QE path' the ECB will choose on 26 October, when it is due to reveal the bulk of its decisions regarding the future of the QE programme.
- It seems that two 'paths' are on the table. Either an extension for six months with EUR40bn a month in purchases or purchases for nine/12 months but only EUR20bn or EUR30bn a month.
- We believe for now in the first 'path' but acknowledge that the purchase constraints that make it more and more difficult for the ECB to buy according to the 'Capital Key' makes a 'longer, but smaller' monthly amount 'path' more likely.
The art of Kremlinology
This week has been full of speeches from global central banks. According to Bloomberg alone, 14 speeches from the ECB and 17 speeches from Fed members were scheduled. On top of this we had FOMC minutes. The reasons are that the important 26 October ECB meeting, where the board has promised to outline the future for the ECB QE programme, is drawing closer; the Fed is widely discussing balance sheet reduction and low inflation versus a low unemployment rate and, not least, that we have the annual IMF meeting in Washington this week.
However, there is still plenty of information for central bank watchers to scrutinise. Central bank watching is sometimes referred to as the new art of 'Kremlinology', a term applied to Western analysts during the cold war who were trying to figure out what was really going on behind closed doors at the Kremlin. Even small changes in wording, the removal of certain people from the public and the way articles were arranged in Pravda were scrutinised. The question is whether these signals were intentional and indeed they were probably often misinterpreted by analysts.
Forecasting capabilities have not improved
The uncertainty is how much value we can actually derive from central bank watching. It has been best practice among central banks for years to provide information about monetary policy in order to increase its effectiveness.
However, what about the art of forecasting financial and macroeconomic variables? In a working paper from the Swiss National Bank (SNB), the authors Thomas Lustenberger and Enzo Rossi argue, based on a large sample of data, that increased central bank communication does not improve the accuracy of private forecasts. Furthermore, they argue that more frequent communication increases both forecast errors and their dispersion. So, perhaps 'speech is silver, silence is golden' when it comes to forecasting on the back of central bank speeches.
But we still keep an eye on ECB and Fed speeches
With these academic findings in mind, we should probably end this document here. However, we stick to our Kremlinology business and give our interpretation of the latest communication from the ECB and the Fed.
If we start with the ECB, it seems that at the forefront of the discussion is not so much whether the QE programme should be extended into 2018 but rather what the ECB thinks is the most appropriate way to move forward when the Governing Council makes the bulk of its decisions regarding the future of the QE programme at its 26 October meeting. In the minutes from the 6-7 September ECB meeting, the ECB said 'within the framework of the Governing Council's forward guidance, the benefits from a longer intended purchase horizon, combined with a greater reduction in the pace, were compared with those from a shorter period of purchases and larger monthly volumes'.
It appears there are two options now on the table: either an extension for six months, with EUR40bn a month in purchases or purchases for nine/12 months but at only EUR20bn or EUR30bn a month. It is also noteworthy that the ECB minutes state that 'the monetary policy stance would remain highly accommodative in either scenario on account of the range of policy instruments in place, most notably the reinvestment of the principal of maturing securities, the liquidity related to the targeted longer term refinancing operations, and the forward guidance on the ECB's key policy rates'.
In particular, the discussion regarding the reinvestment flows, which could be as high as EUR15-20bn a month in 2018, is attracting increasingly more attention. It is likely the reinvestment flows will be an important part of the exit discussion that the ECB will, in our view, try to sell as a very 'soft exit'.
We plan to publish an in-depth ECB preview ahead of the 26 October meeting but for now we stick with the view that the ECB will announce a six-month extension with a monthly pace of EUR40bn. We expect a 'small' three-month EUR20bn extension after that. That said, the purchase constraints that make it more and more difficult for the ECB to buy according to the 'Capital Key' in the low-debt countries make a 'more months but smaller monthly amount path' more likely.
Fed: on track for a December hike
In respect to the Fed, it also released minutes this week. Here, we already know the different positions among the FOMC members. The most dovish FOMC members (Lael Brainard, Charles L. Evans and Neel Kashkari) argued that the Fed should not hike further this year, as low inflation may not be just transitory due to low inflation expectations and labour market slack. The core FOMC members on the other hand think it is appropriate to tighten monetary policy further, as above-trend growth tightens the labour market further, which eventually leads to higher wage growth and hence higher inflation; in other words, they still have a strong belief in the Phillips curve. In our view, they are likely to feel relieved about the latest average hourly earnings figures, which came out much higher than expected in September.
All in all, it remains our base case that the Fed will hike in December, as the core voting FOMC members put more weight on labour market data than current inflation data, although we agree with the dovish camp that low inflation may not be temporary due to low inflation expectations. For more, see FOMC minutes: Core members still want to hike in December, 11 October.
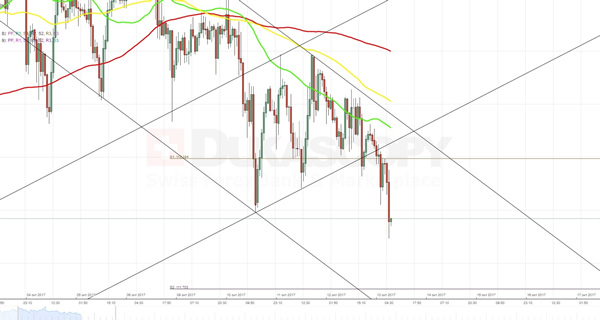
Technical Outlook: USDJPY – 200SMA Under Increased Pressure
The USDJPY pair is attempting to break below narrowing range of past couple of days and probed below initial support at 112.00 for the first time since 26 Sep. Recent several attempts lower failed to break lower, but near-term action remains in red and holding at the edge, ahead of key support at 111.80 (200SMA). Sustained break here is needed for bears to take control and signal reversal after repeated upside failures above 113.00. Break below 200SMA would expose supports at 111.40 (30SMA) and 111.10 (100SMA/Fibo 38.2% of 107.31/113.43) which marks next trigger. Daily indicators are heading south with 14d momentum holding at the midline and showing scope for probe into negative territory which is supportive for further downside. Also, reversal pattern is forming on weekly chart and supports the notion. At the upside, 20SMA (112.35) marks initial resistance, followed by 10SMA (112.47) which is expected to cap upside attempts. Return above daily Tenkan-sen (112.64) and psychological 113.00 barrier would neutralize bearish threats and shift near-term bias higher. US data today would give more clues about near-term direction.
Res: 112.35, 112.47, 112.64, 113.00
Sup: 111.80, 111.40, 111.10, 110.70
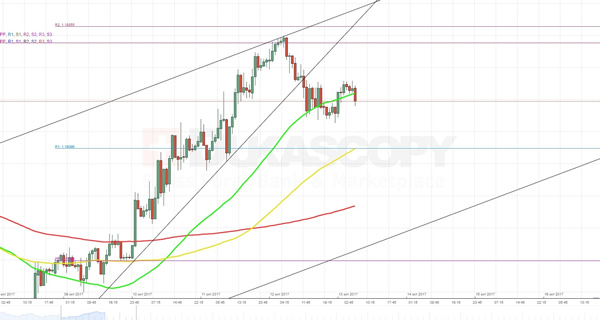
EURUSD Analysis: Breaks From Rising Wedge
After surging in a minor rising wedge pattern, the rate made a breakout near the monthly PP 1.1875. The turnaround was additionally supported by decreasing number of unemployment claims and release of better than expected US Core PPI. Despite this favourable fundamental background the pair failed to break below the 1.1830 mark due to support set up by the 55-hour SMA. Moreover, an area near the 1.1810 level is additionally secured by the weekly R1 and the 100-hour SMA. From this perspective, the pair is not expected to slip to the bottom in the first half of the day. There are similar expectations for the northern side, which is obstructed by the above monthly PP. Therefore, further direction of the rate will heavily depend on release of information on the US inflation and retail sales.
GBPUSD Analysis: Approaches 1.33
The British Pound had a very challenging trading session yesterday. Due to comments made by the EU Chief Negotiator Michel Barnier about a "deadlock" in Brexit negotiations the Sterling lost 116 basis points against the Greenback just in couple of hours. Despite a release of better than expected US Core PPI data, traders managed to return the pair to the pre-fall 1.3250 level. In the first half of this trading session the currency rate is expected to test a resistance near the 1.3290 mark. However, whether the cable will manage to soar and bypass the 1.3300 level or fall back to the 200-hour SMA near 1.3192 will depend on release of data about the US CPI and retail sales, which, in turn, will have major implications on decision about the need of another interest rate hike this year.
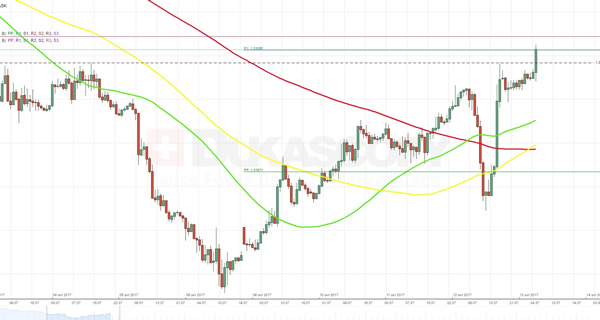
USDJPY Analysis: Moves Below 112.20
In line with expectations, the currency pair one more time failed to break through a combined resistance formed by the 55-, 100- and 200-hour SMAs that were slipping along the upper boundary of a recently formed descending channel. The fall of the rate was additionally supported by reports of another underground quake near North Korea’s nuclear test base. From technical perspective, the exchange rate is expected to continue to move to the south trying to reach an intersection of the bottom boundary of the pattern and the weekly S2 at 111.70. However, there is a need to take into account a release of information about the US inflation and retail sales later this day whose combined effect most probably is going to push the pair out of the channel.
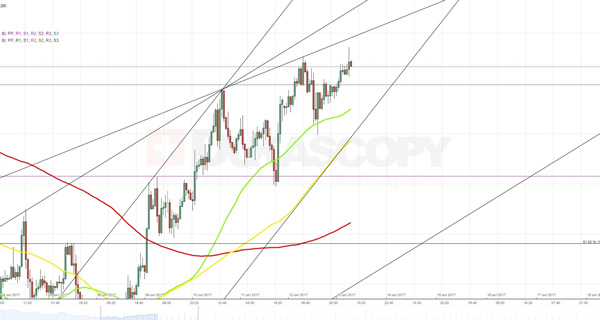
XAUUSD Analysis: Fails To Slip Below 1,285.75
Although the Bureau of Labour Statistics released a better than expected US Core PPI, the buck did not manage to make any significant advances against the yellow metal yesterday. The reason for that was a combined support set up by the 55-hour SMA in conjunction with the bottom trend-line of a rising wedge. Accordingly, today the pair is expected to make a breakout from this pattern. The fact that the northern side near the 1,295.00 level is secured by the 55-day SMA indicates on breakout to the bottom. Moreover, this direction is line with trade patterns theory. However, there is need to take into account traders’ reaction on release the US inflation and retail sales data, which might lead to active sell off of the Greenback.
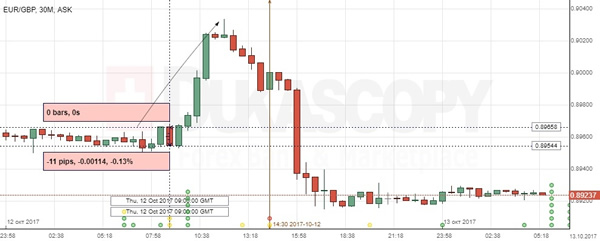
EUR/GBP: EU Industrial Production
The EUR/GBP exchange rate decreased on the report showing stronger-than-expected growth in the EU industrial production. The Euro lost against the British Pound 11 base points, but then jumped to be seen trading above the 0.9000 mark. After the ECB President Mario Draghi delivered his speech, the pair fell and continued consolidation nearing the 0.8920 level.
The Eurostat reported that the growth of industrial production in the Euro area expanded to the nine-month high over the course of August, revealing a 1.4% climb versus 0.5% expected. The improvement in the EU industrial output pointed to the sector's strong growth in the Q3, which is likely to support healthy economic recovery.
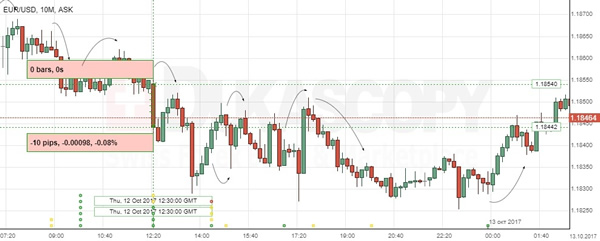
EUR/USD: US Producer Prices Index
The Euro fell slightly against its American counterpart, reflecting an anticipated increase in the US producer prices. The EUR/USD exchange rate edged 10 base points lower to the 1.1844 mark to continue temporary depreciation, though the pair passed across the 1.1850 area again on Friday morning.
The Labour Department revealed that the US Producer Price Index climbed 0.4% in September. Data suggested the growth fuelled by higher gasoline prices, as they marked the strongest rise in two years due to production disruptions in Texas oil refineries caused by Hurricane Harvey. Moreover, the gain is set to bolster the Fed's case for the next rate hike this year despite sluggish inflation readings.
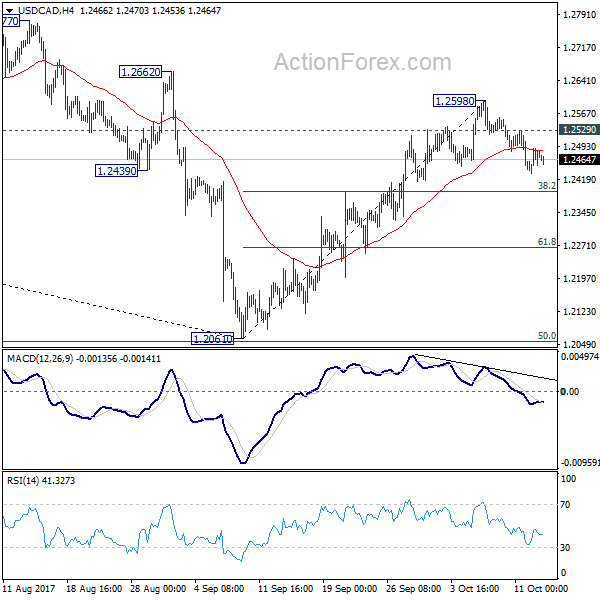
USD/CAD Daily Outlook
Daily Pivots: (S1) 1.2440; (P) 1.2465; (R1) 1.2498; More....
At this point, pull back from 1.2598 short term top is expected to extend lower to 38.2% retracement of 1.2061 to 1.2598 at 1.2393, or even further to 61.8% retracement at 1.2266. But we'll look for bottoming sign below 1.2266. On the upside, break of 1.2529 minor resistance will resume the rise from 1.2061 for 1.2777 resistance.
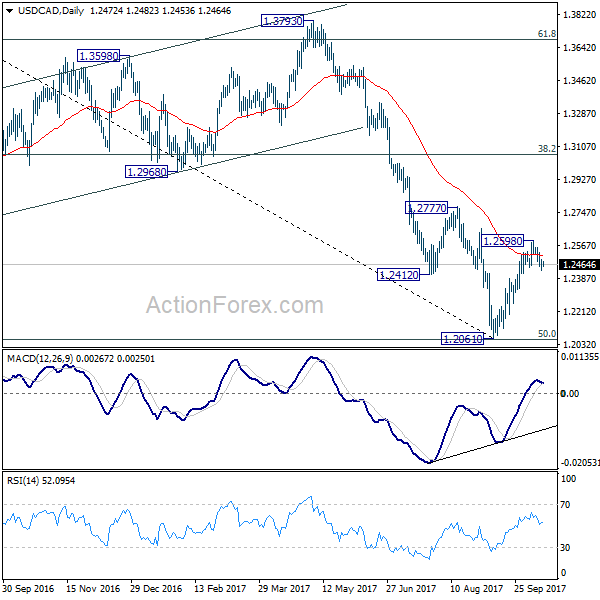
In the bigger picture, USD/CAD should have defended 50% retracement of 0.9406 (2011 low) to 1.4869 (2016 high) at 1.2048. And with 1.2048 intact, we'd favor the case that fall from 1.4689 is a correction. Break of 1.2777 will further affirm this bullish case. That is, larger up trend from 0.9406 is not completed. And in that case, USD/CAD should target 1.3793 resistance next. However, on the other hand, firm break of 1.2048 will indicate that fall from 1.4689 is at least a medium term down trend and should target 61.8% retracement at 1.1424 and below.
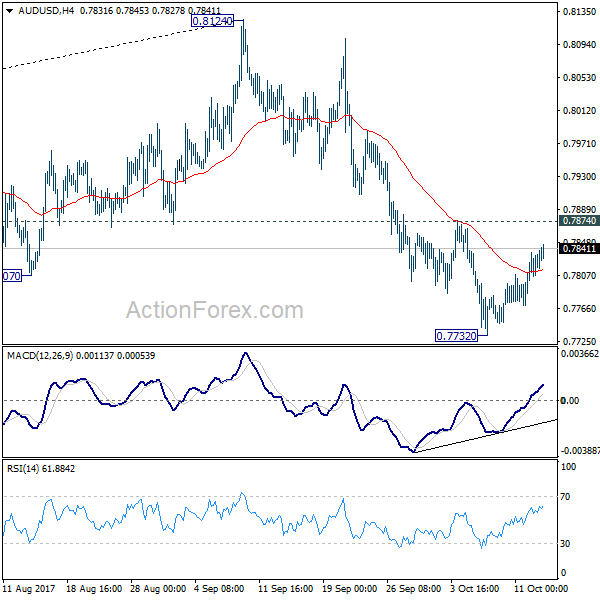
AUD/USD Daily Outlook
Daily Pivots: (S1) 0.7792; (P) 0.7813; (R1) 0.7843; More...
Intraday bias in AUD/USD remains neutral for consolidation above 0.7732 temporary low. Another fall is expected as long as 0.7874 resistance holds. As noted before, rise from 0.7382 is possibly completed at 0.8124 already. Below 0.7732 will target medium term fibonacci level at 0.7628 first. Decisive break there will target 0.7328 key cluster support. On the upside, break of 0.7874 will argue that the decline is completed and turn bias back to the upside.
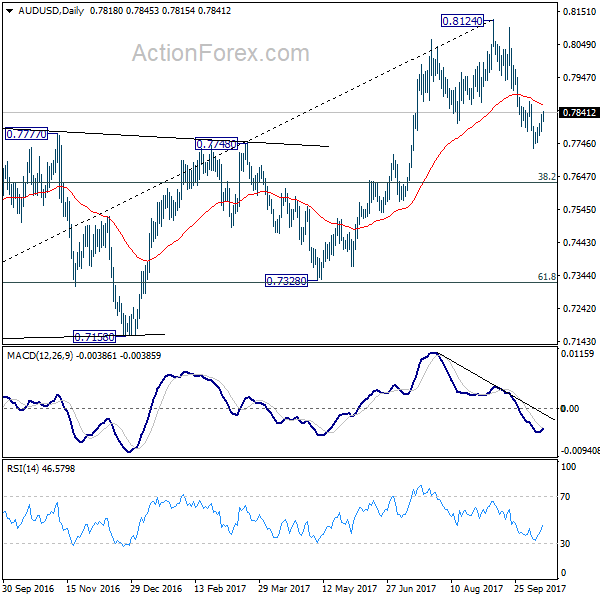
In the bigger picture, rise from 0.6826 medium term bottom is seen as corrective pattern. Current development suggests that it might be completed with three waves up to 0.8124 already. Break of 38.2% retracement of 0.6826 to 0.8124 at 0.7628 will firm this bearish case. And, decisive break of 0.7328 key cluster support (61.8% retracement at 0.7322) will confirm and bring retest of 0.6826 low. In case rise from 0.6826 resumes and extends, strong resistance should be seen at 38.2% retracement of 1.1079 to 0.6826 at 0.8451 to limit upside.