Sample Category Title
EUR/USD Daily Outlook
Daily Pivots: (S1) 1.1811; (P) 1.1845 (R1) 1.1864; More...
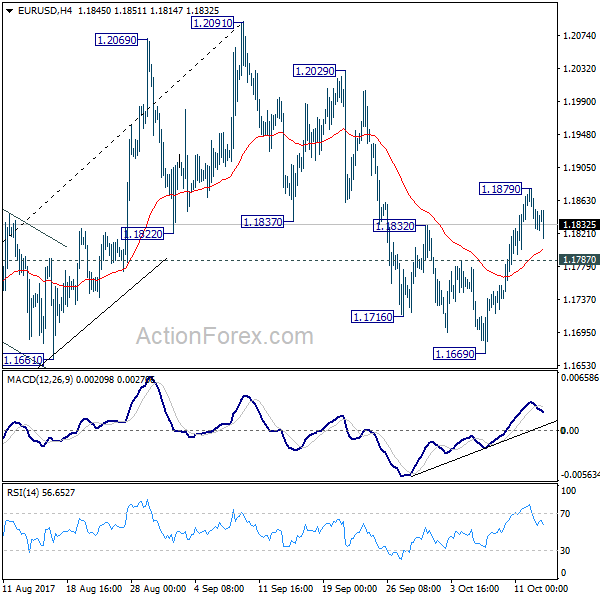
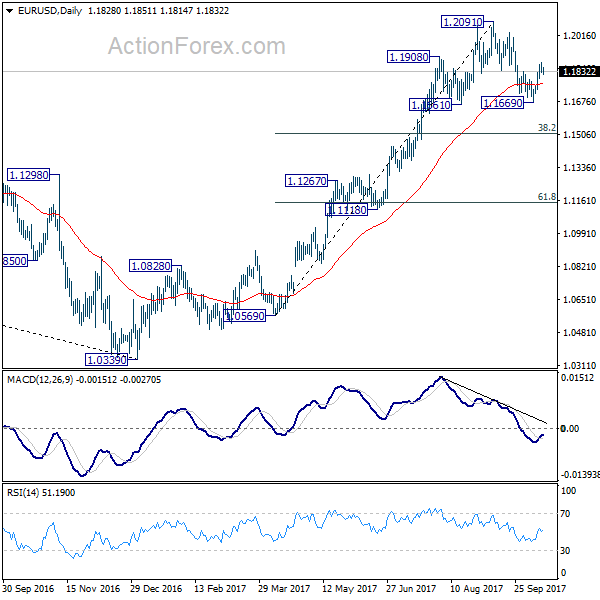
A temporary top is in place at 1.1879 in EUR/USD and intraday bias is turned neutral first. Another rally is mildly in favor as long as 1.1787 minor support holds. As noted before, pull back from 1.2091 should have completed at 1.1669, ahead of 1.1661 support. Above 1.1879 will target a test on 1.2091 high. Nonetheless, break of 1.1787 will likely extend the corrective fall from 1.2091 through 1.1669 instead.
In the bigger picture, rise from medium term bottom at 1.0339 is not finished yet. It's expected to continue after pull back from 1.2091 completes. And, next target will be 38.2% retracement of 1.6039 (2008 high) to 1.0339 (2017 low) at 1.2516. However, it should be noted that there is no confirmation of trend reversal yet. That is, such rebound from 1.0399 could be a correction. And the long term fall from 1.6039 (2008 high) could resume. Hence, we'd be cautious on strong resistance from 1.2516 to limit upside.
EUR/JPY Elliott Wave Analysis
EUR/JPY - 132.75
The single currency rebounded after holding above indicated support at 131.75, however, euro met resistance at 133.50 and has retreated again, suggesting further sideways consolidation would take place, however, as long as said support at 131.75 holds, bullishness remains for another rebound to 133.50, then towards 134.00 but break of recent high of 134.41 is needed to confirm upmove has resumed and extend further gain to 135.00 but loss of upward momentum should prevent sharp move beyond 136.00-10 and reckon 136.95-00 would hold, price should falter well below 138.45-50 (1.618 times extension of 109.49-124.10 measuring from 114.85).
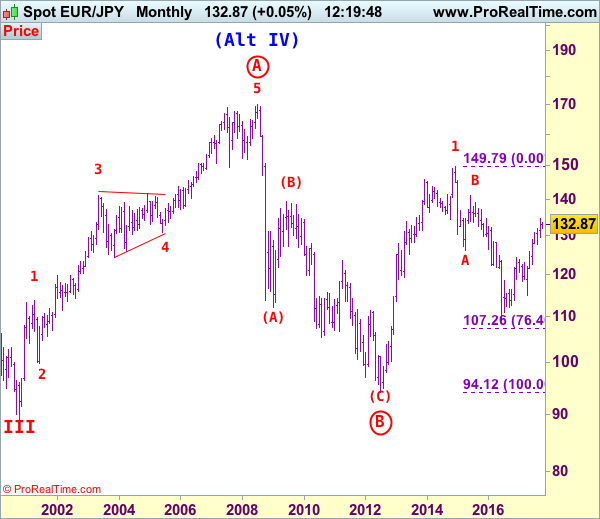
The daily chart is labeled as attached, early selloff from 169.97 (July 2008) to 112.08 is wave (A) of B instead of end of entire wave B and then the rebound from there to 139.26 is wave (B), hence, wave (C) has possibly ended at 94.12 with a diagonal triangle as labeled in the daily chart, hence upside bias is seen for further gain. Recent rally above indicated retracement level at 116.69 (50% Fibonacci retracement of the intermediate fall from 139.26-94.12) adds credence to this view and signal major reversal has commenced but first leg of this wave C has possibly ended at 149.79, hence wave 2 has commenced with wave A ended at 126.09, followed by wave B at 141.06, wave C commenced and could have ended at 109.49, indicated upside targets at 126.00 and 130.00 had been met and further gain to 135.00 would follow.
On the downside, whilst initial pullback to 132.20-25 cannot be ruled out, still reckon said support at 131.75 would hold and bring another rebound. Only a break below this level would signal a temporary top is formed, bring retracement of recent rise to 131.00 and possibly test of support at 130.62 but downside should be limited to 130.00 and strong support at 129.37 should remain intact, bring another upmove later.
Recommendation: Hold long entered at 132.70 for 135.00 with stop below 131.70.
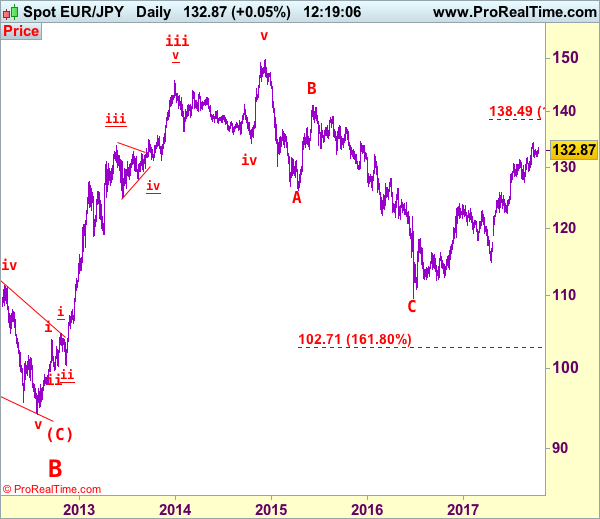
To re-cap the corrective upmove from the record low of 88.93 (18 Oct 2000), the wave A from there is subdivided as: 1:88.93-113.72, 2:99.88 (1 Jun 2001), 3:140.91 (30 May 2003), 4:124.17 (10 Nov 2003) and 5 ended at record high of 169.97 (21 Jul 2008). The brief but sharp selloff to 112.08 is viewed as a-b-c x a-b-c wave (A) of B. The subsequent rebound to 139.26 is (B) of B and (C) of (B) has possibly ended at 94.12 and in any case price should stay well above previous chart support at 88.93, bring rally in larger degree wave C towards 150.00.
GBP/USD Daily Outlook
Daily Pivots: (S1) 1.3160; (P) 1.3225; (R1) 1.3329; More....
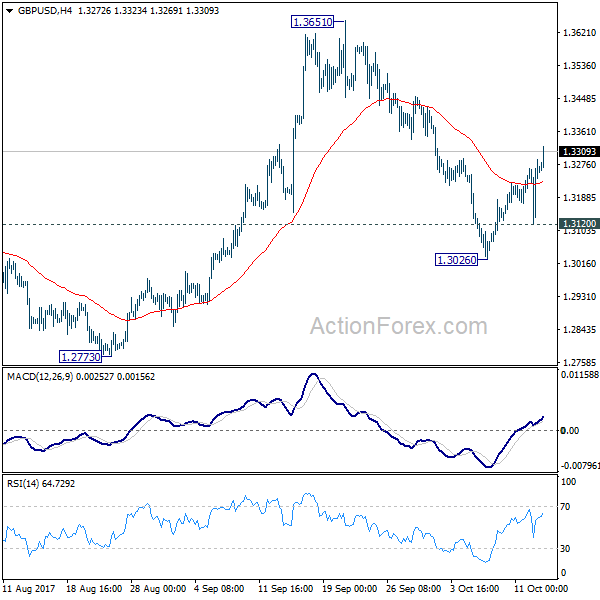
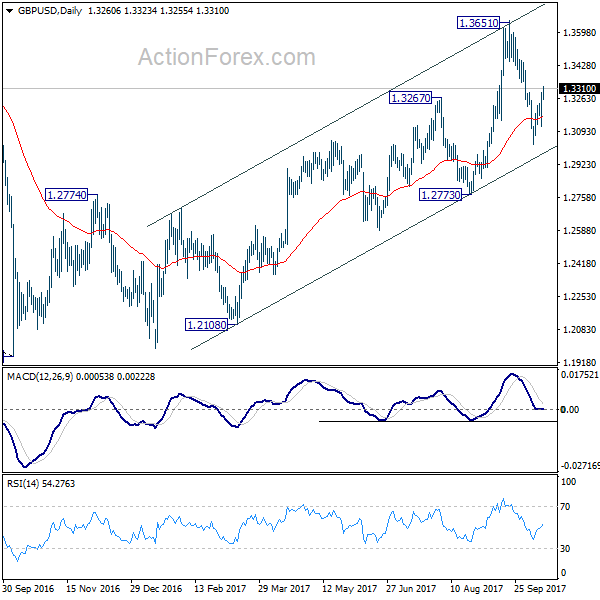
GBP/USD's rebound from 1.3026 extends to as high as 1.3323 so far. The break of 1.3291 resistance argues that pull back from 1.3651 is completed at 1.3026. Intraday bias is turned back to the upside for retesting 1.3651 high. Decisive break there will resume whole medium term rally from 1.1946 and target 1.3835 key resistance next. On the downside, below 1.3120 minor support will resume the fall from 1.3651 through 1.3026 instead.
In the bigger picture, while the medium term rebound from 1.1946 was strong, GBP/USD hit strong resistance from the long term falling trend line. Outlook is turned a bit mixed and we'll turn neutral first. On the downside, decisive break of 1.2773 key support will argue that rebound from 1.1946 has completed. The corrective structure of rise from 1.1946 to 1.3651 will in turn suggest that long term down trend is now completed. Break of 1.1946 low should then be seen. On the upside, break of 1.3835 support turned resistance will revive the case of trend reversal and target 38.2% retracement of 2.1161 (2007 high) to 1.1946 (2016 low) at 1.5466 .
USD/CHF Elliott Wave Analysis
USD/CHF – 0.9751
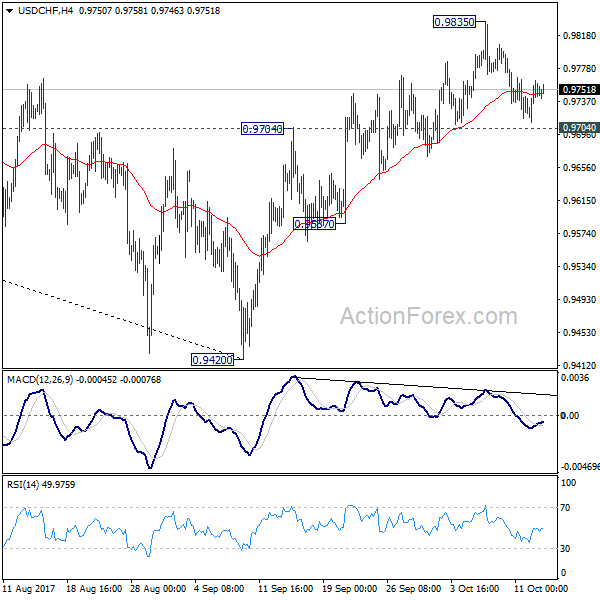
As the greenback has retreated after rising to 0.9837 late last week, suggesting consolidation below this level would be seen and pullback to 0.9700, then 0.9640-45 cannot be ruled out, however, as temporary low has been formed earlier at 0.9421, reckon downside would be limited to support at 0.9565 and bring another rebound later. Above 0.9800 would signal the pullback from 0.9837 has ended, bring retest of this level, then test of previous support at 0.9859, having said that, overbought condition should limit upside to 0.9900 and price should falter well below psychological resistance at 1.0000, bring another decline later.
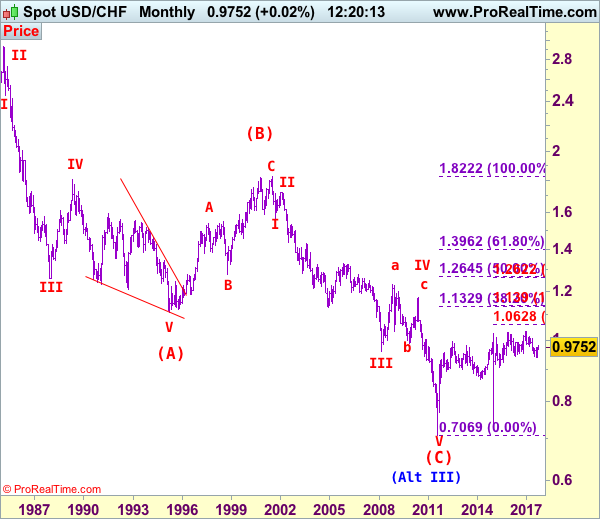
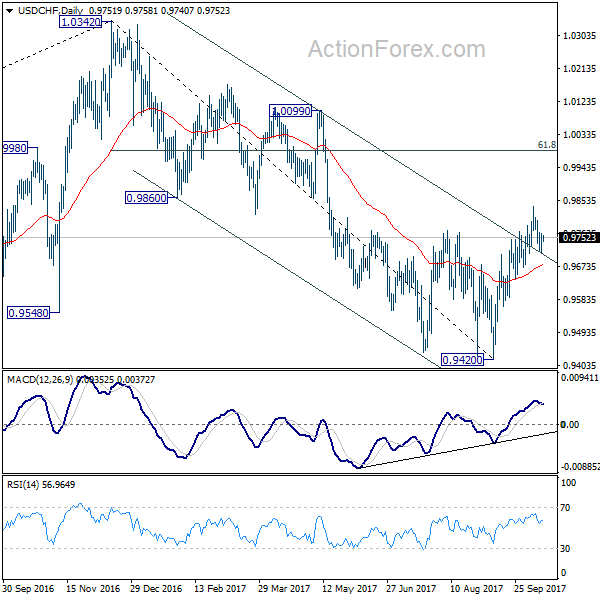
Our preferred count on the daily chart is that early selloff to 0.9630 is an end of the larger degree wave III and major correction is unfolding from there with a leg ended at 1.2298 (Nov 2008 with (a): 1.0625, (b):1.0011 and (c):1.2298), wave b ended at 0.9910 with (a): 1.0370, (b): 1.1967, (c): 0.9910. The rise from there to 1.1730 is the wave c which also marked the end of wave IV and wave V has possibly ended at 0.7068.
On the downside, whilst initial pullback to 0.9700 and 0.9645-50 is likely, reckon downside would be limited to said support at 0.9565 and bring another rise later. Below 0.9525-30 would risk weakness to 0.9490-00 but still reckon downside would be limited to 0.9455-60 and said support at 0.9421 should remain intact, bring another rebound later. A drop below said support at 0.9421 would extend recent decline from 1.0344 top (formed back in late 2016) to 0.9350 and possibly 0.9300, however, loss of downward momentum should prevent sharp fall below 0.9250-60 and 0.9200-10 should hold.
Recommendation: Buy at 0.9575 for 0.9775 with stop below 0.9475.
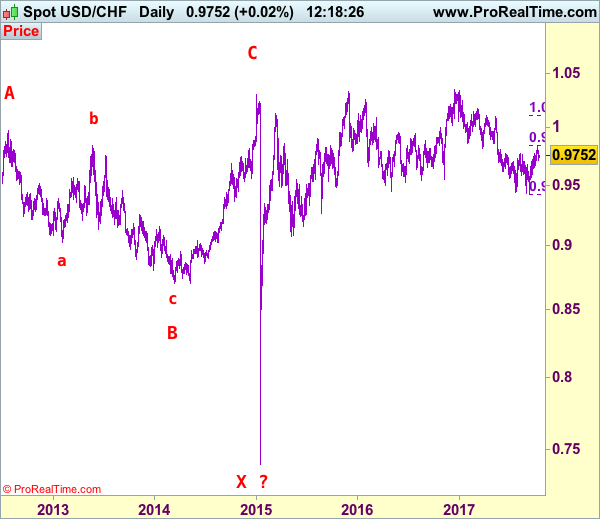
Dollar's long-term downtrend started from 2.9343 (Feb 1995) and it was unfolding as a (A)-(B)-(C) with (A): 1.1100, (B): 1.8310 (26 Oct 2000), then followed by another impulsive wave (C) with wave III ended at 0.9630 (Mar 2008). Under this count, correction in wave IV has possibly ended at 1.1730 and wave V already broke below support at 0.9630 and met indicated downside target at 0.7500 and 0.7400. The reversal from 0.7068 suggests the wave V has possibly ended and the breach of resistance at 0.9595 add credence to this view and indicated upside target at 1.0000 had been met, however, the sharp retreat from 1.0296 to 0.7401 suggests choppy trading would be seen but price should stay above said record low at 0.7068.
Trade Idea: GBP/USD – Hold short entered at 1.3315
GBP/USD – 1.3313
Original strategy :
Sold at 1.3315, Target:1.3115, Stop: 1.3375
Position: - Short at 1.3315
Target: - 1.3115
Stop: - 1.3375
New strategy :
Hold short entered at 1.3315, Target:1.3115, Stop: 1.3375
Position: - Short at 1.3315
Target: - 1.3115
Stop:- 1.3375
As cable found decent demand at 1.3121 yesterday and staged a strong rebound, suggesting near term upside risk remains and marginal gain from here cannot be ruled out, however, as this move from 1.3027 low is still viewed as retracement of recent decline, reckon upside would be limited to previous support at 1.3343 and bring retreat later, below 1.3245 would bring weakness to 1.3195-00 but only break of said support at 1.3121 would signal the rebound from 1.3027 has ended, bring weakness to 1.3065-75, then retest of said support at 1.3027.
In view of this, we are holding on to our short position entered at 1.3315. Above previous support at 1.3343 would abort and signal low has been formed instead, bring at least a correction of the fall from 1.3658 top to 1.3390-00 later. Our preferred count is that (pls see the attached chart) the wave IV is unfolding as a complex double three (ABC-X-ABC) correction with 2nd wave B ended at 1.2774, hence 2nd wave C could have ended at 1.3658.
Our preferred count on the daily chart is that cable's rebound from 1.3500 (wave (A) trough) is unfolding as a wave (B) with A ended at 1.7043, followed by triangle wave B and wave C as well as wave (B) has ended at 1.7192, the subsequent selloff is the larger degree wave (C) which is still unfolding with minor wave (III) of larger degree wave 3 ended at 1.1986, hence wave (IV) correction is in progress which could either be a triangle wave (IV) of a complex formation but upside should be limited to 1.3500 and price should falter well below 1.4000, bring another decline in wave (V) of 3 for weakness to 1.1500, then 1.1200.
USD/CHF Daily Outlook
Daily Pivots: (S1) 0.9722; (P) 0.9742; (R1) 0.9774; More....
Intraday bias in USD/CHF remains neutral at this point. Considering bearish divergence condition in 4 hour MACD, break of 0.9704 resistance turned support will argue that rebound from 0.9420 has completed. This will also mixed up the near term outlook and turn bias back to the downside for 0.9587 support. Meanwhile, break of 0.9835 temporary top will extend the rebound to 61.8% retracement of 1.0342 to 0.9420 at 0.9990.
In the bigger picture, current development suggests that USD/CHF has defended 0.9443 (2016 low) key support level again. Rise from 0.9420 could develop into a medium term move and target a test on 1.0342 high. This represents the upper end of a long term range that started back in 2015. On the downside, break of 0.9587 support is now needed to indicate completion of the rise from 0.9420. Otherwise, further rally will remain in favor in medium term.
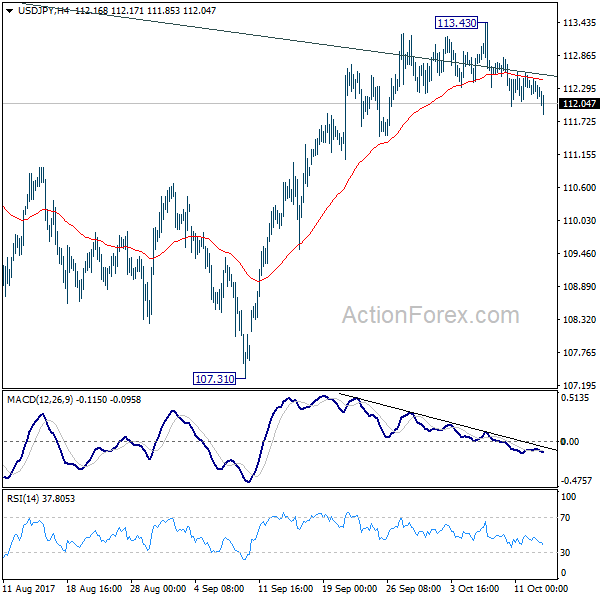
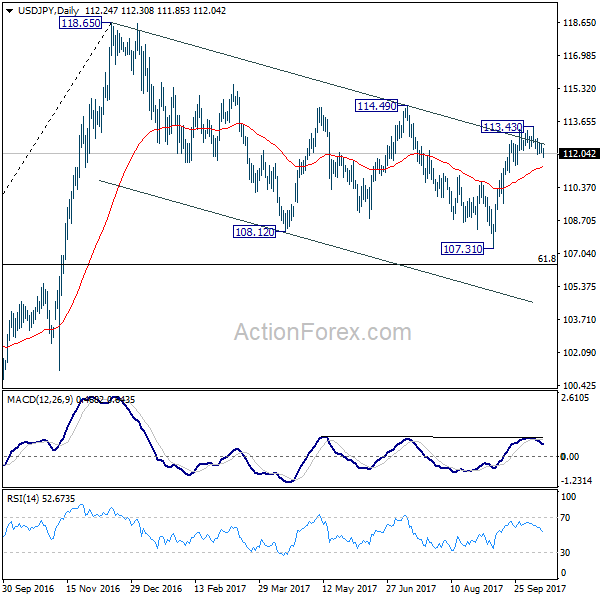
USD/JPY Daily Outlook
Daily Pivots: (S1) 112.10; (P) 112.31; (R1) 112.49; More...
Intraday bias in USD/JPY remains the downside for the moment. Decline from 113.43 short term top should extend to 55 day EMA (now at 111.35) first. Sustained break there will bring retest of 107.31. For now, risk will stays on the downside as long as 113.43 resistance holds.
In the bigger picture, rise from 98.97 (2016 low) is seen as the second leg of the corrective pattern from 125.85 (2015 high). It's unclear whether this this second leg has completed at 118.65 or not. But medium term outlook will be mildly bearish as long as 114.49 resistance holds. And, there is prospect of breaking 98.97 ahead. Meanwhile, break of 114.49 will bring retest of 125.85 high. But even in that case, we don't expect a break there on first attempt.
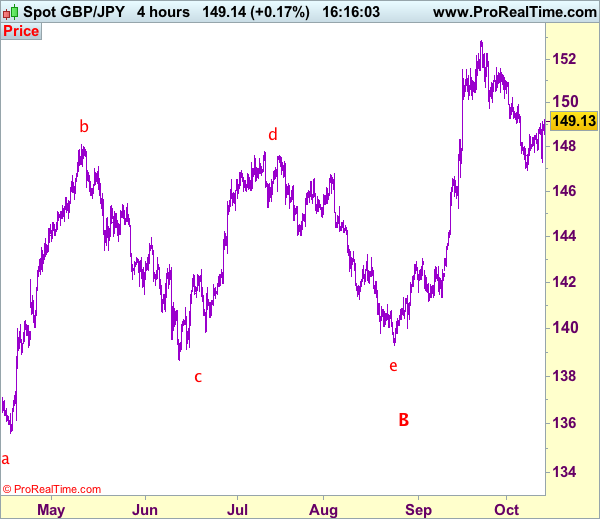
Trade Idea: GBP/JPY – Stand aside
GBP/JPY - 149.15
New strategy :
Stand aside
Position: -
Target: -
Stop:-
Despite yesterday’s brief drop to 147.30, lack of follow through selling and the subsequent strong rebound suggest further choppy trading above 146.95 support would be seen and upside risk remains for the rebound from 146.95 to bring retracement of the fall from 152.85 to 149.90-00 and possibly test of resistance at 150.25 but still reckon upside would be limited to 150.90-00 and bring another decline next week.
On the downside, expect pullback to be limited to 148.50-55 and bring another rebound. Below 147.95-00 would suggest top is possibly formed, bring weakness towards said support at 147.30 but break there is needed to revive bearishness and bring retest of 146.95. Looking ahead, once this level is penetrated, this would confirm the fall from 152.85 top has resumed for retracement of recent upmove to 146.60-65 and then 146.00, having said that, loss of momentum should limit downside and previous support at 145.25 should remain intact.
Our preferred count is that larger degree wave V with circle is unfolding from 251.12 with wave (I) 219.34, (II): 241.38 and wave (III) is subdivided into 1: 192.60, 2: 215.89 (23 Jul 2008) and wave 3 ended at 118.87 earlier in 2009. The correction from there to 162.60 is wave 4 which itself is a double three and is labeled as first a-b-c ended at 151.53, followed by wave x at 139.03, 2nd a ended at 162.60, 2nd b at 146.75 and 2nd c leg of wave 4 ended at 163.00. Therefore, the decline from 163.00 to 116.85 is now treated as wave 5 which also marked the end of larger degree wave (III), hence wave (IV) major correction has commenced for retracement of the wave (III) from 241.38 and upside target at 183.95-00 (50% Fibonacci retracement of the wave (II) from 241.38) had been met, a drop below 160.00 would suggest wave (IV) has ended at 195.85, bring decline in wave (V) for initial weakness to 130 (already met) and 120.
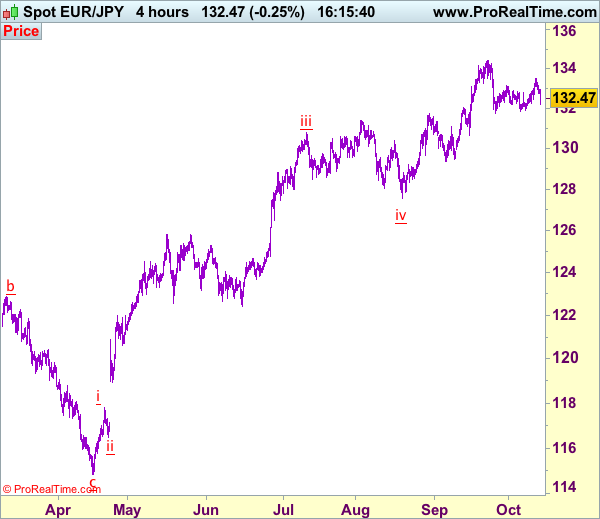
Trade Idea: EUR/JPY – Sell at 132.95
EUR/JPY - 132.55
New strategy :
Sell at 132.95, Target: 130.95, Stop: 133.55
Position: -
Target: -
Stop:-
Although the single currency rose to 133.50 earlier this week, as euro met renewed selling interest there and has retreated, suggesting further consolidation would be seen with mild downside bias for weakness to 132.00 but break of indicated support at 131.75 is needed to retain bearishness and signal another leg of corrective decline from 134.41 top is underway for weakness to 131.35-40, then 131.00 but support at 130.62 should remain intact.
In view of this, we are looking to reinstate short on recovery as 132.95-00 should limit upside. Above said resistance at 133.50 would abort and risk further gain towards 134.00 but only break there would signal the correction from 134.41 has ended at 131.75, bring retest of this recent high. Once this level is penetrated, this would confirm recent uptrend has resumed and extend headway to 135.00-10 and later 135.50-60.
Our latest preferred count is that wave (ii) is ABC-X-ABC which ended at 123.33 and wave (iii) is unfolding with wave iii ended at 100.77, followed by wave iv at 111.57 and wave v as well as the wave (iii) has ended at 97.04, followed by wave (iv) at 111.43 and wave (v) has ended at 94.12 which is also the end of the larger degree v, this also implied the major wave (C) has also ended there, hence major correction has commenced from there with (A) leg unfolding in its lower degree wave c which has possibly ended at 145.69. Under this count, A-B-C wave (B) has commenced with A leg ended at 136.23, wave B at 143.79 and wave C has possibly ended at 149.79.
Our larger degree count is that the decline from 139.26 is wave (C) and is sub-divided into a diagonal triangle i-ii-iii-iv-v with wave i - 105.44, wave ii- 123.33, wave iii - 97.03, wave iv - 111.43, followed by the final wave v as well as the end of wave (C) at 94.12, this also mark the bottom of larger degree wave B. Under this count, major rise in wave C has commenced as an impulsive wave with minor wave III ended at 145.69, wave V is still in progress for further gain to 150.00. Having said that, this so-called wave V could well be the first leg of larger degree 5-waver wave C and this wave C should bring at least a retest of wave A top at 169.97 (July 2008).
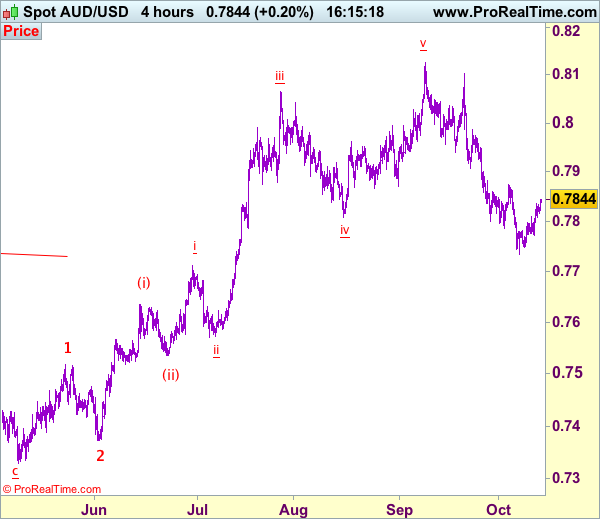
Trade Idea: AUD/USD – Sell at 0.7875
AUD/USD – 0.7844
Original strategy:
Sell at 0.7875, Target: 0.7700, Stop: 0.7935
Position: -
Target: -
Stop:-
New strategy :
Sell at 0.7875, Target: 0.7700, Stop: 0.7935
Position: -
Target: -
Stop:-
Although aussie has continued edging higher and gain to 0.7875 resistance cannot be ruled out, as this move from 0.7733 temporary low is viewed as retracement of recent decline, reckon upside would be limited and bring retreat later, below 0.7800 would bring test of 0.7770-75, break there would signal top is formed, then retest of said support at 0.7733 would follow, below there would add credence to our view that the fall from 0.8125 top is still in progress for weakness to 0.7700-10 but loss of near term downward momentum should prevent sharp fall below 0.7660-65 and reckon 0.7600-10 would hold from here.
In view of this, we are looking to sell aussie again on further recovery as said resistance at 0.7875 should limit upside and bring another decline. Above previous support at 0.7908 (now resistance) would defer and risk a stronger rebound to 0.7950 but resistance at 0.7986 should remain intact and bring another decline later.
On the 4-hour chart, recent upmove from 0.7329 is unfolding as an impulsive rise with wave 3 as well as smaller degree wave (iii) extending, only minor wave v of (iii) has ended at 0.8125, hence bullishness remains for this move to extend headway to 0.8200, then towards 0.8300, however, reckon upside would be limited to 0.8400 and the final wave 5 should falter below 0.8500, bring correction later.