Sample Category Title
Technical Outlook: GBPUSD – Bulls Regain Control After Thursday’s Roller-Coaster
Cable regained strength and rallied above 1.3300 barrier on Friday after being shaken by comments about Brexit process. The pair returned to its larger uptrend after ending Thursday's roller-coaster action when it slumped from 1.3262 to 1.3121 and recovered all losses on subsequent swift bounce. Sustained break above 1.3266 (Fibo 38.2% of 1.3655/1.3026 downleg) which limited upside attempts on Thursday, was bullish signal for extension towards next pivot at 1.3340 (20SMA/Kijun-sen/50% retracement). Sustained break here is needed to signal bullish continuation towards 1.3415 (Fibo 61.8% of 1.3655/1.3026). However, the upside action could be limited here as slow stochastic is overbought on daily chart. Broken 30SMA marks initial support at 1.3289, followed by broken Fibo 38.2% at 1.3266. Lower pivot lies at 1.3207 (10SMA) close below which will be bearish. No economic releases from UK are scheduled today and US data will be in focus.
Res: 1.3340, 1.3415, 1.3455, 1.3473
Sup: 1.3289, 1.3266, 1.3208, 1.3175
Technical Outlook: EURUSD Eases After Upside Rejection, Eyes US Data For Fresh Signal
The Euro is holding in red in early Friday's trading, following upside rejection at Kijun-sen barrier (1.1880) on Thursday.
Action in Asia was capped at 1.1850 and fresh weakness in early European trading is testing initial support at 1.1820 (20SMA/hourly cloud base).
Negative signal is generating on reversal of slow stochastic from overbought zone on daily chart.
Bears could extend further on profit-taking from strong rally in past five days and challenge next pivotal support at 1.1774 (daily Tenkan-sen/10SMA).
Break and close below the latter would signal lower top and expose key supports at 1.1702 (daily cloud base) and 1.1669 (06 Oct low).
Alternatively, sustained break above the upper pivots at 1.1880 (Kijun-sen) and 1.1906 (daily cloud top) will be bullish.
US CPI and Retail Sales data are in focus today for fresh signals.
Res: 1.1850, 1.1880, 1.1906, 1.1930
Sup: 1.1815, 1.1795, 1.1774, 1.1749
USDCAD Turns Neutral, Big Picture Remains Bearish
USDCAD is fading the recent rally from the 1.2061 low and is entering a consolidation phase around the 50-day moving average. The underlying bearish trend remains intact but a neutral bias is expected in the near term.
A break below the 50-day MA at 1.2454 would find additional support at 1.2420. Near-term risk is tilted to the downside and further weakness in the market could see prices push lower towards the September 8 low of 1.2061. Beyond this point, the market would see a resumption of the downtrend from May.
To the upside, resistance is expected between 1.2600 and 1.2770. Another push higher would open the way towards the key psychological level at 1.3000 ahead of the May 5 peak of 1.3793.
Daily price action looks soft overall after the recent rebound off 1.2061 has stalled, raising the probability of another lower low put in place, to continue the pattern of USDCAD’s decline from 1.3793. The crossover of the 50-day MA below the 200-day MA gave a bearish signal.
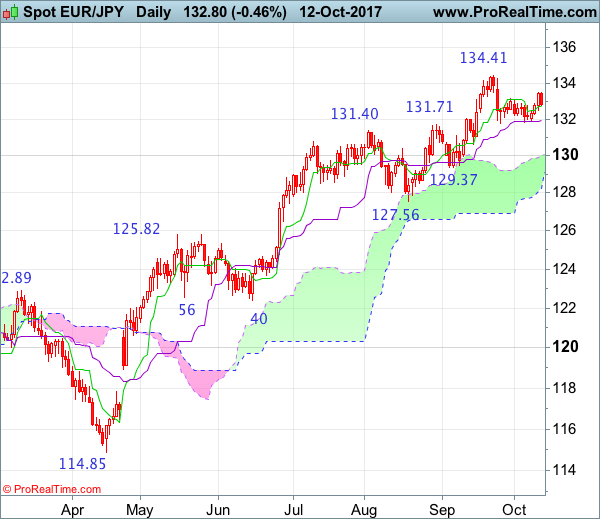
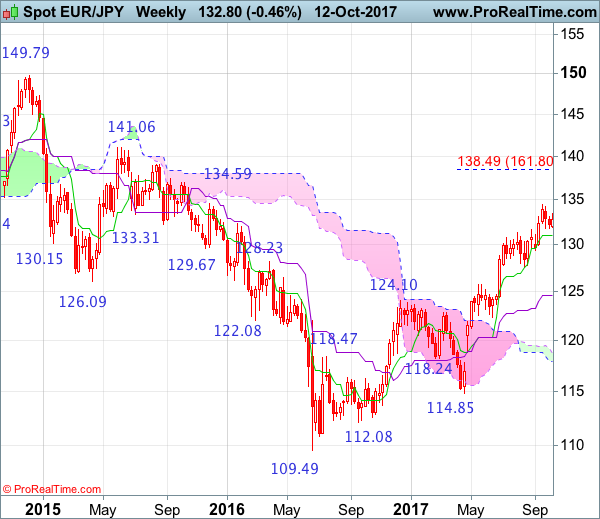
EUR/JPY Candlesticks and Ichimoku Analysis
Weekly
• Last Candlesticks pattern: Window
• Time of formation: 24 April 2017
• Trend bias: Up
Daily
• Last Candlesticks pattern: Hammer
• Time of formation: 18 May 2017
• Trend bias: Up
EUR/JPY – 132.81
Although the single currency continued finding support just above indicated level at 131.75 and has rebounded this week, as euro met resistance at 133.50 and has retreated again yesterday, suggesting further sideways consolidation would take place and another retreat to 132.45 then 132.00 cannot be ruled out, however, only break of said strong support at 131.75 would revive bearishness and signal another leg of corrective decline from 134.41 (last month’s high) is underway for retracement of recent upmove to 131.00, then previous support at 130.62, having said that, reckon psychological level at 130.00 would limit downside and price should stay well above another previous support at 129.37, bring rebound later.
On the upside, whilst recovery to 133.00 cannot be ruled out, said resistance at 133.50 should cap upside and bring another retreat later. Only a break of said resistance at 134.41 would revive bullishness and signal recent upmove is still in progress for further gain to 135.00, however, near term overbought condition should limit upside to 136.00-10 and reckon 136.90-00 would hold from here, price should falter well below 138.45-50 (1.618 times extension of 109.49-124.10 measuring from 114.85), risk from there has increased for a much-needed correction to take place later.
Recommendation: Stand aside for this week.
On the weekly chart, euro’s retreat after last month’s rise to 134.41 has retained our view that minor consolidation below this level would be seen and below 131.75 support would bring test of the Tenkan-Sen (now at 130.99) but a drop below this level is needed to suggest a temporary top has possibly been formed, bring weakness to 129.95-00, however, only a break below 129.37 support would add credence to this view and signal retracement of recent upmove has commenced, hence further weakness to 128.90-00, then towards 128.00-10 would follow but previous support at 127.56 should remain intact.
On the upside, expect recovery to be limited to 133.50-60 and price should falter below said resistance at 134.41, bring retreat later. A break of said resistance would signal recent upmove from 109.49 (2016 low) has once again resumed and extend gain to 135.00, then 136.00-10, however, reckon upside would be limited and 136.95-00 should hold, price should fatter below 138.45-50 (1.618 times extension of 109.49-124.10 measuring from 114.85), bring retreat later.
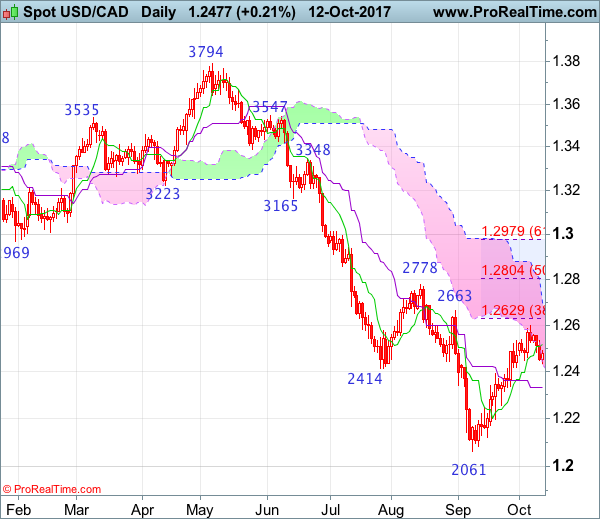
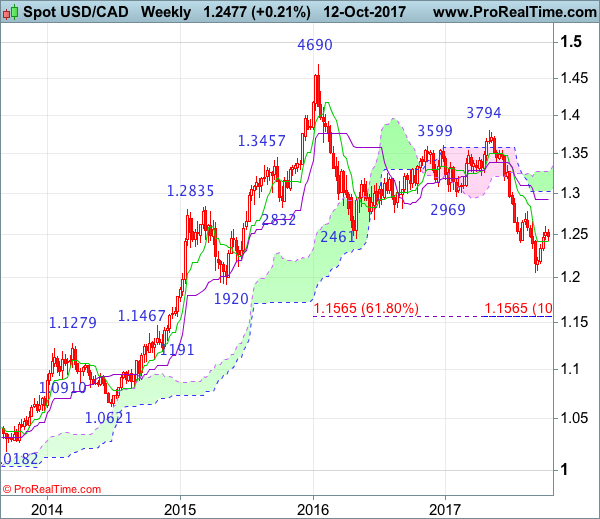
USD/CAD Candlesticks and Ichimoku Analysis
Weekly
• Last Candlesticks pattern: Shooting doji
• Time of formation: 01 May 2017
• Trend bias: Sideways
Daily
• Last Candlesticks pattern: Bearish engulfing
• Time of formation: 5 May 2017
• Trend bias: Down
USD/CAD – 1.2477
Although the greenback extended near term rise from 1.2061 low to 1.2599 last week, the subsequent retreat suggests consolidation below this level would be seen and pullback to 1.2400-10 is likely, however, reckon 1.2335-40 would contain downside and bring another rise later, above said resistance at 1.2599 would extend the aforesaid rise for retracement of early decline to 1.2620-25, then towards resistance at 1.2663, having said that, the upper Kumo (now at 1.2701) should limit upside an price should falter well below resistance at 1.2778, bring another decline later.
On the downside, whilst initial pullback to 1.2400 and then 1.2340-50 cannot be ruled out, reckon the Kijun-Sen (now at 1.2330) would limit downside and bring another rise later. Only a daily close below support at 1.2254 would abort and signal the rebound from 1.2061 has ended instead, bring weakness to 1.2198, break there would add credence to this view and extend weakness to 1.2121. Having said that, break there is needed to retain bearishness and bring further fall towards said recent low at 1.2061. Looking ahead, below 1.2061would extend downtrend to psychological level at 1.2000, having said that, loss of momentum should prevent sharp fall below 1.1920-25 (61.8% projection) and 1.1900 should hold.
Recommendation: Turn long at 1.2325 for 1.2525 with stop below 1.2225
On the weekly chart, although the greenback edged higher to 1.2599 last week, lack of follow through buying and the subsequent retreat look set to form a black candlestick this week, suggesting consolidation below said resistance would be seen and below the Tenkan-Sen (now at 1.2420) would bring weakness towards 1.2310-15, however, downside should be limited to 1.2230-40 and bring another rise later. Above said resistance at 1.2599 would signal the rebound from 1.2061 low is still in progress for retracement of recent decline to previous resistance at 1.2663, then 1.2700-10, having said that, price should falter below previous resistance at 1.2778, bring another decline later in Q4.
On the downside, expect pullback to be limited to 1.2310-15 and 1.2280-85 should hold, bring another rise later to aforesaid retracement targets. Below 1.2121 support would abort and signal the rebound from last month’s low at 1.2061 has ended, bring retest o this level later. A drop below 1.2061 would confirm decline from 1.3794 top has resumed and extend weakness towards psychological support at 1.2000, however, reckon downside would be limited to 1.1920-25 (61.8% projection of 1.3794-1.2414 measuring from 1.2778) and reckon 1.1840-50 would hold from here, price should stay above 1.1750-60, bring rebound later.
US Dollar Back In Bearish Zone Vs Japanese Yen
Key Highlights
- The US Dollar after struggling to move above 113.40 against the Japanese Yen started a downside move.
- There was a break below a major bullish trend line at 112.50 on the 4-hours chart of USD/JPY.
- The US Initial Jobless Claims for the week ending Oct 7, 2017 posted a decline from 258K (revised) to 243K.
- Today in the US, the CPI figure for Sep 2017 will be published, which is forecasted to increase 2.3% (YoY).
USDJPY Technical Analysis
The US Dollar failed to move past 113.40 against the Japanese Yen and later started a downside move. The USD/JPY pair is now in the bearish zone and looks set to extend declines.
During the downside move, the pair broke the 23.6% Fib retracement level of the last wave from the 109.54 low to 113.41 high. Moreover, there was a break below a major bullish trend line at 112.50 on the 4-hours chart.
A close below 112.80 has opened the doors for more declines in the near term. The next major support is at 111.50 and the 50% Fib retracement level of the last wave from the 109.54 low to 113.41 high.
On the upside, buyers need to push the pair back above 112.80 and 113.00 to avoid any further declines.
US Initial Jobless Claims
Recently, the US saw the release of the Initial Jobless Claims for the week ending Oct 7, 2017 by the US Department of Labor. The forecast was slated for a decline from 260K to 251K.
The actual result was better the forecast, as there a decline to 243K and the last reading was revised down to 285K. Looking at the 4-week moving average, there was a decline of 9,500 from the previous week’s revised average of 267,000 257,500.
The report added that:
The advance number for seasonally adjusted insured unemployment during the week ending September 30 was 1,889,000, a decrease of 32,000 from the previous week’s revised level.
The outcome was positive, but the current USD/JPY trend seems to be bearish below 113.00 in the short term.
Other Economic Releases to Watch Today
German Consumer Price Index for Sep 2017 (YoY) – Forecast +1.8%, versus +1.8% previous.
German Consumer Price Index for Sep 2017 (MoM) – Forecast +0.1%, versus +0.1% previous.
US Retail Sales Sep 2017 (MoM) – Forecast +1.7%, versus -0.2% previous.
US Consumer Price Index Sep 2017 (MoM) – Forecast +0.6%, versus +0.4% previous.
US Consumer Price Index Sep 2017 (YoY) – Forecast +2.3%, versus +1.9% previous.
US Consumer Price Index Ex Food & Energy Sep 2017 (YoY) – Forecast +1.8%, versus +1.7% previous.
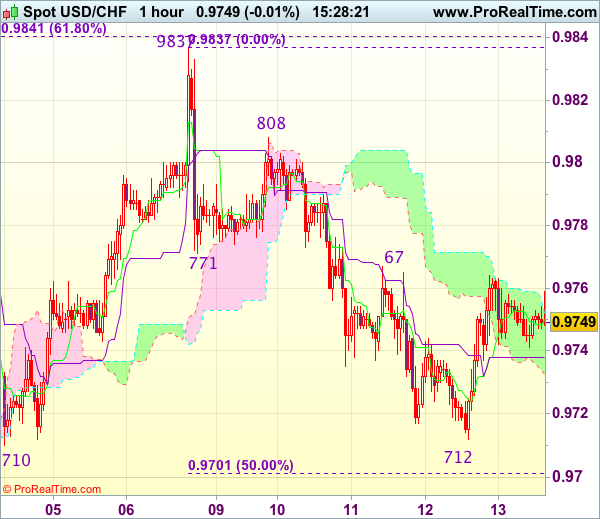
Trade Idea : USD/CHF – Hold short entered at 0.9755
USD/CHF - 0.9756
Most recent candlesticks pattern : N/A
Trend : Near term down
Tenkan-Sen level : 0.9750
Kijun-Sen level : 0.9738
Ichimoku cloud top : 0.9752
Ichimoku cloud bottom : 0.9733
Original strategy :
Sold at 0.9755, Target: 0.9655, Stop: 0.9790
Position : - Short at 0.9755
Target : - 0.9655
Stop : - 0.9790
New strategy :
Hold short entered at 0.9755, Target: 0.9655, Stop: 0.9790
Position : - Short at 0.9755
Target : - 0.9655
Stop : - 0.9790
Although the greenback rebounded after holding above previous support at 0.9710 and consolidation with initial upside bias is seen, reckon resistance at 0.9767-71 would limit upside and bearishness remains for the decline from 0.9837 top to resume after consolidation, below said support at 0.9710-12 would confirm and extend weakness to 0.9669-70 (61.8% Fibonacci retracement of 0.9565-0.9837 and previous support) but previous support at 0.9642 should remain intact due to oversold condition.
In view of this, we are holding on to our short position entered at 0.9755. Only break of resistance at 0.9808 would signal an intra-day low is formed and indicate the pullback from 0.9837 has ended, bring retest of this level later.
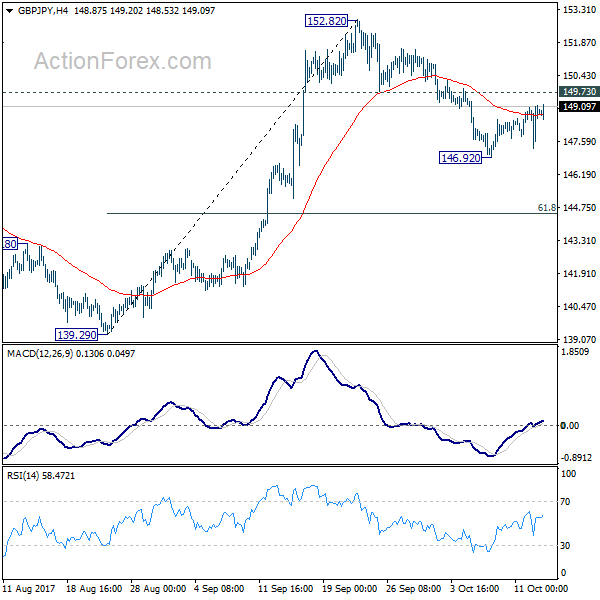
GBP/JPY Daily Outlook
Daily Pivots: (S1) 147.77; (P) 148.46; (R1) 149.63; More
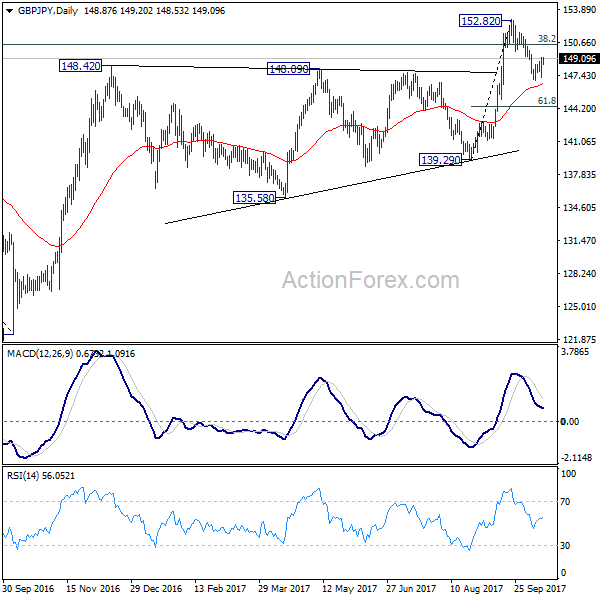
At this point, GBP/JPY is staying in consolidation above 146.92 temporary low and intraday bias remains neutral. Another decline is expected with 149.73 resistance intact. Below 146.92 will target 61.8% retracement of 139.29 to 152.82 at 144.45. Such decline is seen as a correction and we'd look for strong support from 144.45 to bring rebound. On the upside, break of 149.73 support turned resistance will argue that the pull back is completed and turn bias back to the upside for retesting 152.82 high. However, sustained break of 144.45 will put 139.29 key support in focus.
In the bigger picture, medium term rebound from 122.36 is still expected to resume after corrective pull back from 152.82 completes. Firm break of 38.2% retracement of 196.85 to 122.36 at 150.43 will carry long term bullish implications. In that case, GBP/JPY could target 61.8% retracement at 167.78. However, break of 139.29 will indicate rejection from 150.43 key fibonacci level. And the three wave corrective structure of rebound from 122.36 will argue that larger down trend is resuming for a new low below 122.26.
Trade Idea : GBP/USD – Buy at 1.3250
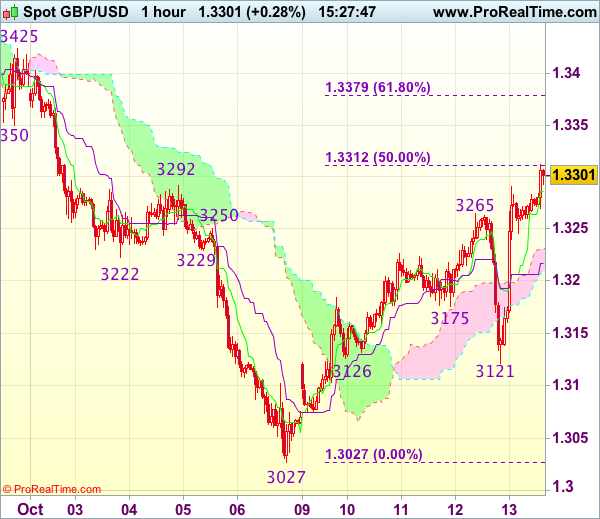
GBP/USD - 1.3316
Most recent candlesticks pattern : N/A
Trend : Near term up
Tenkan-Sen level : 1.3292
Kijun-Sen level : 1.3223
Ichimoku cloud top : 1.3230
Ichimoku cloud bottom : 1.3209
New strategy :
Buy at 1.3250, Target: 1.3350, Stop: 1.3215
Position : -
Target : -
Stop : -
As the British pound found renewed buying interest at 1.3121 yesterday and has rallied, suggesting the rise from 1.3027 low is still in progress, hence consolidation with upside bias is seen for this move to bring a stronger retracement of recent decline, hence gain to 1.3345-50 would be seen, however, near term overbought condition should limit upside to 1.3375-80 (61.8% Fibonacci retracement of 1.3596-1.3027) and 1.3400 should hold from here.
In view of this, would not chase this rise here and would be prudent to buy cable on pullback as 1.3245-50 should limit downside. Below the Kijun-Sen (now at 1.3223) would defer and suggest an intra-day top is formed, bring weakness to 1.3200, then towards 1.3175 but said support at 1.3121 should remain intact.
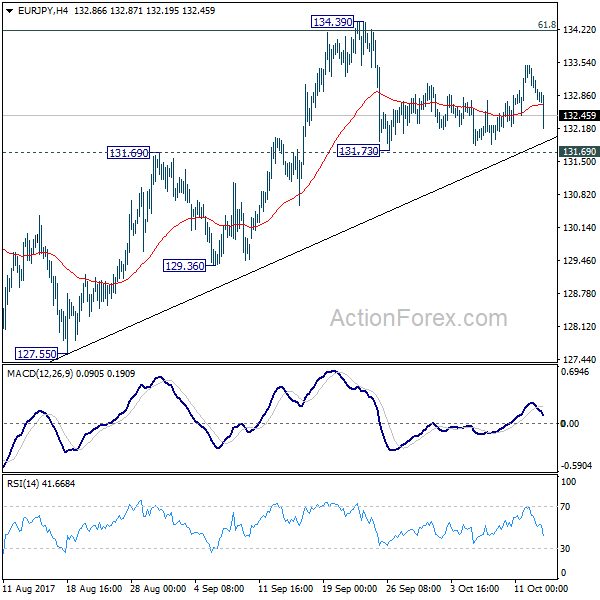
EUR/JPY Daily Outlook
Daily Pivots: (S1) 132.59; (P) 133.04; (R1) 133.28; More...
No change in EUR/JPY's outlook as it's still bounded in range of 131.73/134.39. Intraday bias remains neutral at this point. Near term outlook remains bullish as long as 131.69 holds. Sustained break of 134.20 fibonacci level will extend larger up trend to 141.04 resistance next. However, break of 131.69 will be an early sign of medium term reversal and will target 127.55 key support level instead.
In the bigger picture, medium term rise from 109.03 (2016 low) is seen as at the same degree as the down trend from 149.76 (2014 high) to 109.03 (2016 low). 61.8% retracement of 149.76 to 109.03 at 134.20 is already met. Sustained break there will pave the way to key long term resistance zone at 141.04/149.76. However, break of 127.55 support will argue that the medium term trend has reversal and will turn outlook bearish for deeper fall.