
Sample Category Title
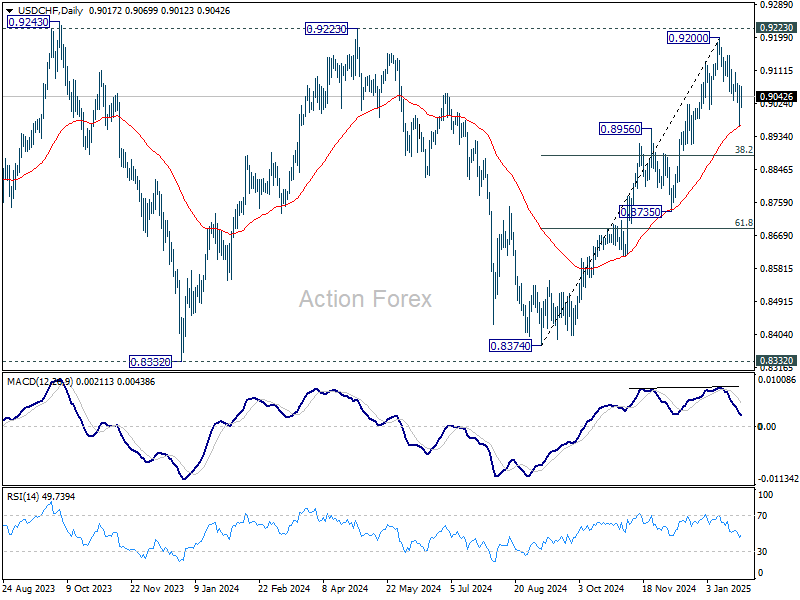
USD/CHF Mid-Day Outlook
Daily Pivots: (S1) 0.8966; (P) 0.9019; (R1) 0.9074; More…
Intraday bias in USD/CHF remains neutral for the moment. Rise from 0.9374 remains intact so far with strong support support seen from near term rising channel. On the upside, break of 0.9107 will target 0.9200 and 0.9223 key resistance. On the downside, however, break of 0.8964 will resume the fall from 0.9200 to 38.2% retracement of 0.8374 to 0.9200 at 0.8884 next.
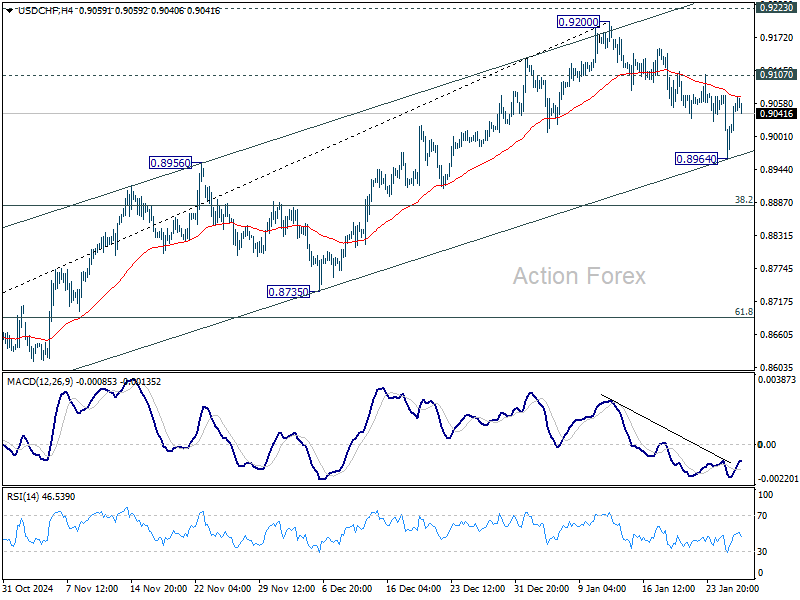
In the bigger picture, as long as 0.9223 resistance holds, price actions from 0.8332 (2023 low) are seen as a medium term corrective pattern. That is, long term down trend is in favor to resume through 0.8332 at a later stage. However, sustained break of 0.9223 will be an important sign of bullish trend reversal.
Dollar Shrugs Poor Durable Orders; AUD Awaits Inflation Data
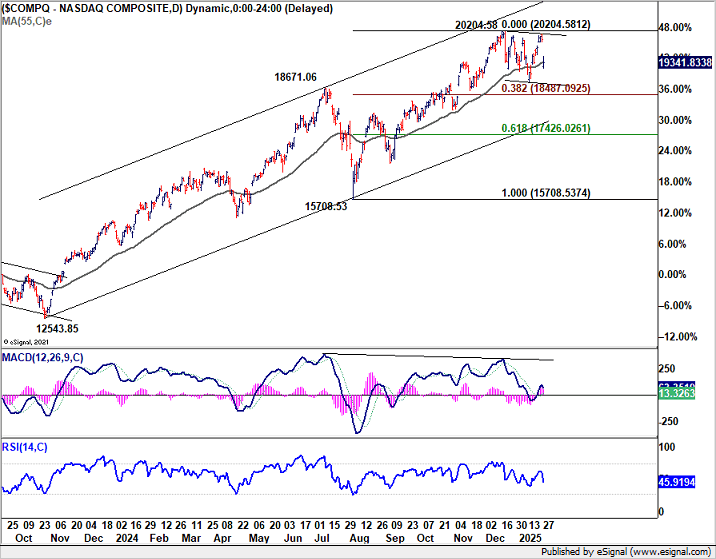
The global financial markets are finding their footing following the turmoil triggered by yesterday’s tech-driven selloff. European stocks have moved into positive territory, while US futures signal a flat start to trading. Nvidia, which lost a staggering -17% on Monday—erasing nearly USD 600B in market capitalization—is poised for a partial rebound. Meanwhile, investors appear to have shrugged off US durable goods orders data, which showed a sharp contraction, as the weakness was primarily attributed to volatile transportation equipment orders rather than broader economic concerns.
From a technical perspective, NASDAQ’s sharp decline appears to be merely a part of the ongoing consolidation from its record high of 20204.58. Volatility of this nature is not unusual during such phases. For now, more sideway trading is likely and deeper pull back might be seen. But downside should be contained by 38.2% retracement of 15708.53 to 20204.58 at 18787.09 to bring rebound, and then up trend resumption.
In the currency markets, Dollar is the day’s strongest performer so far, supported by ongoing tariff discussions. It is followed by Loonie and then Swiss Franc. On the other hand, Aussie is the weakest with anticipation ahead of critical inflation data. Kiwi and Euro are also under pressure, with the latter impacted by weak German business climate data and concerns about prolonged structural economic challenges in Europe. Sterling and the Swiss Franc are sitting in the middle of the pack.
Attention is now shifting to Australia’s CPI release in the upcoming Asian session, which could heavily influence expectations for RBA's February 17-18 policy meeting. Quarterly inflation is forecast to slow from 2.8% yoy to 2.5%, while the monthly CPI reading is expected to show an uptick from 2.3% to 2.5%. Money markets currently assign an 80% probability to an RBA rate cut in February. However, a meaningful decline in trimmed mean CPI, from 3.5% to 3.3% or lower, should be needed to provide RBA with sufficient confidence to begin easing.
AUD/JPY will be a focal point for traders reacting to Australia’s inflation data. Repeated rejection by falling 55 D EMA is keeping near term outlook bearish. Break of 96.05 support will suggest that decline from 102.39, as the second leg of the corrective pattern from 90.10, is resuming. Next target is 61.8% retracement of 90.10 to 102.39 at 94.79.

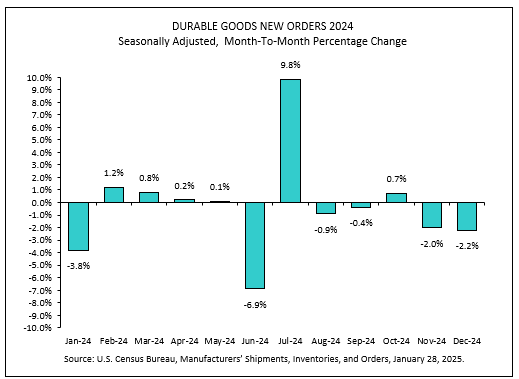
US durable goods orders down -2.2% mom, driven by transportation equipment
US durable goods orders fell -2.2% mom to USD 276.1B, much worse than expectation of 0.8% mom. Transportation equipment, down four of the last five months, drove the decrease, down by -7.4% mom to USD 86.1B.
Ex-transport orders rose 0.3% mom to USD 189.9B, slightly below expectation of 0.4% mom. Ex-defense orders fell -3.1% om to USD 258.2B.
Germany faces deep economic crisis amid structural weakness, BDI Warns
Germany’s economic challenges were laid bare today as BDI President Peter Leibinger warned of a "deep economic crisis" during the annual press conference.
The country's economic output is expected to shrink slightly this year, with Leibinger emphasizing that the situation reflects more than just short-term shocks like the pandemic or the war in Ukraine.
Instead, he highlighted long-term "structural" weaknesses that have plagued Germany as a business hub, particularly over the past six years.
Leibinger pointed to the "structural break" in industrial growth, with empty order books, idle machinery, and a marked decline in domestic investments.
His remark, "I cannot remember such a bad mood in industrial companies," underscores the deep malaise gripping the sector.
German industry is not only struggling to compete globally against powers like the US and China but is also falling behind within the European Union.
Australia NAB business confidence rises to -2, price pressures persist
Australia's NAB Business Confidence showed slight improvement in December, rising from -3 to -2, but remains below the long-term average since early 2023. Business Conditions, on the other hand, posted a stronger gain, climbing from 3 to 6.
Breaking down the details, trading conditions improved from 6 to 9, profitability rose from 0 to 4, and employment conditions ticked up from 3 to 4.
Price pressures continue to persist, with purchase cost growth rising slightly to 1.5% in quarterly equivalent terms. Labour cost growth edged lower to 1.4%, but output price growth increased by 0.3 percentage points to 0.9%. Retail prices also ticked up to 0.7%.
According to NAB Chief Economist Alan Oster, “The uptick in purchase cost growth and final product prices reminds us that businesses continue to face some price pressures.”
USD/CHF Mid-Day Outlook
Daily Pivots: (S1) 0.8966; (P) 0.9019; (R1) 0.9074; More…
Intraday bias in USD/CHF remains neutral for the moment. Rise from 0.9374 remains intact so far with strong support support seen from near term rising channel. On the upside, break of 0.9107 will target 0.9200 and 0.9223 key resistance. On the downside, however, break of 0.8964 will resume the fall from 0.9200 to 38.2% retracement of 0.8374 to 0.9200 at 0.8884 next.
In the bigger picture, as long as 0.9223 resistance holds, price actions from 0.8332 (2023 low) are seen as a medium term corrective pattern. That is, long term down trend is in favor to resume through 0.8332 at a later stage. However, sustained break of 0.9223 will be an important sign of bullish trend reversal.
US durable goods orders down -2.2% mom, driven by transportation equipment
US durable goods orders fell -2.2% mom to USD 276.1B, much worse than expectation of 0.8% mom. Transportation equipment, down four of the last five months, drove the decrease, down by -7.4% mom to USD 86.1B.
Ex-transport orders rose 0.3% mom to USD 189.9B, slightly below expectation of 0.4% mom. Ex-defense orders fell -3.1% om to USD 258.2B.
Full US durable goods orders release here.
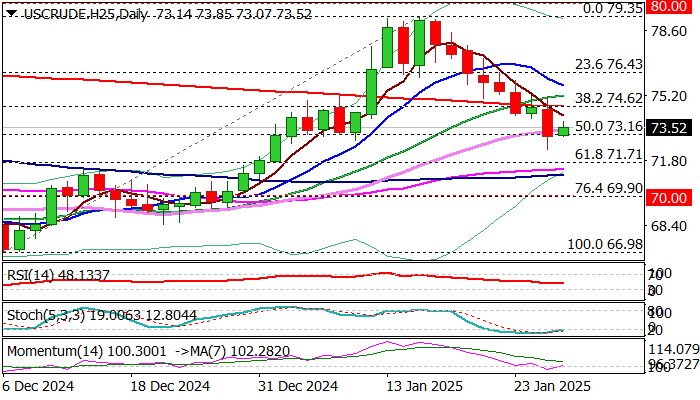
WTI Oil: Bears Taking a Breather
WTI oil price edged higher from new almost one month low on Tuesday, signaling that steep fall that extends into second week, may take a breather.
The drop was sparked by profit-taking from previous $66.98/$79.35 rally, likely boosted by signals from President Trump about pressuring OPEC to drop oil prices to harm Russian oil exports and unexpectedly weak data from China’s manufacturing sector that raised concerns about demand from world’s biggest oil importer.
Warmer weather in the US also contributed to recent weakness, while turmoil in financial markets from surge in a China’s low-cost AI model provided some headwinds to bears.
Recent fall found a footstep at 50% retracement of $66.98/$79.35 advance ($73.16), with oversold conditions on daily chart, generating initial positive signal.
North-heading 14-d momentum is emerging from negative territory and contributes to recovery signals.
On the other hand, strong barrier lays at $74.62 (200DMA / broken Fibo 38.2%) and reaction here will probably define near term direction.
Recovery stall under this level to keep broader bears in play and offer better selling levels for fresh push lower.
Conversely, firm break above $74.62 to generate reversal signal, which will require lift above $75.00 zone (Fibo 38.2% of $79.35/$72.38 bear-leg / 20DMA) for confirmation.
Res: 73.89; 74.02; 74.62; 75.00.
Sup: 73.07; 73.16; 72.38; 71.71.
Australian Dollar Declines as External Pressures and Rising Risks Weigh
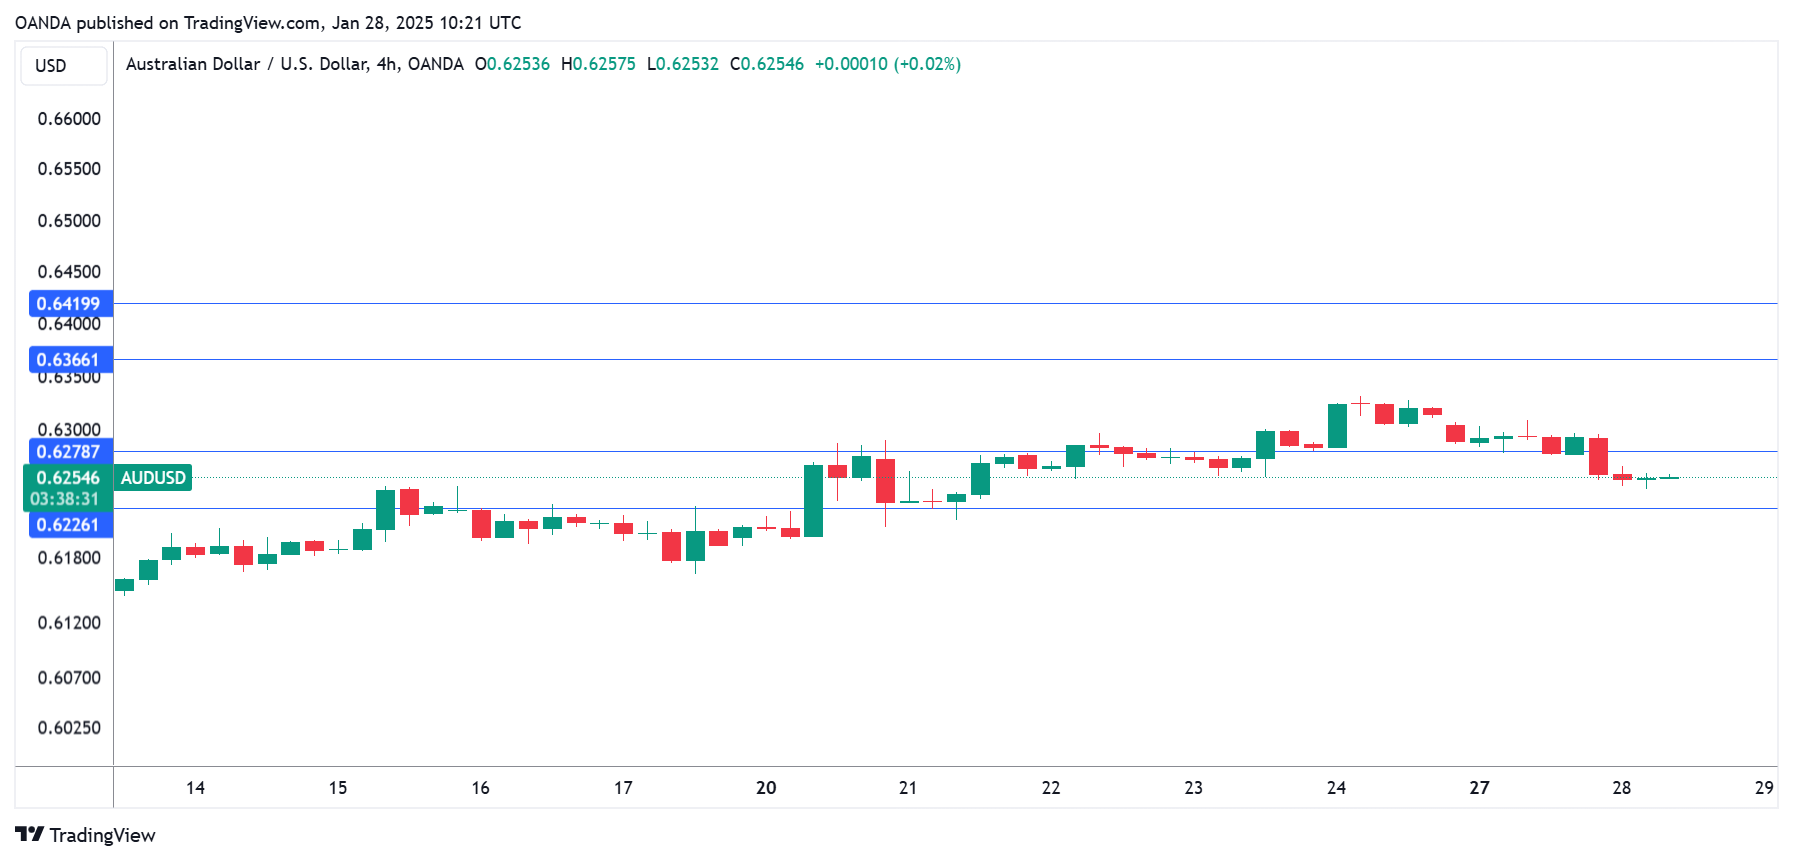
The AUD/USD pair fell to 0.6257 on Tuesday, marking its second consecutive session of losses. The Australian dollar remains under pressure due to external factors, including a strengthening US dollar and growing global risks.
Key drivers behind the AUD decline
The US dollar has gained strength following renewed threats from US President Donald Trump to impose trade duties. Trump announced plans to levy tariffs on imported chips, pharmaceutical products, and raw materials such as aluminium, copper, and steel, aiming to stimulate domestic production. These developments have heightened market uncertainty and weighed on risk-sensitive currencies like the Australian dollar.
In addition, global markets are jittery due to a sharp sell-off in the US stock market. The sell-off was driven by concerns over the open-source AI model DeepSeek which poses a potential challenge to the dominance of US companies in the artificial intelligence sector. This risk-off sentiment has further pressured the aussie.
On the domestic front, Australia reported an improvement in business activity metrics for December. However, the focus is now on the upcoming inflation data, which will provide critical insights ahead of the Reserve Bank of Australia's (RBA) February meeting to review interest rate policy.
AUD/USD technical analysis
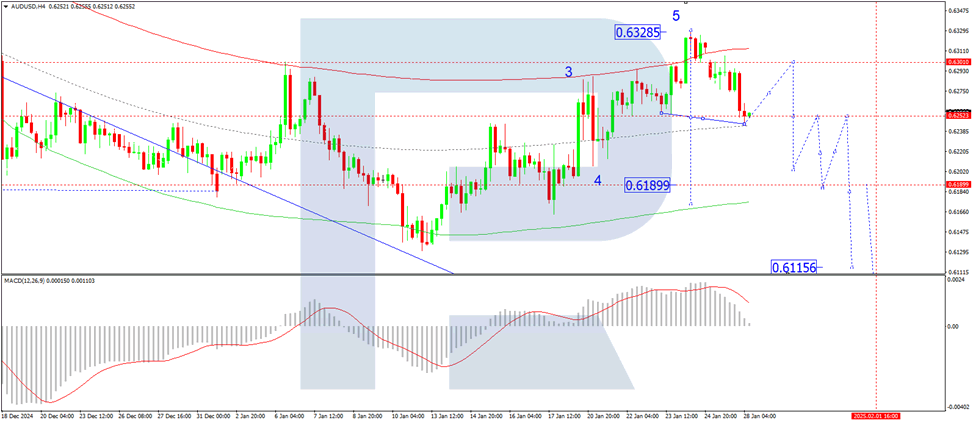
On the H4 chart, AUD/USD has executed a downward wave to 0.6245. A correction towards 0.6290 is expected today. Subsequently, another downward wave targeting 0.6250 may develop, with the potential for a consolidation range forming around this level. If the pair breaks upwards from the consolidation, a further correction towards 0.6290 is possible. Conversely, a downward breakout would open the potential for a deeper decline to 0.6190, which serves as a local target. The MACD indicator confirms this scenario, with its signal line above the zero mark but pointing decisively downwards, indicating continued bearish momentum.
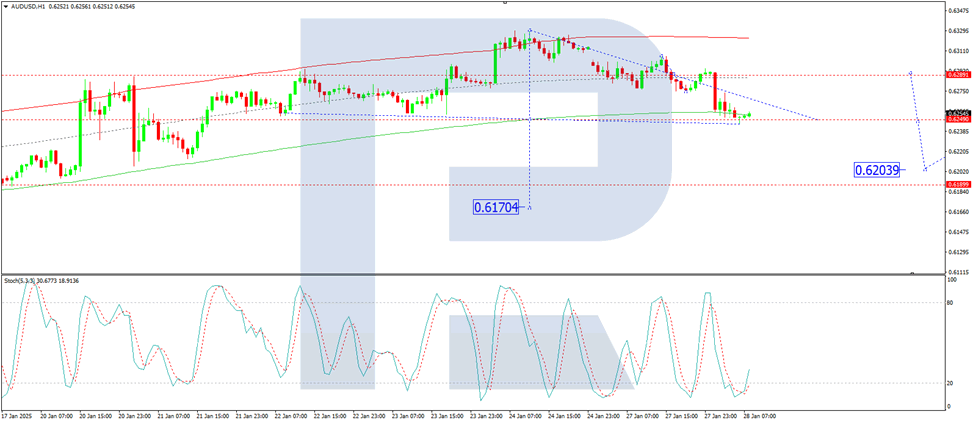
On the H1 chart, AUD/USD formed a consolidation range around 0.6290 before breaking downwards to 0.6245. The market is now consolidating at the current lows. An upward breakout could lead to a correction back to 0.6290 (as a test from below). However, a downward breakout would signal a continuation of the decline towards 0.6204, with the trend potentially extending to 0.6190. The Stochastic oscillator supports this outlook, with its signal line below the 20 mark but pointing upwards towards 80, suggesting a possible short-term correction before further declines.
Conclusion
The Australian dollar remains under pressure due to external uncertainties, including US trade policy developments and global risk aversion. While technical analysis suggests potential for a short-term correction, the broader trend remains bearish, with targets at 0.6204 and 0.6190. Upcoming Australian inflation data will play a key role in determining the currency’s near-term trajectory, particularly as the RBA’s February policy meeting approaches.
Germany faces deep economic crisis amid structural weakness, BDI Warns
Germany’s economic challenges were laid bare today as BDI President Peter Leibinger warned of a "deep economic crisis" during the annual press conference.
The country's economic output is expected to shrink slightly this year, with Leibinger emphasizing that the situation reflects more than just short-term shocks like the pandemic or the war in Ukraine.
Instead, he highlighted long-term "structural" weaknesses that have plagued Germany as a business hub, particularly over the past six years.
Leibinger pointed to the "structural break" in industrial growth, with empty order books, idle machinery, and a marked decline in domestic investments.
His remark, "I cannot remember such a bad mood in industrial companies," underscores the deep malaise gripping the sector.
German industry is not only struggling to compete globally against powers like the US and China but is also falling behind within the European Union.
AUD/USD Slides on Trump Tariff Threats, CPI Next
The Australian dollar is in negative territory on Tuesday. In the North American session, AUD/USD is trading at 0.6252, down 0.62%.
Australian CPI expected to ease to 2.5%
Investors are keeping a closer eye on the third-quarter inflation report, which will be released early on Wednesday. CPI is expected to ease to 2.5% from 2.8%. This is the final tier-1 event prior to the Reserve Bank of Australia’s rate meeting on Feb. 18 and could be the determining factor as to whether the RBA finally lowers interest rates. The markets have priced in about an 80% chance of a quarter-point cut at the February meeting. The RBA has maintained the cash rate at 4.35% since Nov. 2023 and has been an outlier among other major central banks, most of which have entered an easing cycle.
The US dollar is showing broad strength today, after US President Trump said on Monday that he would impose tariffs on steel, aluminum and copper imported to the U.S. Trump reiterated that he plans to levy a baseline universal tariff on all imports. Trump’s tariff plans would likely raise inflation and could destabilize the financial markets, which displayed strong swings during Trump’s first week in office.
China’s services and manufacturing sectors both decelerated in January and missed expectations. The non-manufacturing PMI fell to 50.2, down from 52.2 in December and shy of the forecast of 51.8. With the exception of November, service activity has been stagnant, with readings barely above the 50 level, which separates expansion from contraction. Domestic demand weakened and the uncertainty surrounding Donald Trump’s trade policies have dampened foreign sales.
The manufacturing sector is struggling and contracted in January, easing to 49.1, compared to 50.1 in December and missing the market estimate of 50.1. This was the first contraction since September 2024 and the sharpest decline in five months. Manufacturing output and foreign orders weakened in January and the weak global economy could mean further headwinds in 2025 for the manufacturing sector.
China’s government has implemented stimulus measures in order to boost the economy and GDP hit 5% in 2024. Still, deflation has persisted and consumer spending remains weak. The government will have to inject further stimulus in order to boost domestic consumption, a key engine of economic growth.
AUD/USD Technical
- AUD/USD is testing support at 0.6278. Below, there is support at 0.6225
- 0.6366 and 0.6419 are the next resistance lines
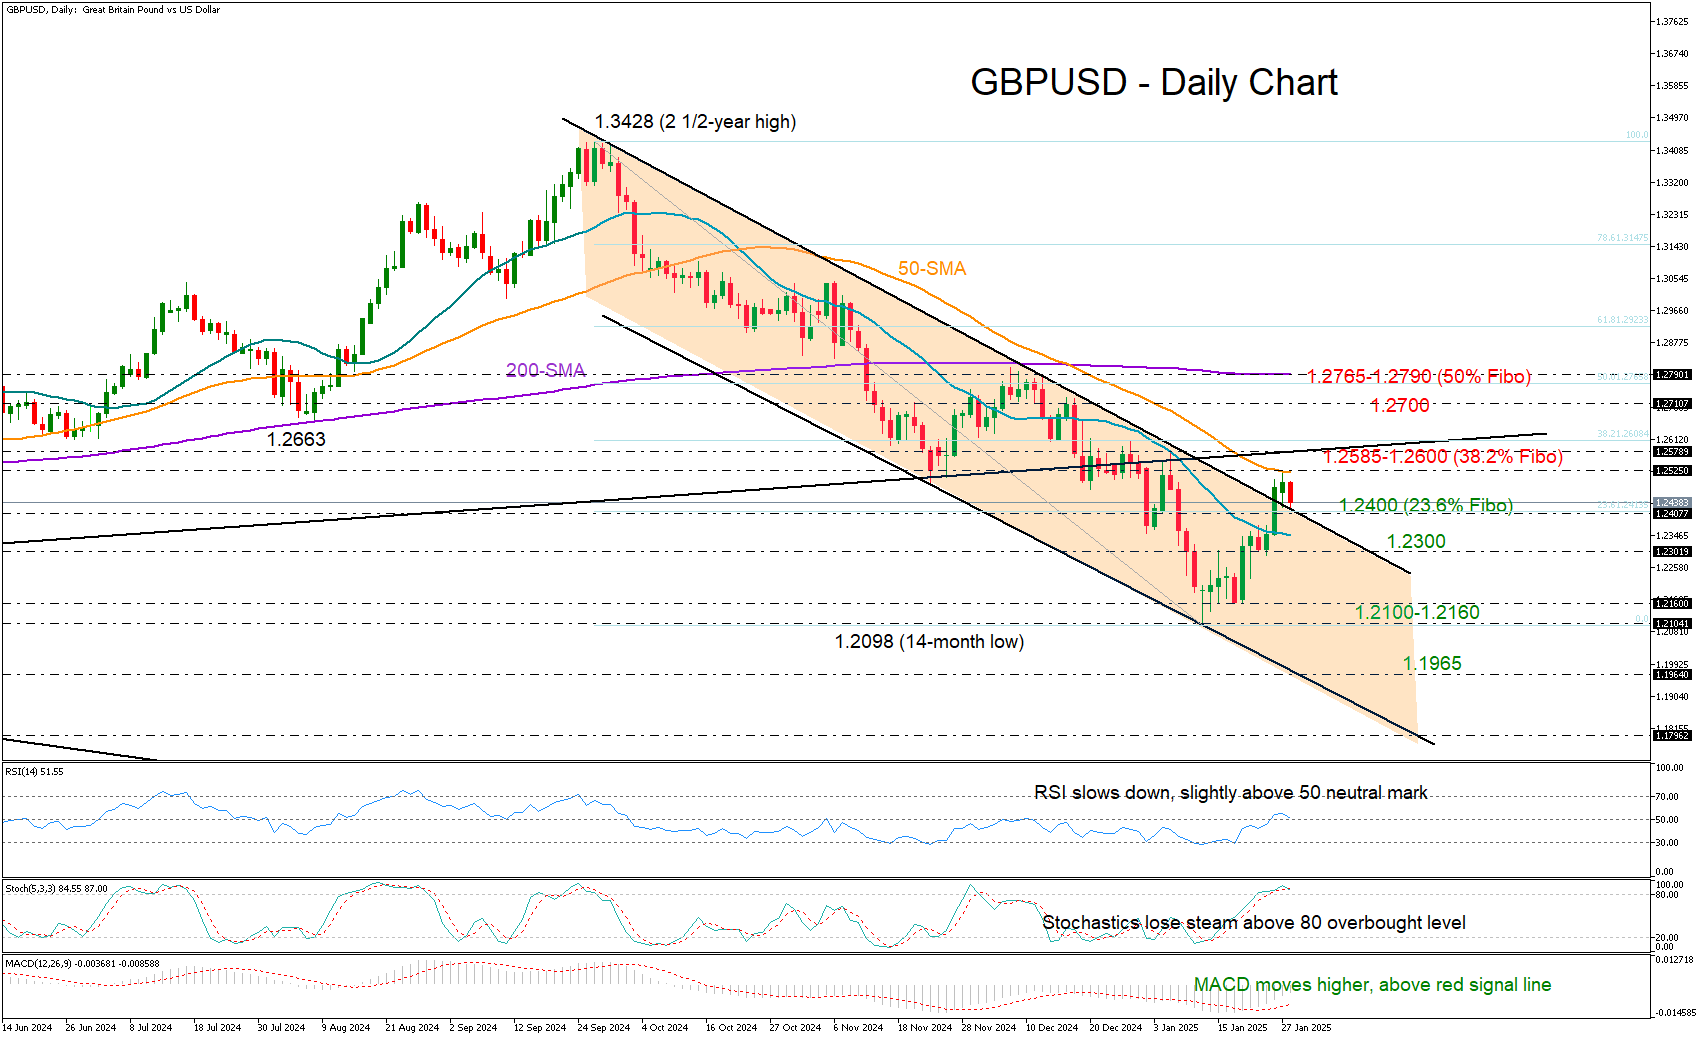
GBP/USD: A False Bullish Breakout?
- GBPUSD breaks above bearish channel, faces rejection near 50-SMA.
- Caution persists among traders as they await a close above 1.2600.
GBPUSD stalled around the falling 50-day simple moving average (SMA) at 1.2525 soon after exiting the bearish channel on the upside.
Was this a false bullish breakout? No, not as long as the price continues to trade above the channel’s upper boundary seen near 1.2400. The area is currently under examination along with the 23.6% Fibonacci retracement of the latest downtrend. Hence, failure to pivot there could disappoint traders, bringing the 1.2300 round level next into view, while a deeper fall might aim for a bearish extension below the crucial support area of 1.2100-1.2160.
According to the technical indicators, downside risks are still alive. The falling 20- and 50-day SMAs have yet to show any signs of improvement, while the RSI is losing steam marginally above its 50 neutral mark and the stochastic oscillator is set for a negative reversal.
In the event the pair crosses above its 50-day SMA, the bulls must also jump the wall at 1.2580-1.2600, where the 38.2% Fibonacci mark and the broken support-turned-resistance trendline from March 2023 are sitting. A successful penetration higher could bolster buying appetite, lifting the price swiftly up to the 1.2700 number or even higher to the 50% Fibonacci of 1.2765 and the 200-day SMA at 1.2790.
All in all, GBPUSD moved out of a bearish formation, signaling a potential upward trend reversal. Despite this, the pair has yet to close above the wall of 1.2600, which might be a prerequisite for a major bullish wave.
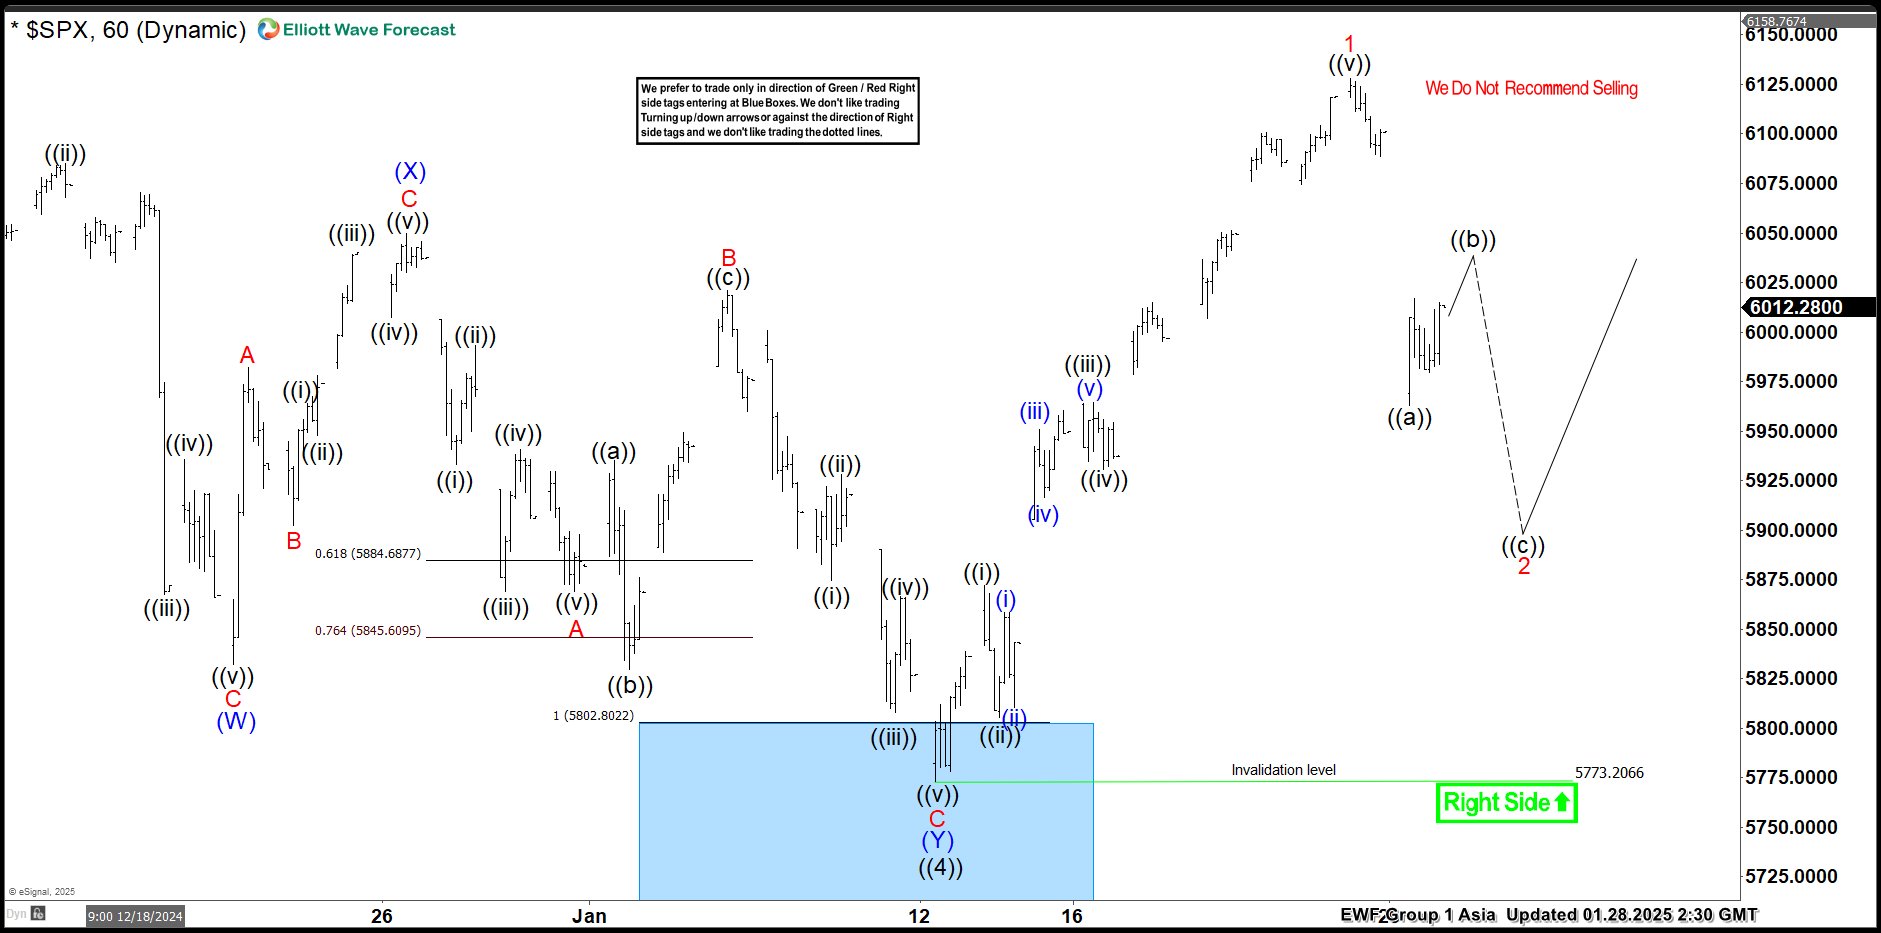
SPX Pullback Expected To Hold in 3, 7 Or 11 Swings
Short Term Elliott Wave view in S&P 500 ( SPX) suggests that rally to new all time high on 12.16.2024 at $6099.97 ended wave ((3)). Pullback in wave ((4)) is proposed complete at $5773.20 as the 1 hour chart below shows. Internal subdivision of wave ((4)) unfolded as Elliott wave double three structure. Down from wave ((3)), wave (W) ended in lesser degree 3 swings at $5832.30. Wave (X) bounce ended in 3 swings at $6049.75 high. Then wave (Y) lower ended at $5773.20 low with another lesser degree 3 swings thus completed wave ((4)) pullback.
The Index has turned higher in wave ((5)) and managed to make a new high above previous wave ((3)) high of $6099.97 confirming the next extension higher. Up from wave ((4)), the rally took place as an impulse sequence where wave ((i)) ended at $5871.92 high. Wave ((ii)) pullback ended at $5805.42 low. Index nested higher in wave ((iii)) & ended at $5964.69 high. Then wave ((iv)) pullback ended at $5930.72 low. Above from there, wave ((v)) ended with extension at $6128.18 high & completed wave 1. Down from there, the index is doing a pullback in wave 2 against 1.13.2025 low. Therefore, pullback should hold in 3, 7 or 11 swings looking for more upside.
SPX 1-Hour Elliott Wave Chart From 1.28.2025
SPX Elliott Wave Video
https://www.youtube.com/watch?v=Z3ighVqtFz4
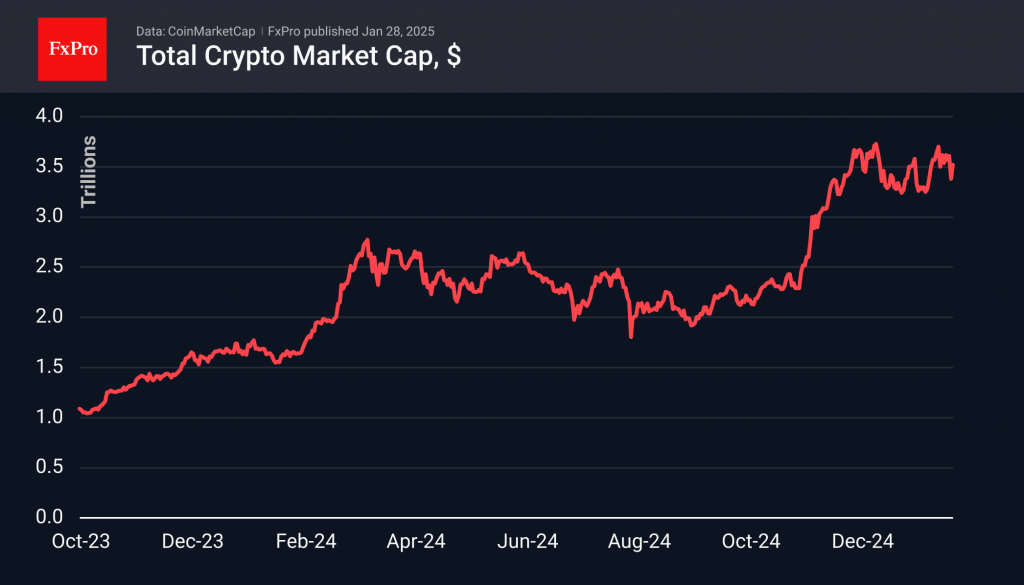
Crypto Market Withstood the Sell-off
Market Picture
On Monday, the cryptocurrency market partially recovered from the initial decline, regaining about 2/3 of the lost value. As a result, the cryptocurrency market capitalisation increased by 4.3% from the previous day and, by the start of trading in Europe, stands at $3.52 trillion. This is still below the level of the previous weeks when capitalisation hovered around $3.6 trillion.
The cryptocurrency market sentiment index rose to 72 over the past day, showing a steady appetite for risk assets despite the recent sell-off.
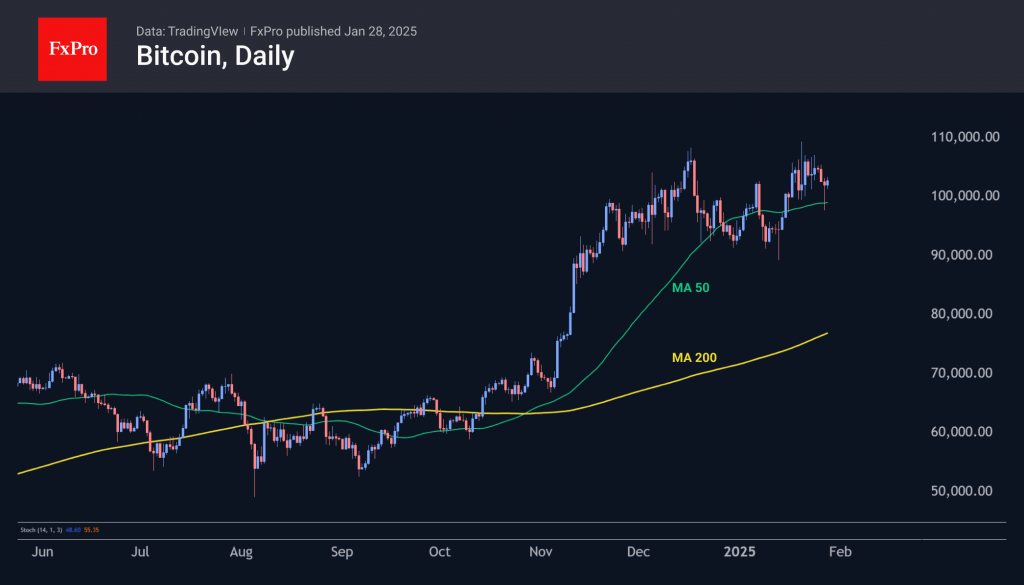
By the end of Monday, bitcoin had recovered from its fall and was back above the $101K mark. On Tuesday morning, its price approached $103K, crossing the 50-day moving average.
XRP, after losing more than 15% during Monday’s day, ended trading above the important $3 level. The price is currently at $3.09, showing a full recovery from the slump and a demonstration of strength that many other altcoins lack.

News Background
After another recalculation, bitcoin’s mining difficulty fell 2.12% to 108.11T, the first decline since September 2024.
According to CoinShares data, global crypto fund investments totalled $1.858bn last week, up from $2.195bn a week earlier. This positive trend continued for the third week in a row, intensifying in the last two weeks. Bitcoin investments were up $1.591bn, Ethereum up $205m, XRP up $19m and Solana up $7m.
CoinShares suggests that the rise in investment in digital assets can be attributed to President Trump’s executive orders to create a strategic reserve asset in Bitcoin. Among smaller digital assets, Solana, Chainlink, and Polkadot received the largest investment inflows.
According to CryptoQuant data, the share of investors with a balance of at least 1,000 BTC who purchased coins in the last 155 days increased from 43% to 60%, reflecting the emergence of large players amid optimistic sentiment.