Sample Category Title
NZDCAD Price Action Breakdown
The NZDUSD pair has lost its recent gains and is trading near 0.5680 on Monday as market sentiment turns cautious. This pressure comes from reports that former US President Trump's advisers are pushing for 25% tariffs on Mexico and Canada starting February 1, with no plans for negotiations. Meanwhile, tensions with Colombia eased after the country agreed to US terms regarding deportation flights.
The US Dollar Index (DXY) has recovered from its monthly low and is trading near 107.70, adding to the Kiwi's struggles. Additionally, weaker-than-expected Chinese manufacturing data and the limited impact of China's new economic stimulus measures have further weighed on the New Zealand Dollar, given New Zealand's reliance on trade with China.
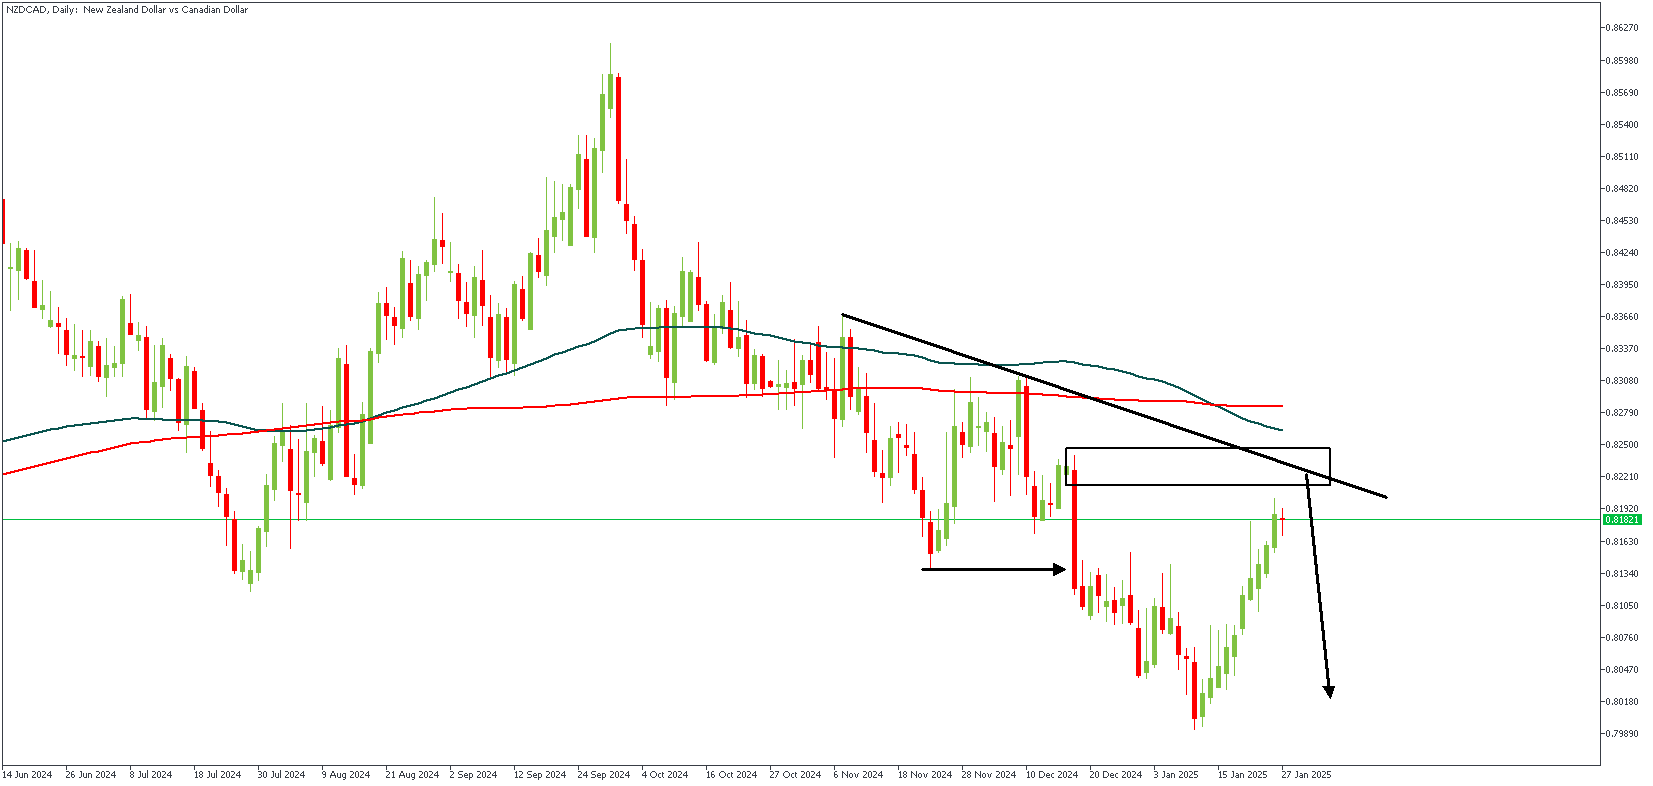
NZDCAD – D1 Timeframe
Crossing the 100-day moving average below the 200-day moving average is the initial factor leaning towards a bearish sentiment. In addition to that, however, we see the trendline resistance aligning well within the range of the rally-base-drop supply zone highlighted on the daily timeframe chart of NZDCAD. Since the price has already mitigated the Fair Value Gap (FVG) area, retesting the supply zone would be necessary to complete the puzzle.
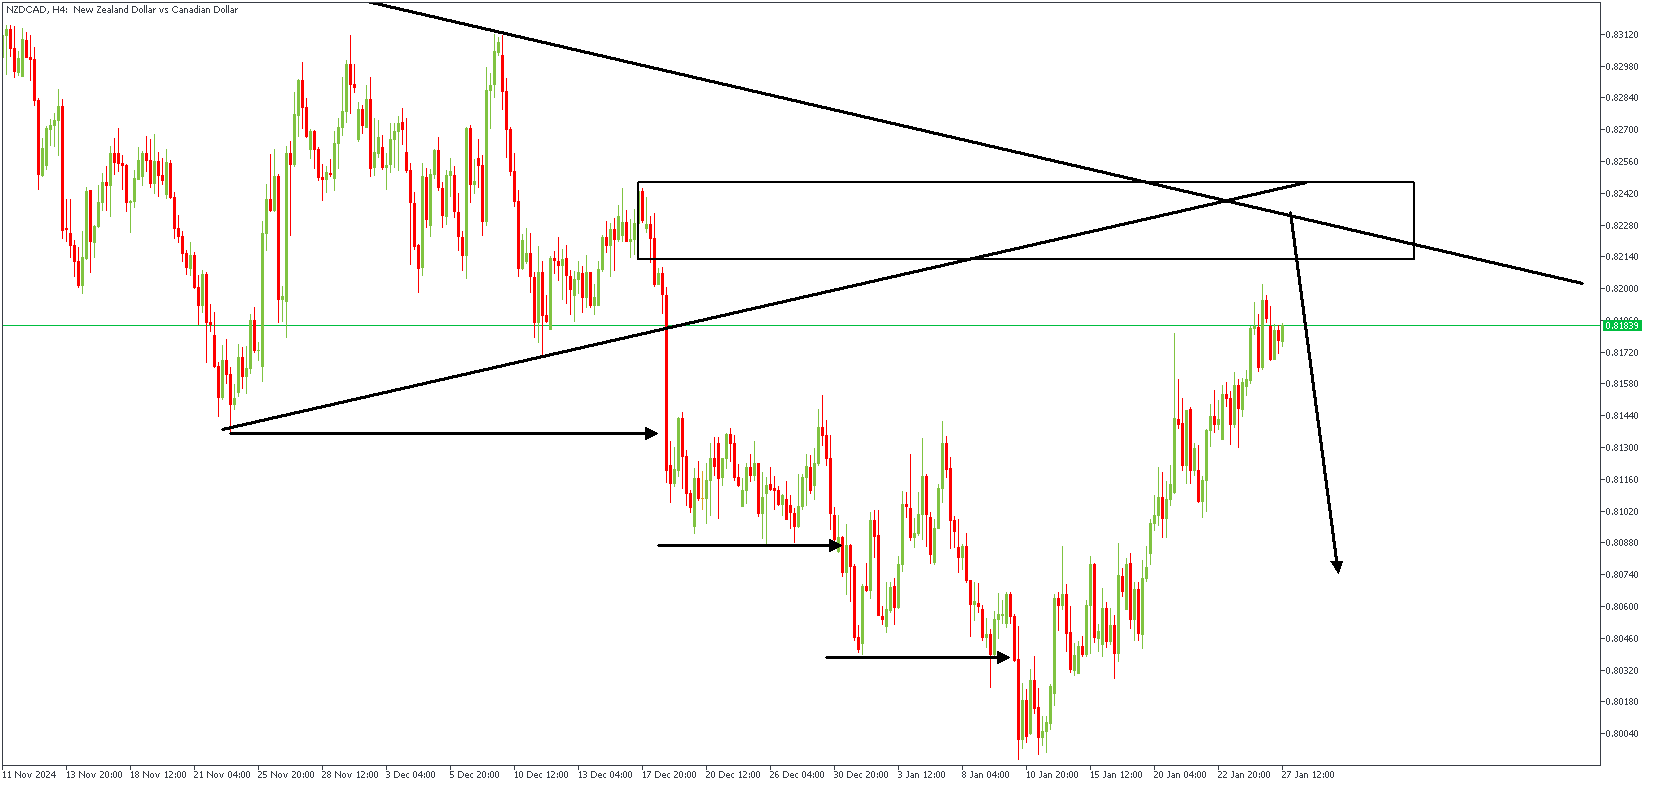
NZDCAD – H4 Timeframe
On the 4-hour timeframe chart, we discover that there are two resistance trendlines – not just one – and both intersect right within the region of the supply zone. The multiple bearish breaks of structure and the price's expected reaction from the supply zone would confirm a bearish entry.
Analyst's Expectations:
- Direction: Bearish
- Target: 0.80706
- Invalidation: 0.82582
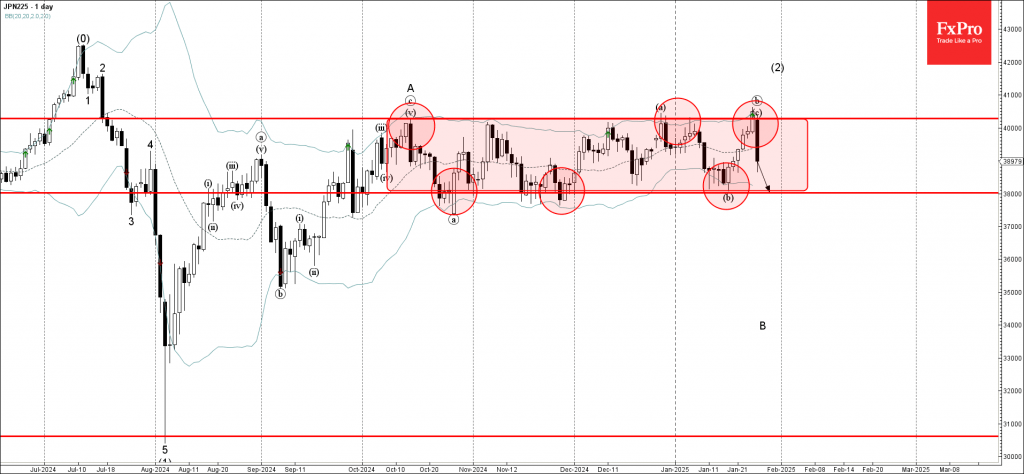
Nikkei 225 Wave Analysis
- Nikkei 225 fall inside sideways price range
- Likely to fall to support level 38025.00
Nikkei 225 index recently reversed down from the strong resistance level 40285.00 (upper border of the tight sideways price range inside which the pair has been moving since October) standing close to the upper daily Bollinger Band.
The downward reversal from the resistance level 40285.00 stopped the previous minor wave c, which started earlier from the lower border of this price range 38025.00.
Nikkei 225 index can be expected to fall to the next support level 38025.00 – from where the index is likely to correct up.
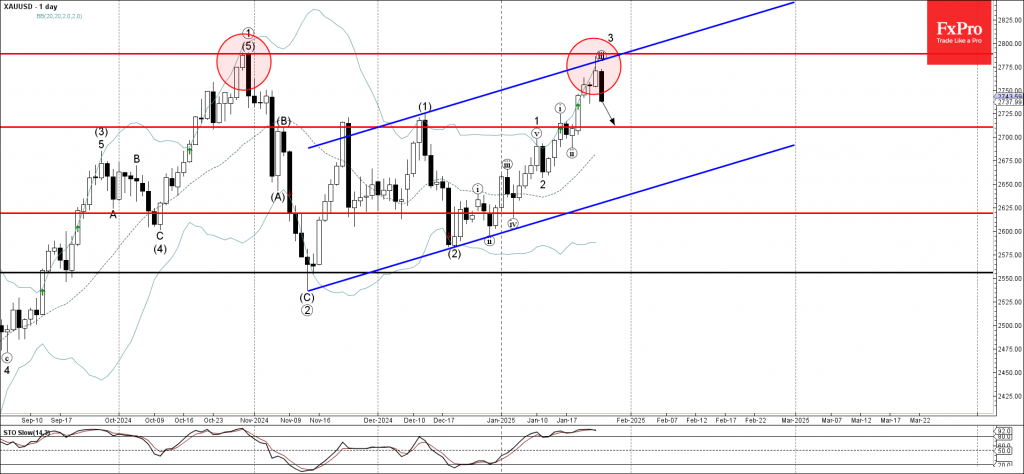
Gold Wave Analysis
- Gold reversed from resistance zone
- Likely to fall to support level 2711.00
Gold recently reversed down from the resistance zone between the key resistance level 2789.00 (former multi-month high from October), resistance trendline of the daily up channel from November and the upper daily Bollinger Band.
The downward reversal from this resistance zone will likely form the daily Japanese candlesticks reversal pattern Bearish Engulfing (strong sell signal for Gold), if the price closes today near the current levels.
Given the strength of the resistance level 2789.00 and the overbought daily Stochastic, Gold can be expected to fall to the next support level 2711.00.
DeepSeek vs. US Tech Giants: The Battle for AI Supremacy and Its Market Impact
- DeepSeek, a Chinese AI startup, has launched a new open-source AI model that is reportedly as good as top chatbots but significantly cheaper.
- This news triggered a selloff in US tech stocks, with Nvidia and other chipmakers experiencing significant drops.
- Despite the market reaction, it’s too early to determine if DeepSeek will be the new AI leader.
- Nasdaq 100 has rebounded, maintaining its bullish structure.
Global markets have started a busy week with a lot of volatility as the little-known Chinese artificial intelligence model called ‘DeepSeek’ sparked a selloff in AI-related shares, with megacap stocks including Nvidia the worst hit.
Chinese startup DeepSeek has launched a free assistant that uses cheaper chips and less data. This move seems to challenge the common belief in financial markets that AI will boost demand for everything from chipmakers to data centers. A bubble waiting to burst or is that a premature assumption? Let us take a look.
What is DeepSeek?
DeepSeek Artificial Intelligence Co., Ltd., started in 2023, is quickly becoming important in the world of AI. Based in China, DeepSeek focuses on pushing AI research forward. Their big goal is to create Artificial General Intelligence (AGI), which is AI that can understand, learn, and do tasks like a human in many different areas. Even though they’re just starting out, DeepSeek’s fast progress shows they’re serious about influencing the future of smart systems.
Origins and Mission
DeepSeek was founded during a pivotal time for AI, as breakthroughs in generative AI models like ChatGPT sparked global interest in advanced machine learning. Although the founders are not widely named, they reportedly include experienced professionals from China’s tech industry and academia, bringing together skills in AI research, software engineering, and strategic innovation. Their goal for DeepSeek is to move beyond the limits of narrow AI systems, which are great at specific tasks, by creating AGI that can generalize knowledge and adapt to new challenges.
The name “DeepSeek” means “deep exploration” or “in-depth pursuit,” highlighting its focus on foundational research and innovative applications. This mission aligns with China’s national strategy to lead in AI innovation, as outlined in initiatives like the Next Generation Artificial Intelligence Development Plan.
Technological Focus and Early Developments
DeepSeek focuses on several key areas in AI development:
AGI Research: DeepSeek works on technologies like large language models, reinforcement learning, and multimodal AI to create models that can think, be creative, and understand context.
Industry Applications: Besides AGI, DeepSeek makes useful AI tools for healthcare, finance, education, and self-driving systems. Their tools are being tested for things like medical diagnosis and personalized learning.
Ethical AI: DeepSeek focuses on ethical rules and safety measures to make sure AI is developed responsibly, following global standards.
Leadership and Shareholders
DeepSeek’s leadership team includes AI researchers, engineers, and executives with backgrounds in top Chinese tech companies and universities. The company hasn’t revealed its shareholders, but it’s probably supported by private investors, venture capital, and partners who share China’s AI goals. It’s possible, though not confirmed, that state-affiliated groups are involved, given the importance of AGI.
DeepSeek and its Open Source Model
Like its Western competitors Chat-GPT, Meta’s Llama, and Claude, DeepSeek uses a large-language model, which means it trains on huge amounts of text to understand everyday language.
However, unlike Silicon Valley companies that keep their models private, DeepSeek is open source. This means anyone can access its code, see how it works, and even change it.
Jim Fan, a senior research manager at Nvidia, said on X that DeepSeek is keeping the original mission of OpenAI alive by being truly open and empowering everyone.
DeepSeek claims it is the best among open-source models and competes with the most advanced closed-source models worldwide.
What Impact has DeepSeek Had on US Equities and Indices?
Over the weekend, DeepSeek created a buzz as tech analysts said the company’s AI model is better than the world’s top chatbots and costs only a tenth as much.
This saw the app surpass ChatGPT to become the No.1 app on the US app store. Released on January 20, 2025, DeepSeek gained popularity quickly thanks to countless threads on social media as well as its quality and price point.
All of these factors set DeepSeek apart from its peers.
Big Tech Rattled by DeepSeek as the Nasdaq fell 5% pre-market trading. Markets are concerned that a cheaper Chinese model could have a massive impact on US tech dominance.
According to DeepSeek, the company only spent around $5.6 million in developing their model, which is a pittance when compared to what US tech giants have poured into AI development and infrastructure.
This was reflected in companies such as NVIDIA which was down as much as 12% in pre-market trading stretching to 17% at the time of writing (four-month low). Other chipmakers such as Broadcom were down as much as 11%.
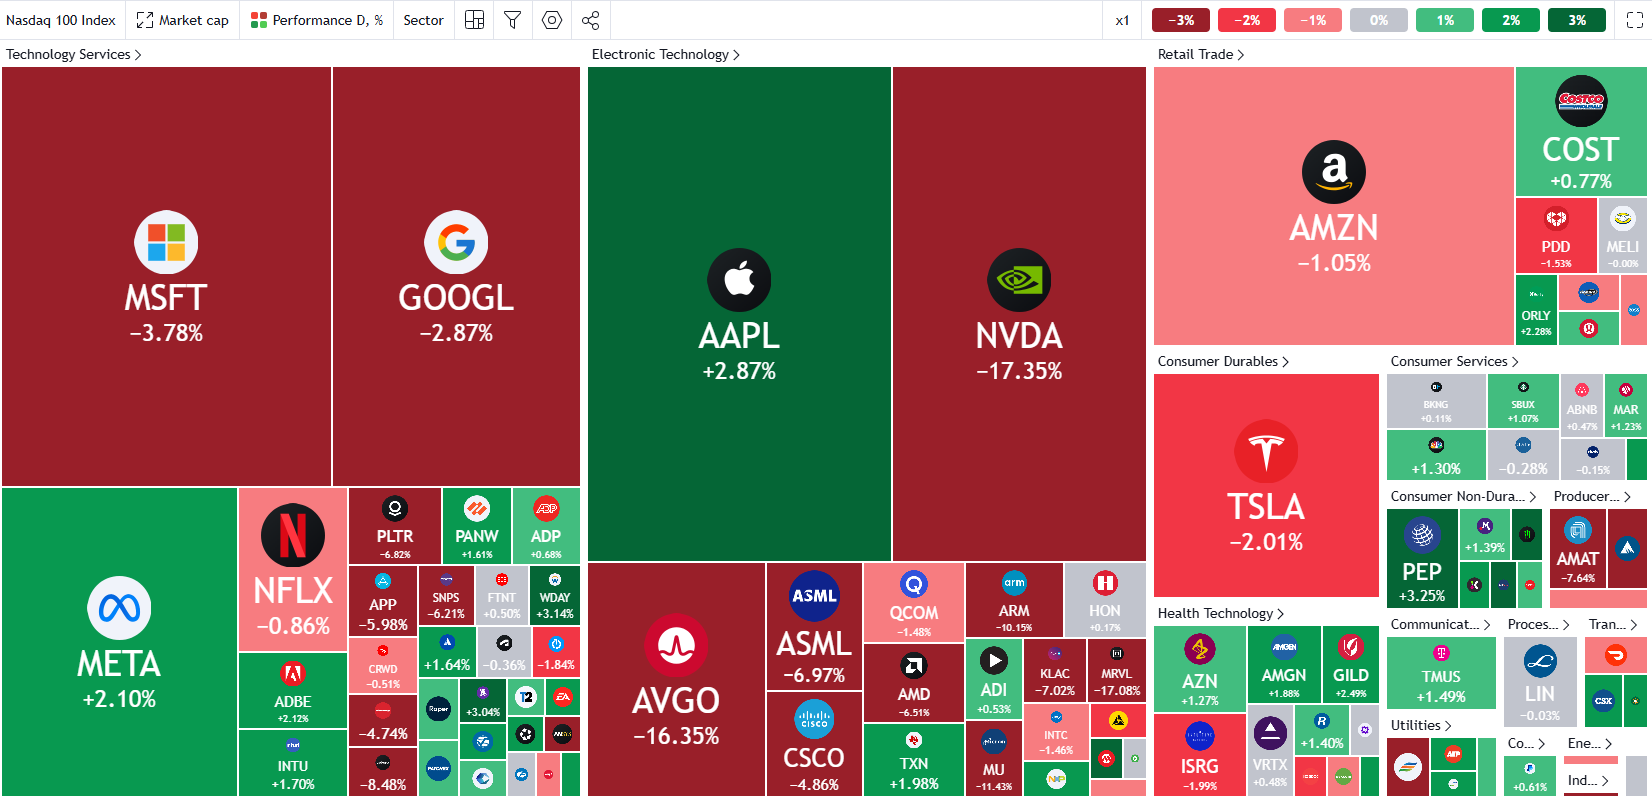
Source: TradingView (click to enlarge)
Another company that felt the sting was Japanese firm SoftBank, which is part of President Donald Trump’s AI investment drive. It was also down around 8% on Monday.
As much as we are seeing blood in the water today, this may be a knee-jerk reaction. It is still too early to declare DeepSeek as the new leader in the AI race but as one analyst put it, it certainly is a wake up call to America.
Technical Analysis – Nasdaq 100
From a technical standpoint, the Nasdaq 100 has recovered some of its pre-market losses having traded at a low of around 20660.
The Index also gapped down, so if you are taking the gap into account from Friday’s close, The Nasdaq 100 was down by as much as +- 7.5% at its lowest point.
The index appears to have found support of the 100-day MA and up about 500 points since. The bullish structure still remains intact without a daily candle close below the 20756 handle.
This does not mean that a daily candle close above this level means bulls will take charge once more but does leave the door open for a more sustained recovery and a push on toward fresh highs.
This week will bring US earnings as well, with Microsoft, Meta, Tesla and Apple due to announce their fourth-quarter earnings this week. Could this prove to be the catalyst to arrest this early week slump?
Nasdaq 100 Daily Chart, January 27, 2025
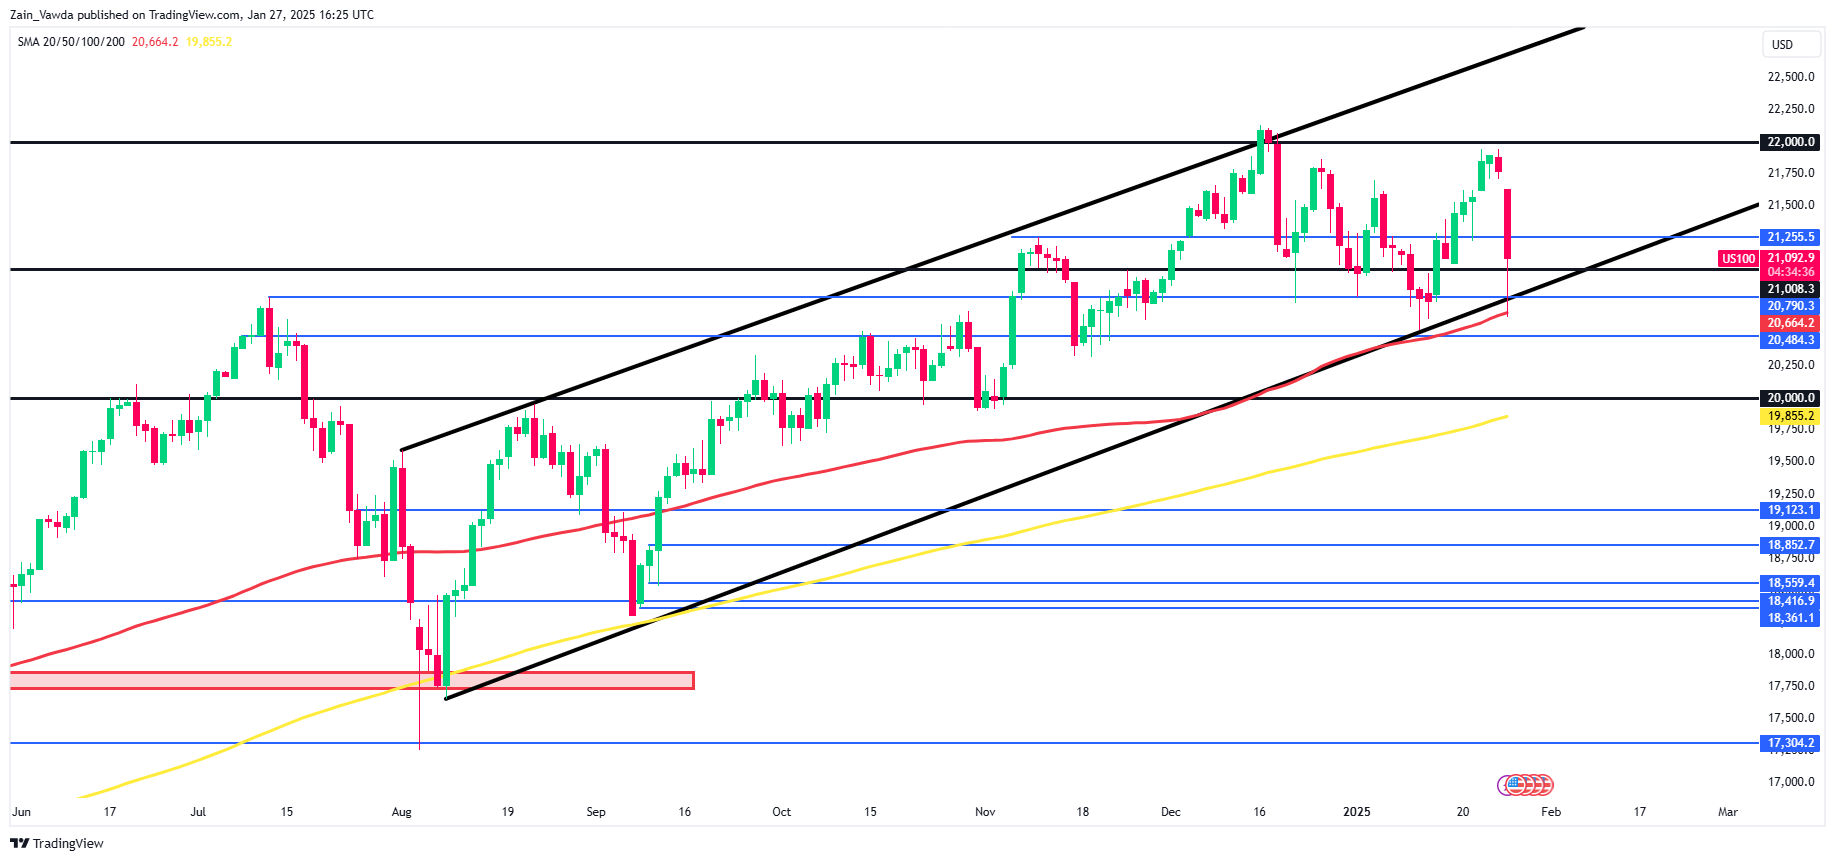
Source: TradingView (click to enlarge)
Support
- 21000
- 20795
- 20664 (100-day MA)
Resistance
- 21255
- 21637
- 22000
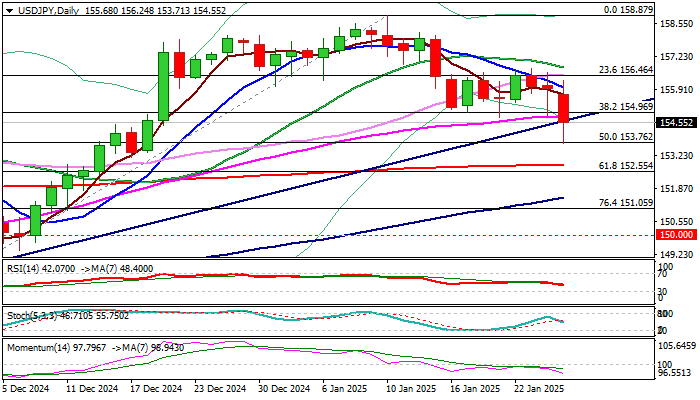
USDJPY: Fresh Acceleration Lower Cracks Important Supports
USDJPY edged higher after fresh acceleration lower in European session on Monday, hit new multi-week low.
Bears found footstep at 50% retracement of 148.64/158.87 upleg, but upside is likely to be limited, as broken supports at 154.96/76 (Fibo 38.2% / 55DMA) and 154.80 (bull-trendline) reverted to strong resistances.
Daily close below these levels to verify fresh bearish signal (also generated on break of the base of multi-day range.
Weaker technical picture on daily chart (14-d momentum falling deeper into negative territory / Tenkan/Kijun-sen bear cross) support bearish near-term outlook.
Close below trendline is seen as minimum requirement to keep bears in play for renewed attack at 151.71 (session low / Fibo 50%), violation of which to expose targets at 152.81/55 (200DMA / Fibo 61.8%).
Alternatively, bounce and close above 155.00 zone would sideline immediate bears and signal possible false break lower (formation of bear-trap).
Res: 154.96; 155.98; 156.46; 156.79
Sup: 153.71; 153.16; 152.81; 152.55
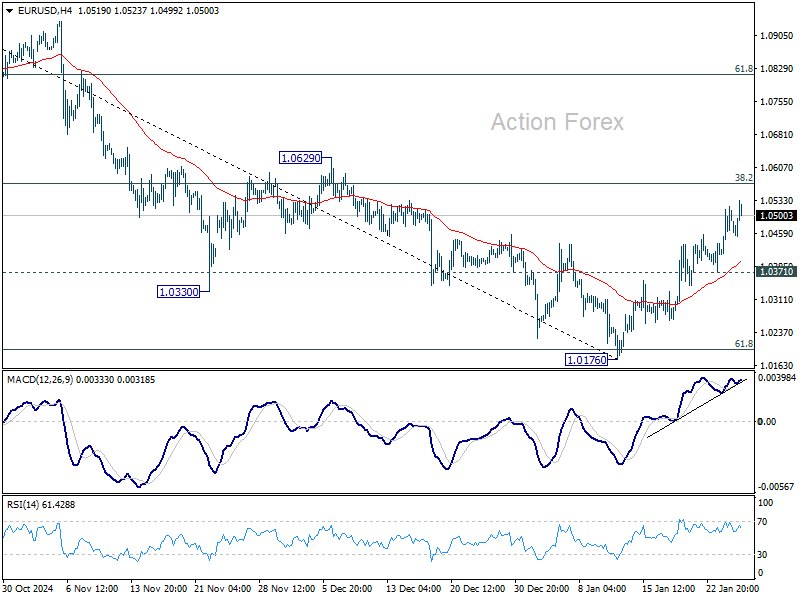
EUR/USD: Recovery Holds Grip, But Fed/ECB Policy Divergence May Obstruct Bulls
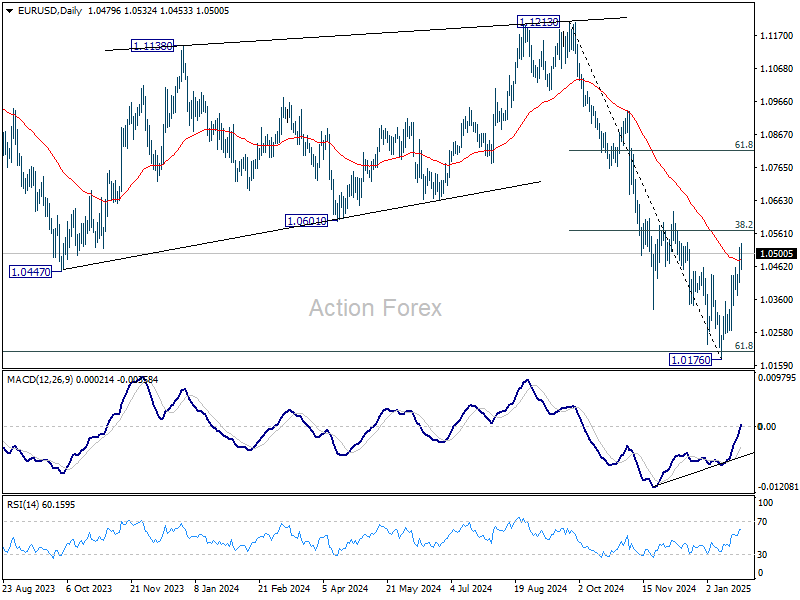
EUR/USD regained traction after overnight’s drop and rose above 1.05 handle, penetrating falling daily cloud (spanned between 1.0490 and 1.0664), after better than expected German January Ifo report boosted the sentiment.
Bulls look to resume recovery from Jan 13 low (1.0177) after reversal pattern has been completed on weekly chart (the pair was up 2.1% last week, in the biggest weekly advance since the second week of July 2023).
The action is underpinned by positive daily studies (daily Tenkan/Kijun-sen are converging after formation of bull-cross / strong positive momentum) with extension above Fibo barrier at 1.0573 (38.2% of 1.1214/1.0177) needed to verify signal and open way towards upper triggers at 1.0629/56 (Dec 6 lower top / cloud top).
However, recovery may face increased headwinds and risk of stall due to divergence of Fed and ECB monetary policies, as the US central bank is widely expected to stay on hold on policy meeting on Wednesday, while the ECB’s rate cut on Thursday is fully priced.
Also, dynamics of policy easing remains in favor on the ECB which is expected to cut by 75 basis points until June while Fed is seen easing policy by 50 basis points in 2025, although the first cut might be delayed and occur after June.
Res: 1.0534; 1.0573; 1.0629; 1.0656.
Sup: 1.0490; 1.0454; 1.0422; 1.0396.
Sunset Market Commentary
Markets
Not the start and the first measures from the Trump 2.0 administration nor a big eco data surprise and the anticipated central bank reaction, but a Chinese artificial intelligence start-up (DeepSeek) triggered the first big volatility moment of 2025. The AI language learning model of the Chinese company is said to provide high profile results comparable to its American competitors at a much lower price. It also questions the viability of massive capital investments in high-end chips and extensive computing power. This also questions elevated valuations for multiple companies working in the IT supply chain. European equities and US equity futures nosedived this morning.
The Nasdaq future at some point lost > 5.0%, but pressure eased slightly as US investors entered the fray. Even so, volatility remains elevated. The Nasdaq and the S&P 500 currently lose 3.0% and 1.75% respectively. The EuroStoxx 50 currently declines 0.75 %. For indices of several EU member states, declines remain limited (e.g. MIB +/- unchanged). The (predominantly US driven) equity sell-off also spilled over the other markets. US Treasuries serve as a preferred safe haven. US yields are off the intraday lows, but are still ceding between 7.0 bps (2-y) and 9 bps (5-y) in volatile trading. Declines in EMU yields are less pronounced with German yields ceding about 3-4 bps across the curve. German IFO business climate showed a mixed picture. The headline index improved (85.1 from 84.7) on an improvement in the current assessment, but German companies even gain turn more pessimistic on future expectations. The tone of the report after feels a bit disappointing after Friday’s PMIs. Despite the overall market turmoil, oil hardly declines further after a substantial correction since mid this month. Brent holds near $78 p/b).
On FX markets, the risk-off narrative is a bit less straightforward as is the case in equity and FI markets. With potential impact of the DeepSeek developments mainly questioning US AI/tech dominance, the dollar isn’t able to take up its traditional safe haven function. The yen outperforms among the majors with USD/JPY falling from an 156 close on Friday to currently trade near 154.2. In Europe, the Swiss franc stages a comeback after last week’s setback (EUR/CHF 0.945 from 0.951). Even the single currency reversed earlier intraday losses with EUR/USD rebounding from the 1.046 area to currently trade near 1.052 on broader USD selling. The impact of the US-instigated risk-off on smaller currencies also remains rather modest. EUR/GBP trades little changed in the 0.841 area. The Aussie dollar underperforms, both against the dollar (0.63) and the euro (EUR/AUD 1.672). The likes of the NOK and the SEK also incur modest losses against the euro, but are holding with recent ranges. A similar pattern also develops from CE currencies even as the damage remains fairly limited (EUR/CZK 25.10, EUR/HUF 409.0, EUR/PLN 4.22).
News & Views
More members of the National Bank of Poland’s monetary committee break with governor Glapinski’s (solo?) view that rate cuts will only be something for 2026. MPC Duda referred to room to cut the policy rate by the end of the year with Janczyk putting the option on the table as well. That makes at least 5 out of 9 members not ruling out a H2 2025 move. The July inflation report, coming after presidential elections and by that time presenting a more precise impact on fiscal policy (energy subsidies) on the path of inflation, seems to be the one to start readying a discussion on the topic. Rate cuts, if any, should remain small in size according to Duda (25 bps steps). EUR/PLN rebounds in today’s tough risk climate but preserves last week’s technical break below EUR/PLN 4.25 support.
EU foreign ministers agreed to extend again the sanctions on Russia. They have to do so every six months. EU foreign policy chief Kallas said that this way it will continue to deprive Moscow from revenues to finance its war. The deal came after Hungarian prime minister Orban lifted his opposition in place since December. He wanted to wait the inauguration (and reaction function) of Donald Trump together with getting several energy assurances. The EC will continue discussions with Ukraine on the supply to Europe through the gas pipeline system and is willing to associate Hungary and Slovakia in the process.
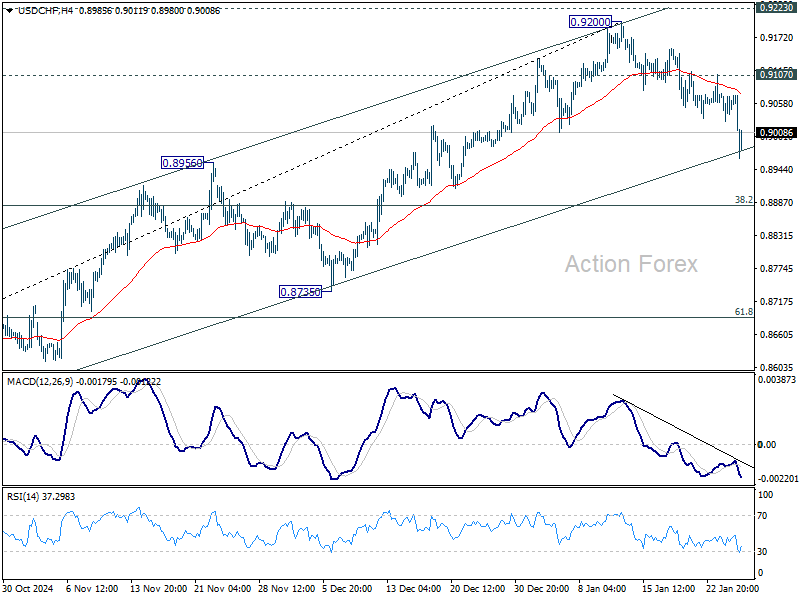
USD/CHF Mid-Day Outlook
Daily Pivots: (S1) 0.9030; (P) 0.9058; (R1) 0.9087; More…
Intraday bias in USD/CHF remains on the downside as fall from 0.9200 short term top is in progress. Sustained break of 55 D EMA (now at 0.8959) will target 38.2% retracement of 0.8374 to 0.9200 at 0.8884 next. Firm break of 0.8884 will indicate bearish reversal. Nevertheless, break of 0.9107 will retain near term bullishness, and turn bias back to the upside for retesting 0.9200 high.
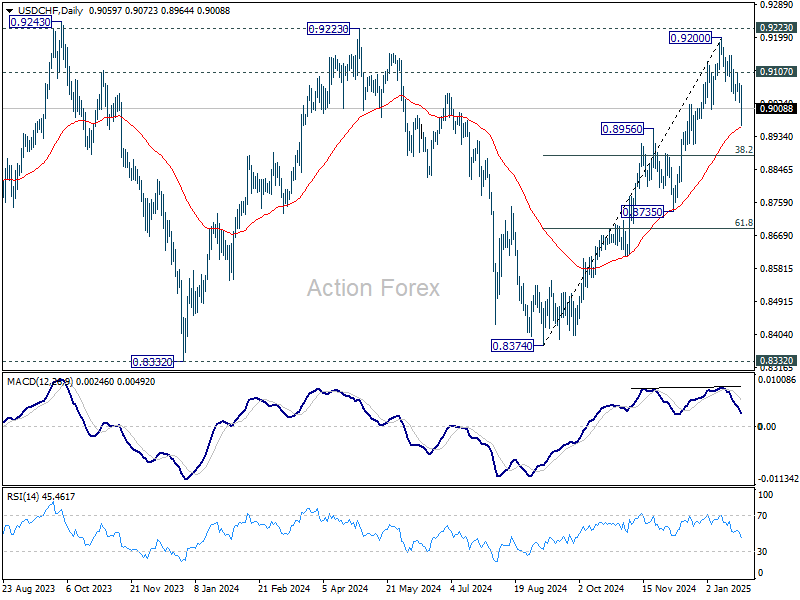
In the bigger picture, as long as 0.9223 resistance holds, price actions from 0.8332 (2023 low) are seen as a medium term corrective pattern. That is, long term down trend is in favor to resume through 0.8332 at a later stage. However, sustained break of 0.9223 will be an important sign of bullish trend reversal.
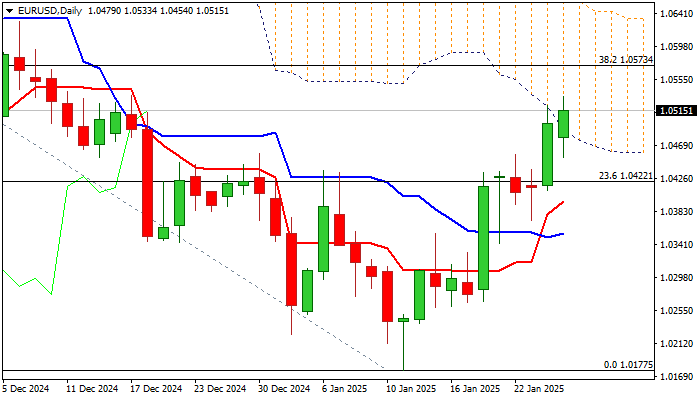
EUR/USD Mid-Day Outlook
Daily Pivots: (S1) 1.0431; (P) 1.0476; (R1) 1.0541; More...
EUR/USD's rebound from 1.0176 short term bottom is in progress and intraday bias stays on the upside for 38.2% retracement of 1.1213 to 1.0176 at 1.0572. Decisive break there will raise the chance of bullish reversal, and target 61.8% retracement at 1.0817. Nevertheless, rejection by 1.0572 will maintain near term bearishness. Break of 1.0371 minor support will bring retest of 1.0176 low.
In the bigger picture, outlook is mixed as fall from 1.1274 (2023 high) could either be the second leg of the corrective pattern from 0.9534 (2022 low), or another down leg of the long term down trend. Strong support from 61.8 retracement of 0.9534 to 1.1274 at 1.0199 will favor the former case, and sustained break of 55 W EMA (now at 1.0722) will argue that the third leg might have started. However, sustained trading below 1.0199 will favor the latter case and bring retest of 0.9534 low.