
Sample Category Title
EUR/GBP Daily Outlook
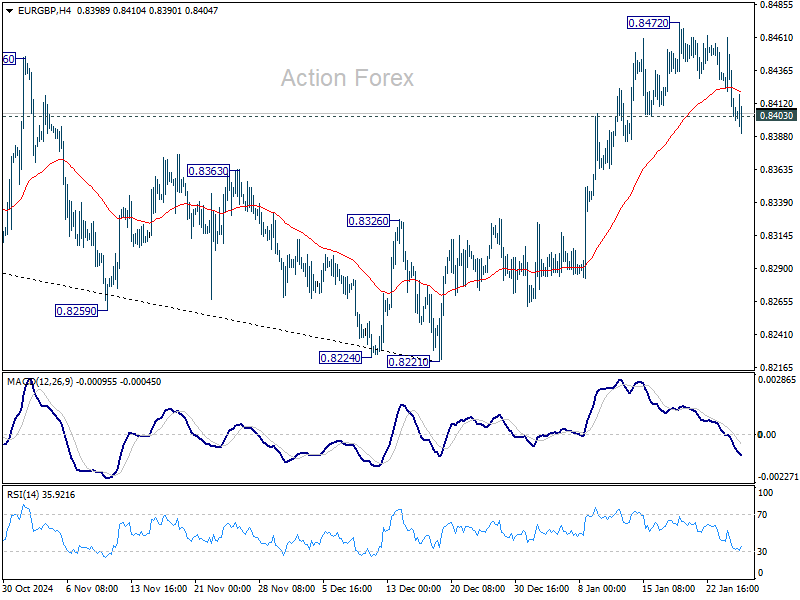
Daily Pivots: (S1) 0.8388; (P) 0.8425; (R1) 0.8447; More...
Focus remains on 0.8403 support in EUR/GBP. Sustained break there will confirm short term topping at 0.8472, and bring deeper pullback to 55 D EMA (now at 0.8350). On the upside, though, break of 0.8472 will resume the rally from 0.8221 to 0.8624 key cluster resistance zone next.
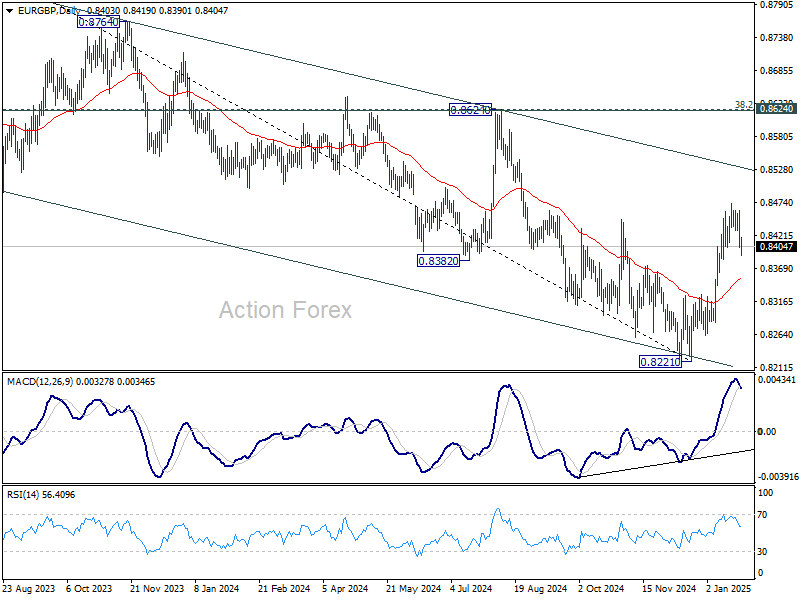
In the bigger picture, a medium term bottom should be in place at 0.8221, just ahead of 0.8201 key support (2022 low). Sustained trading above 55 W EMA (now at 0.8442) will pave the way to 0.8624 cluster zone (38.2% retracement of 0.9267 to 0.8221 at 0.8621), even just as a correction to the down trend from 0.9267 (2022 high). But still, medium term outlook will be neutral at best as long as 0.8621/4 holds.
EUR/AUD Daily Outlook
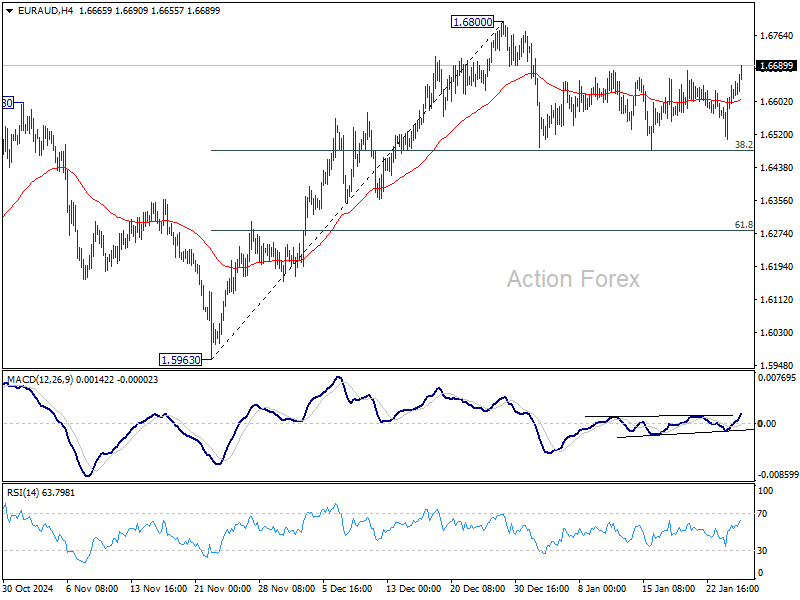
Daily Pivots: (S1) 1.6549; (P) 1.6596; (R1) 1.6674; More...
Intraday bias in EUR/AUD remains neutral as it's staying in range below 1.6800. In case of another dip, strong support is still expected from 38.2% retracement of 1.5963 to 1.6800 at 1.6480 to contain downside. On the upside, firm break of 1.6800 will resume the rally from 1.5963. However, sustained break of 1.6480 will bring deeper correction 61.8% retracement at 1.6283 instead.
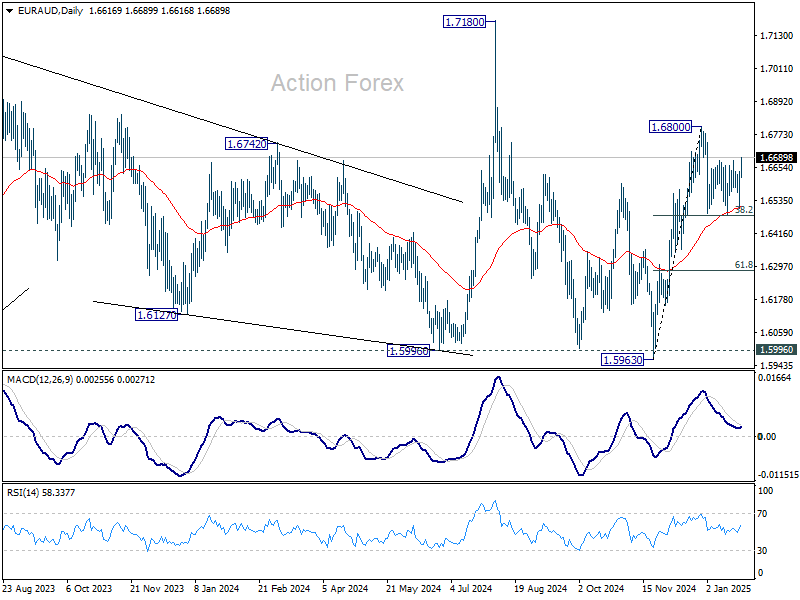
In the bigger picture, EUR/AUD is holding on to 1.5996 key support (2024 low) despite brief breach. Larger up trend from 1.4281 (2022 low) is still in favor to resume through 1.7180 at a later stage. Nevertheless, sustained break of 1.5996 will indicate that such up trend has completed and deeper decline would be seen.
GBP/JPY Daily Outlook
Daily Pivots: (S1) 192.93; (P) 193.88; (R1) 195.67; More...
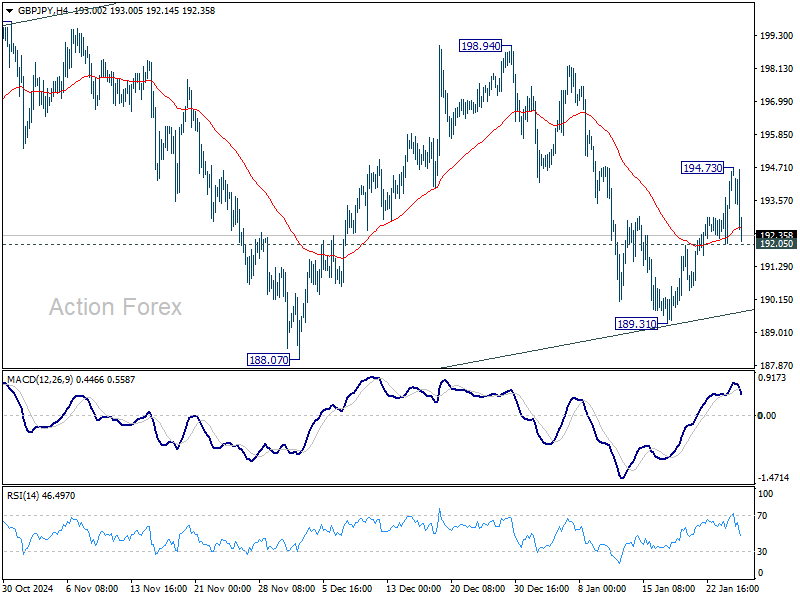
Intraday bias in GBP/JPY is turned neutral again with today's deep retreat. Overall outlook is unchanged that corrective pattern from 180.00 might extend. On the upside above 194.73 will target 198.94/197.79 resistance zone. On the downside, however, break of 192.05 minor support will turn bias back to the downside for 189.31 support instead.
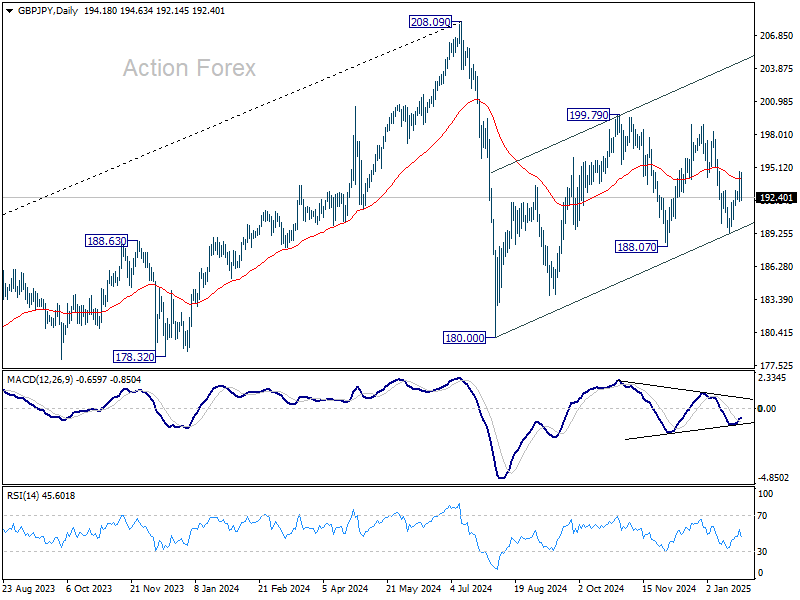
In the bigger picture, price actions from 208.09 are seen as a correction to whole rally from 123.94 (2020 low). The range of consolidation should be set between 38.2% retracement of 123.94 to 208.09 at 175.94 and 208.09. However, decisive break of 175.94 will argue that deeper correction is underway.
EUR/USD Daily Outlook
Daily Pivots: (S1) 1.0431; (P) 1.0476; (R1) 1.0541; More...
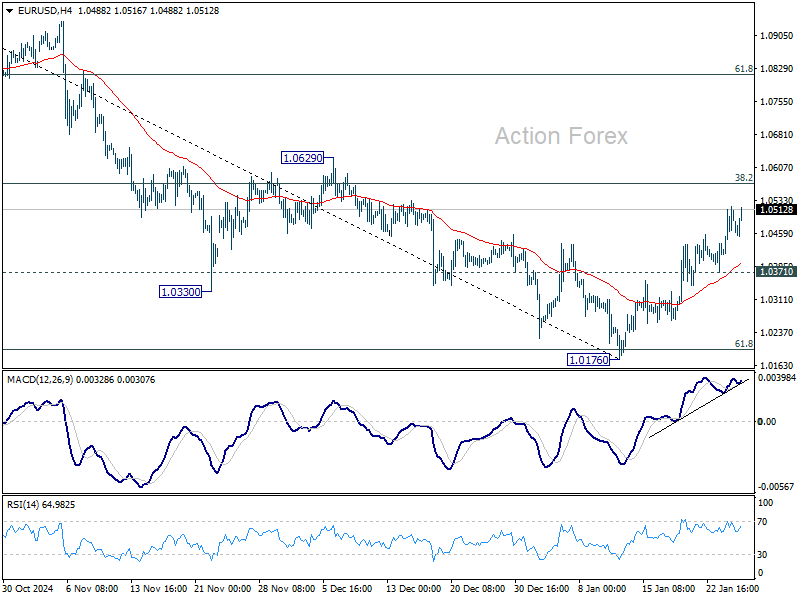
Intraday bias in EUR/USD remains on the upside as rebound from 1.0176 is still in progress. Decisive break of 38.2% retracement of 1.1213 to 1.0176 at 1.0572 will raise the chance of bullish reversal, and target 61.8% retracement at 1.0817. On the downside break of 1.0371 minor support will retain near term bearishness and bring retest of 1.0176 low.
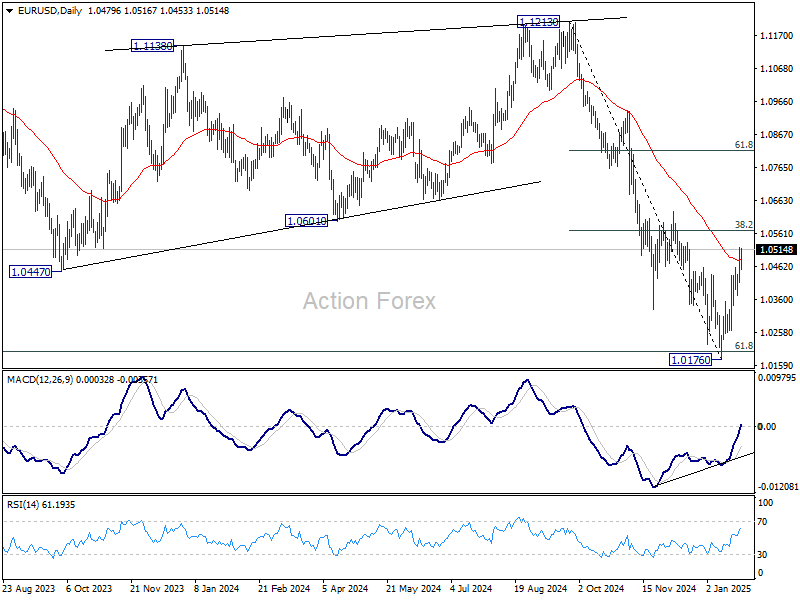
In the bigger picture, outlook is mixed as fall from 1.1274 (2023 high) could either be the second leg of the corrective pattern from 0.9534 (2022 low), or another down leg of the long term down trend. Strong support from 61.8 retracement of 0.9534 to 1.1274 at 1.0199 will favor the former case, and sustained break of 55 W EMA (now at 1.0722) will argue that the third leg might have started. However, sustained trading below 1.0199 will favor the latter case and bring retest of 0.9534 low.
GBP/USD Daily Outlook
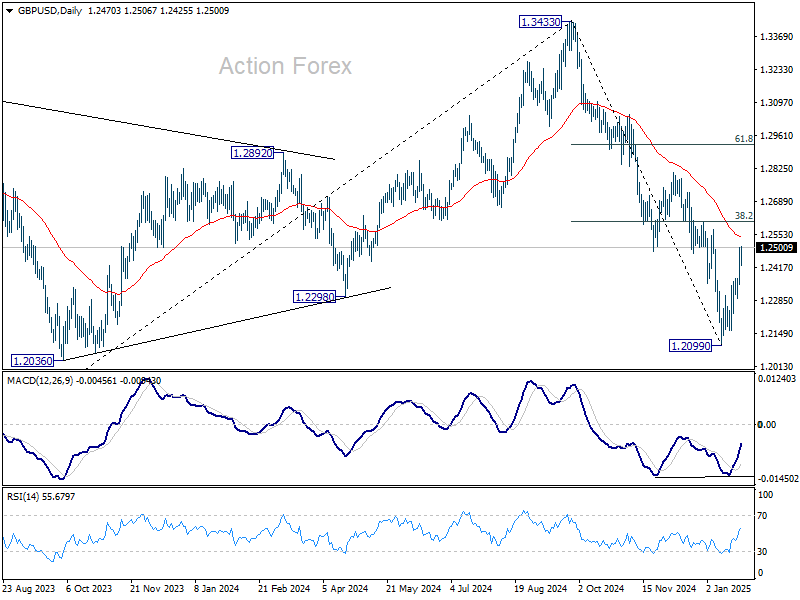
Daily Pivots: (S1) 1.2383; (P) 1.2442; (R1) 1.2543; More...
GBP/USD's rebound from 1.2099 short term bottom continues today and intraday bias stays on the upside. Strong resistance could be seen 38.2% retracement of 1.3433 to 1.2099 at 1.2609, to limit upside. However, sustained trading above 1.2609 will raise the chance of reversal and target 61.8% retracement at 1.2923. On the downside, below 1.2375 minor support will turn intraday bias neutral first.
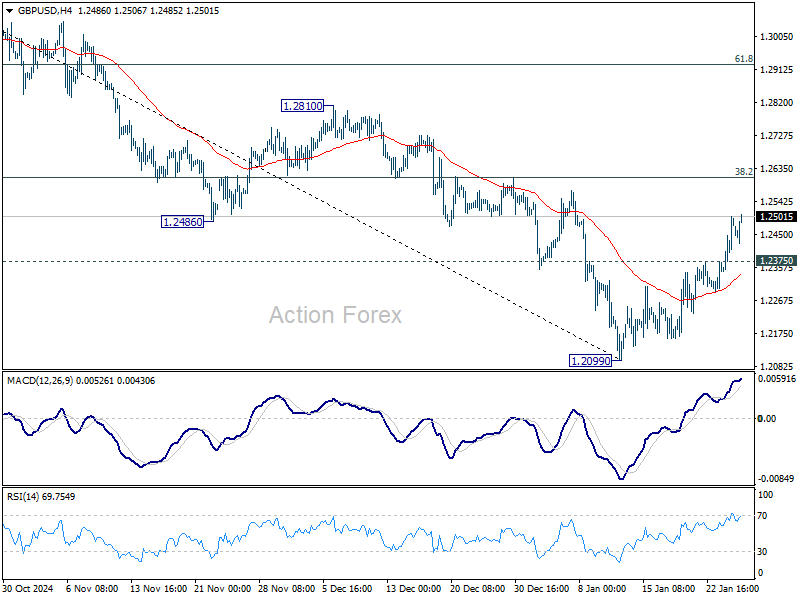
In the bigger picture, rise from 1.0351 (2022 low) should have already completed at 1.3433 (2024 high), and the trend has reversed. Further fall is now expected as long as 1.2810 resistance holds. Deeper decline should be seen to 61.8% retracement of 1.0351 to 1.3433 at 1.1528, even as a corrective move. However, firm break of 1.2810 will dampen this bearish view and bring retest of 1.3433 high instead.
USD/JPY Daily Outlook
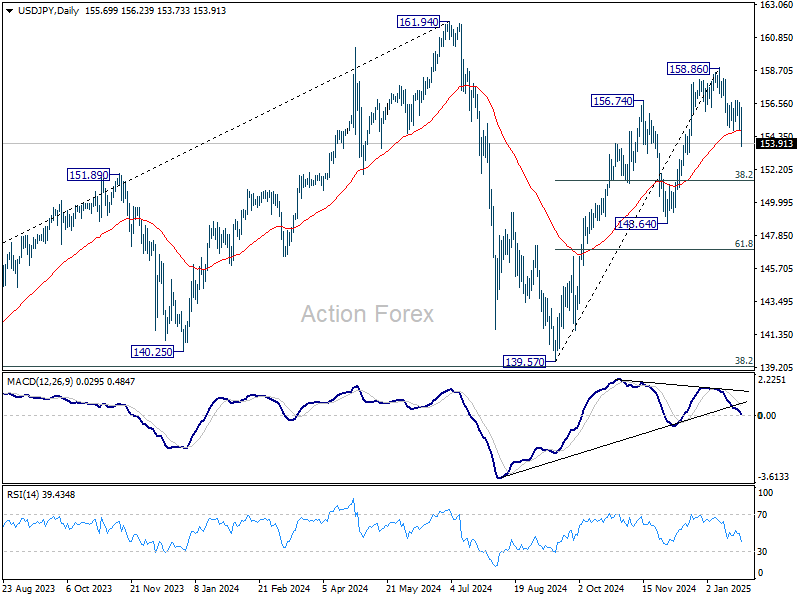
Daily Pivots: (S1) 155.03; (P) 155.81; (R1) 156.77; More...
USD/JPY's fall from 158.86 short term top resumed by breaking through 154.77 today. Intraday bias is back on the downside for 38.2% retracement of 139.57 to 158.86 at 151.49. Sustained break there will suggest that whole rally from 138.57 has completed already. For now, risk will stay on the downside as long as 156.74 resistance holds, in case of recovery.
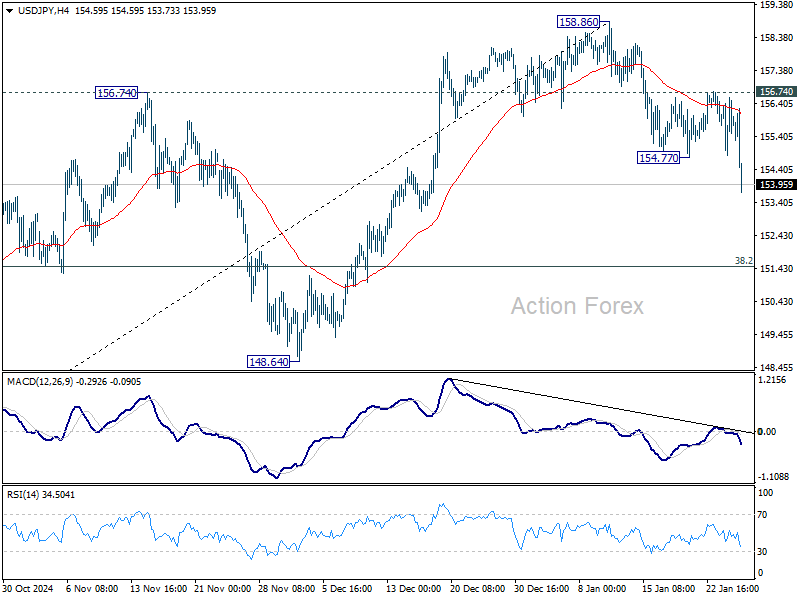
In the bigger picture, price actions from 161.94 are seen as a corrective pattern to rise from 102.58 (2021 low). The range of medium term consolidation should be set between 38.2% retracement of 102.58 to 161.94 at 139.26 and 161.94. Nevertheless, sustained break of 139.26 would open up deeper medium term decline to 61.8% retracement at 125.25.
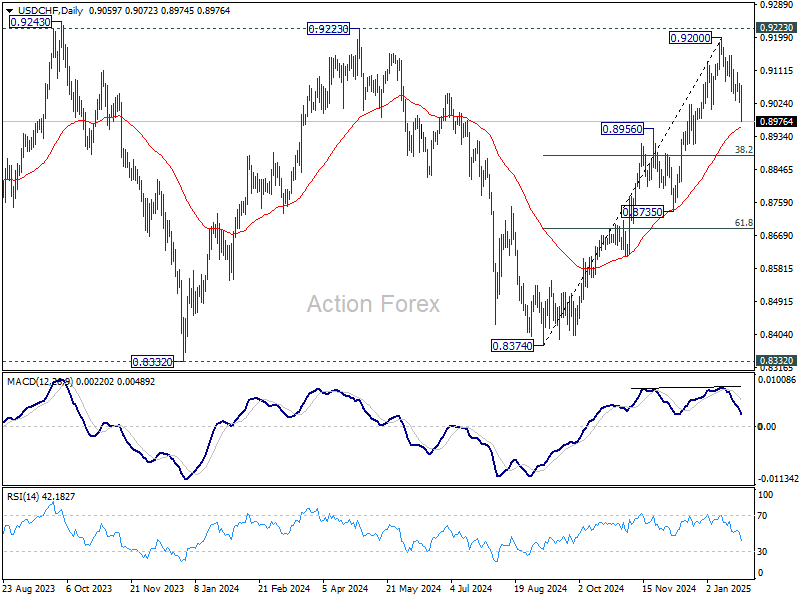
USD/CHF Daily Outlook
Daily Pivots: (S1) 0.9030; (P) 0.9058; (R1) 0.9087; More…
USD/CHF's fall from 0.9200 accelerated lower today and the firm break of 0.9007 support argue that rise from 0.8374 has completed just ahead of 0.9223 key resistance. Intraday bias is back on the downside. Sustained break of 55 D EMA (now at 0.8959) will target 38.2% retracement of 0.8374 to 0.9200 at 0.8884 next. For now, risk will stay on the downside as long as 0.9200 resistance holds, in case of recovery.
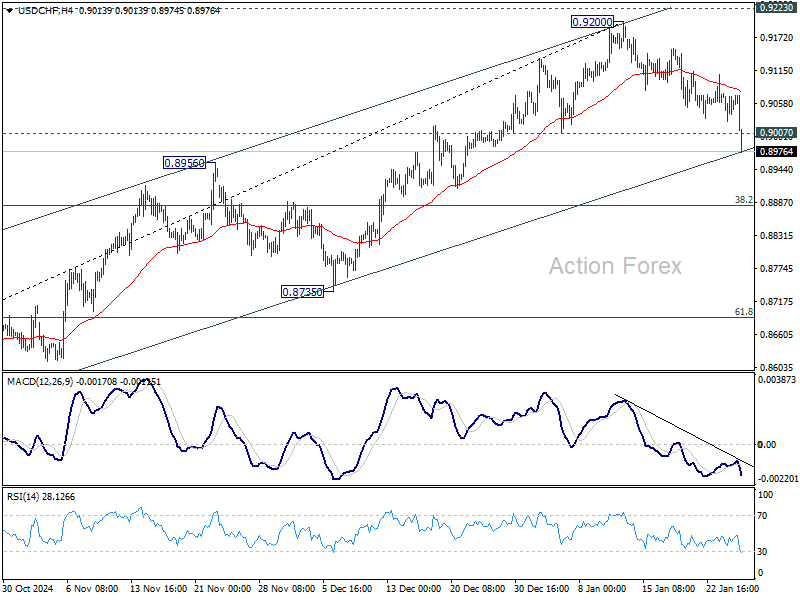
In the bigger picture, as long as 0.9223 resistance holds, price actions from 0.8332 (2023 low) are seen as a medium term corrective pattern. That is, long term down trend is in favor to resume through 0.8332 at a later stage. However, sustained break of 0.9223 will be an important sign of bullish trend reversal.
USD/CAD Daily Outlook
Daily Pivots: (S1) 1.4311; (P) 1.4349; (R1) 1.4382; More...
Intraday bias in USD/CAD remains neutral as sideway trading continues below 1.4516. Further rally is expected as long as 1.4260 support holds. On the upside, firm break of 1.4516 will resume larger up trend to 1.4667/89 key resistance zone. Nevertheless, firm break of 1.4260 will turn bias to the downside for deeper pullback to 55 D EMA (now at 1.4221) and below.

In the bigger picture, up trend from 1.2005 (2021) is in progress for retesting 1.4667/89 key resistance zone (2020/2015 highs). Decisive break there will confirm long term up trend resumption. Next target is 100% projection of 1.2401 to 1.3976 from 1.3418 at 1.4993. Medium term outlook will remain bullish as long as 1.3976 resistance turned holds (2022 high), even in case of deep pullback.

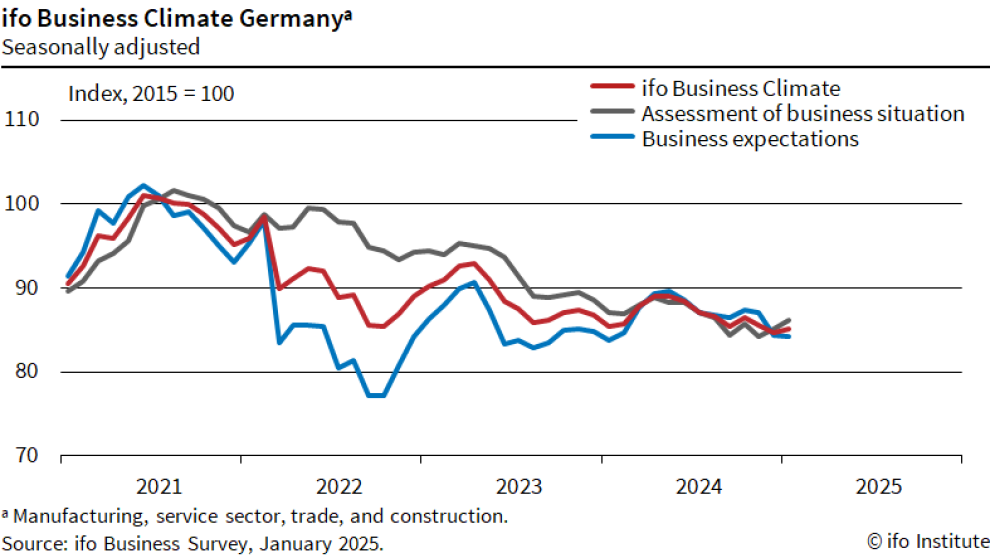
German Ifo rises to 85.1, slightly improvement but still pessimistic
German Ifo Business Climate ticked up from 84.7 to 85.1 in January. Current Situation Index also rose form 85.1 to 86.1. But Expectations Index fell from 84.4 to 84.2.
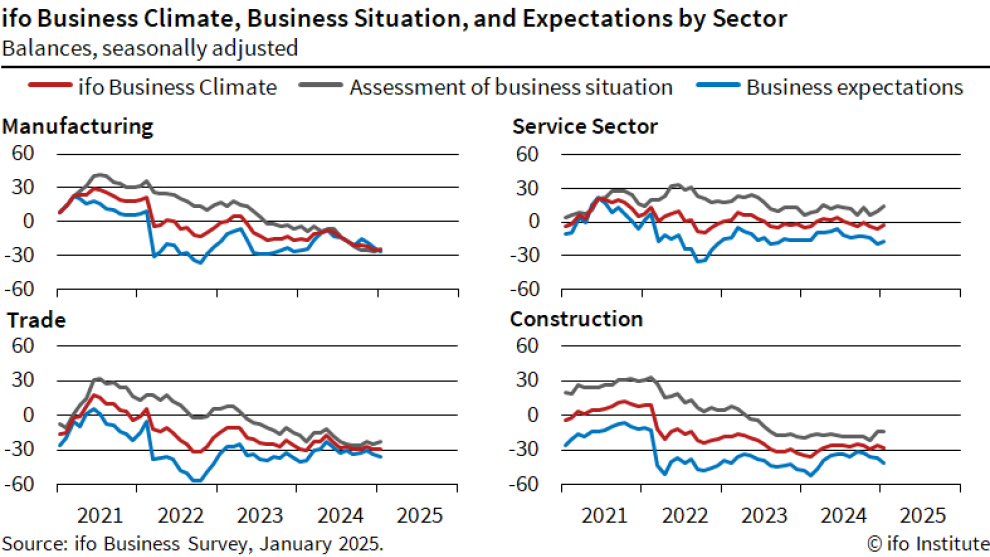
By sector, manufacturing fell from -24.9 to -25.3. Services rose from -5.6 to -2.2. Trade was unchanged at -29.5. Construction dropped notably from -26.2 to -28.2.
Ifo said that despite the slight improvement, "companies continue to be pessimistic".
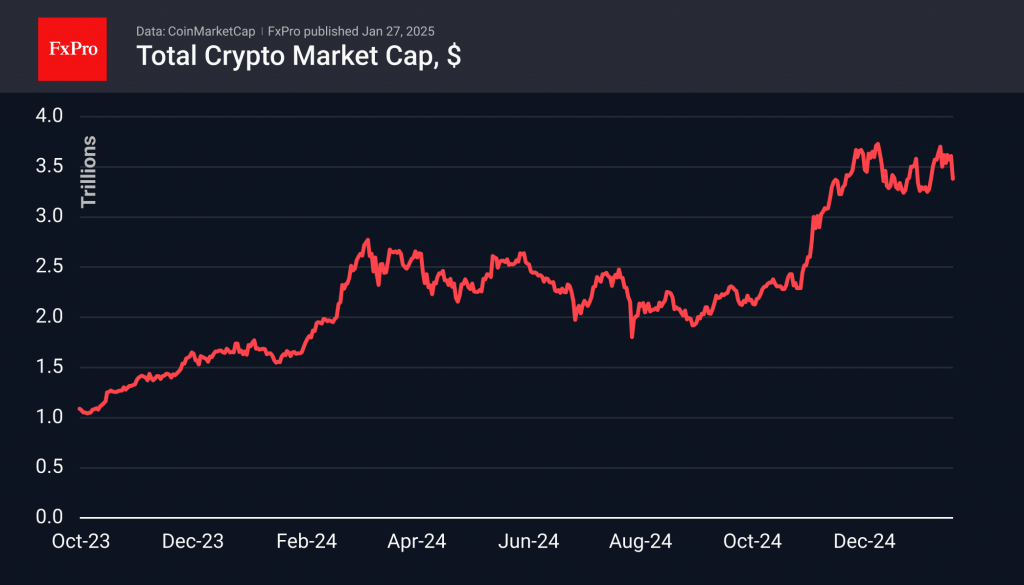
Crypto Market Down 6.5% Amid Concerns Over US AI
Market picture
The cryptocurrency market sometimes exhibits higher volatility compared to the Nasdaq index. On Monday, the cryptocurrency market decreased by 6.5% to reach $3.38 trillion, while the Nasdaq100 was down 2.5%. This was due to the emergence of the startup DeepSleek with its free AI. These concerns were heightened with the anticipation of this week’s Fed meeting and profit-taking following crypto-related orders from President Trump.
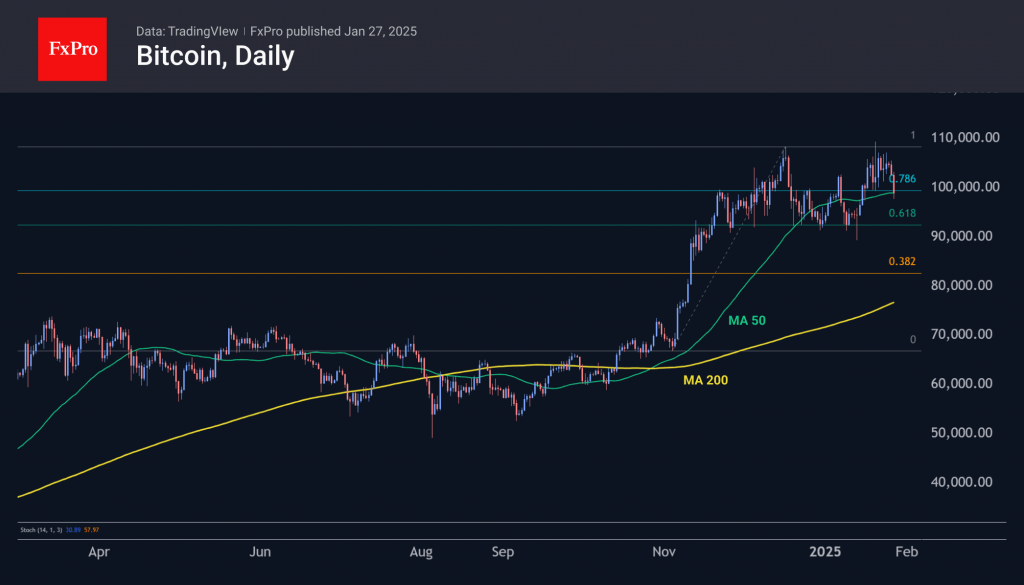
Bitcoin fell 6.5% below $98,000 in early European trading. After spending 10 days above that level, the price is testing its 50-day moving average again. If the market does not see a quick recovery and the sell-off continues, the next key support will be the $93,000 area—the lower end of the trading range of the last nine weeks and 61.8% of the rally since early November.
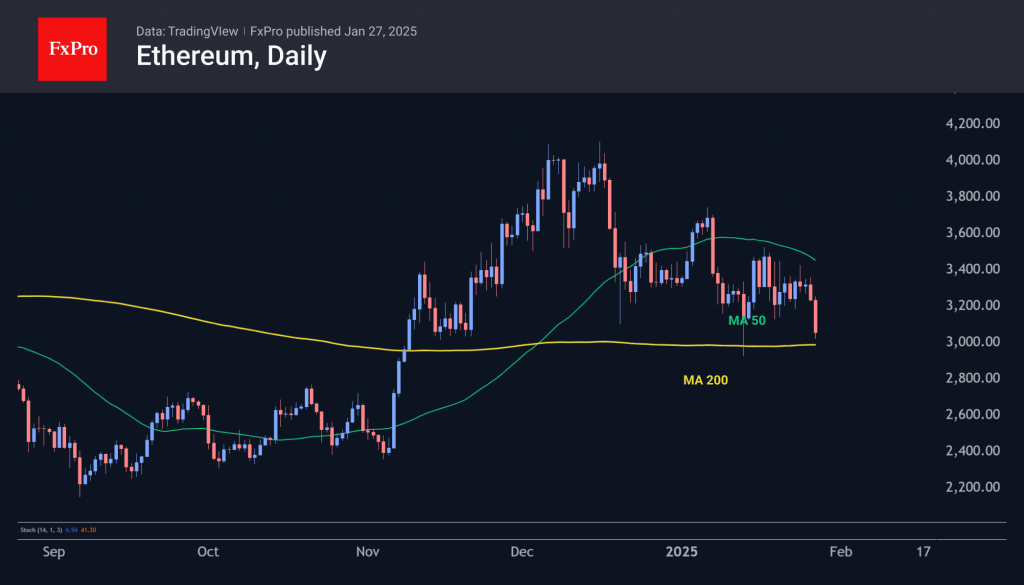
Ethereum has also been affected by the sell-off, falling to $3000 — the area of lows since November, and temporarily touching the 200-day moving average on Monday. A fall below this level would signal a potential trend change to bearish.
News background
According to SoSoValue, inflows into spot bitcoin ETFs in the US totalled $1.76 billion last week, compared to $1.96 billion a week earlier, bringing total inflows into these products to $39.94 billion.
Inflows into spot Ethereum-ETFs in the US totalled $139.3 million last week after $212 million a week earlier. Cumulative net inflows since the ETF’s launch in July rose to $2.80 billion.
Since Trump’s election, large investors have been backing Bitcoin, CryptoQuant noted. The Bitcoin holdings of large participants rose from 16.2 million BTC to 16.4 million BTC, while small participants reduced their holdings from 1.75 million BTC to 1.69 million BTC. Experienced investors avoided selling despite the high volatility.
The US SEC has cancelled the SAB 121 rule, which effectively banned banks from holding cryptocurrencies. This was Commissioner Hester Pearce’s first initiative since her appointment as head of the regulator’s Digital Asset Task Force.
The Nasdaq exchange has applied on behalf of BlackRock to change the structure of the iShares Bitcoin Trust (IBIT) to allow in-kind redemptions. This will enable investors to withdraw their funds in bitcoin, increasing the attractiveness of this ETF, Bloomberg notes.
Pierre Rochard, vice president of research at Riot Platforms, said Ripple is a significant obstacle to creating a strategic cryptocurrency reserve in the United States. He believes the fintech company is interested in promoting CBDCs designed to run on its infrastructure.
The ecosystem developers reported that 36.2 million cryptocurrency wallets were created on the TON network in 2024 — 55 times more than the previous year. The total number of Toncoin holders exceeded 100 million.