
Sample Category Title
FOMC, ECB Rate Decisions Amid Tariff Threats: Market Analysis & Technical Outlook
- FOMC Rate Decision: Market expectations for a rate cut are low due to concerns about slower disinflation and tariff impacts. Traders will watch for Jerome Powell’s comments on tariffs and inflation.
- ECB Rate Decision: A rate cut is widely expected, with concerns about potential US tariffs on the EU weighing on the Euro.
- Tariff Threats and Market Uncertainty: Markets are volatile due to uncertainty surrounding potential US tariffs on Canada, Mexico, China, and the EU.
- EUR/USD Technical Analysis: The Euro is finding support after a recent decline, but faces resistance at higher levels.
- USD/JPY Technical Analysis: The US dollar has been volatile against the Yen, with a potential double top formation on the weekly chart.
This week, we have three of the world’s most significant central bank’s interest rate and monetary policy decisions: the Federal Reserve, the European Central Bank, and the Bank of Canada. The central bank’s decisions follow President Trump’s executive orders and additional tariff threats to Canada, Mexico, China, and other countries.
FOMC Rate Decision and Market Expectations Amid Tariff Concerns
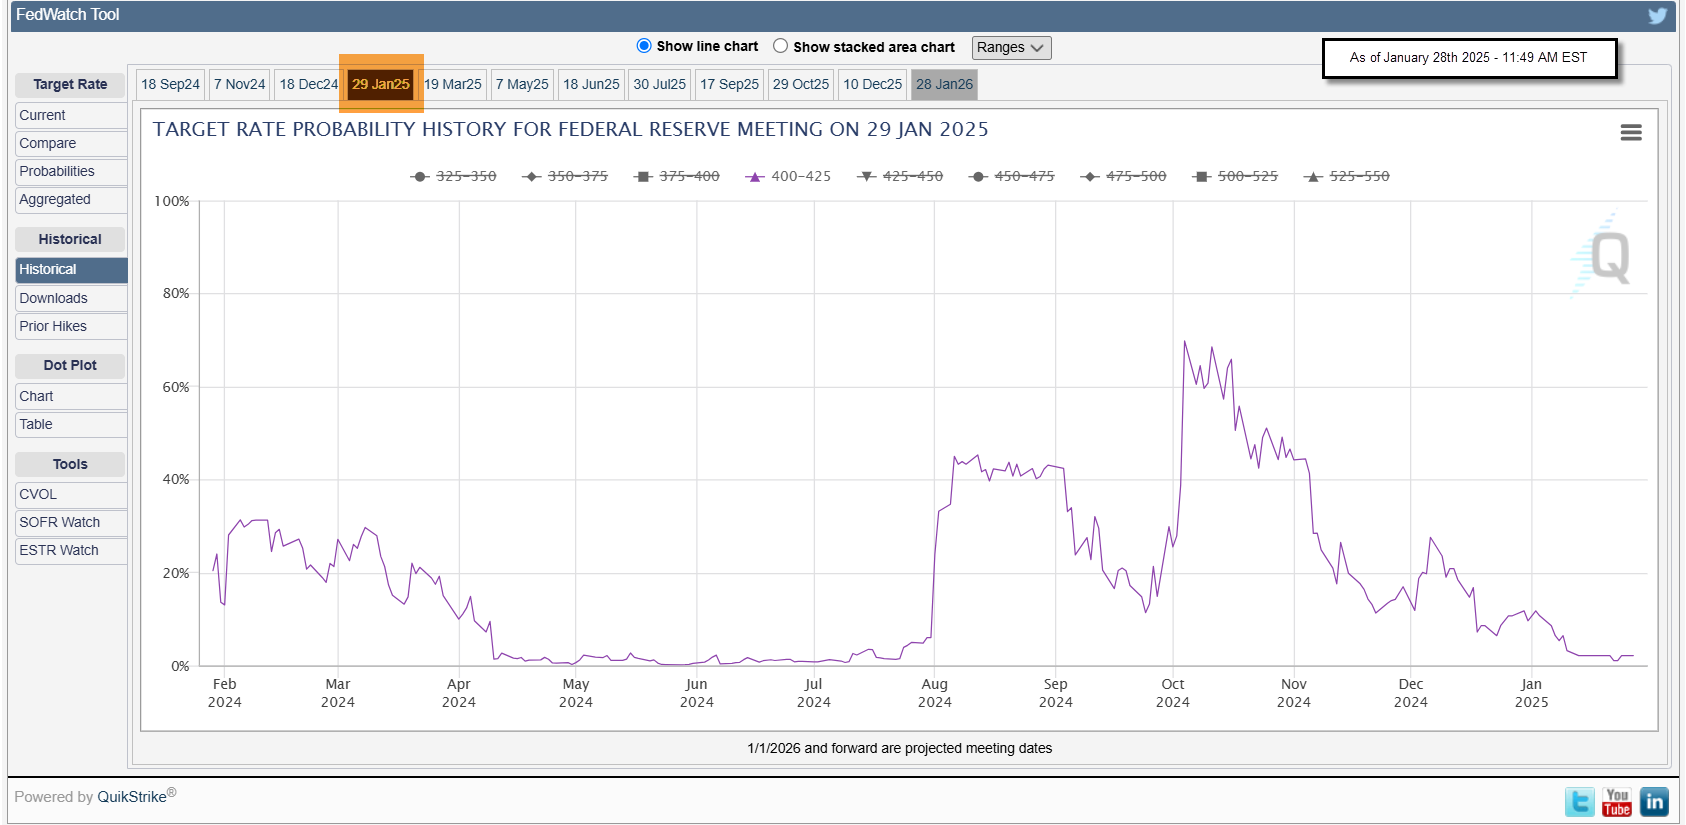
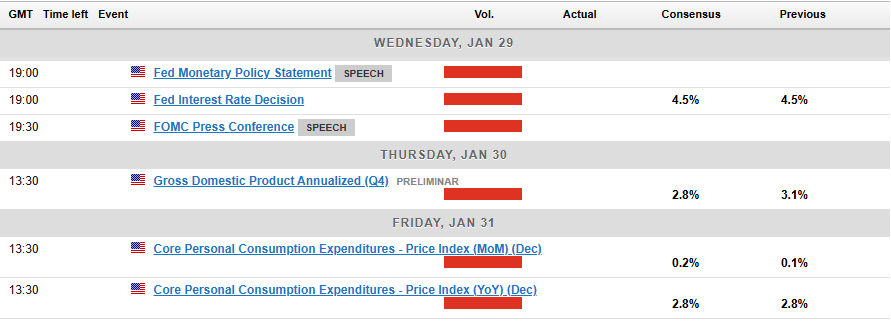
The Federal Open Market Committee (FOMC) interest rate decision is scheduled for Wednesday, January 29th, 2025. It is the FED’s first meeting in 2025 and the third after Trump’s election victory. The latest FOMC minutes showed that policymakers were concerned about a slower disinflation process than previously anticipated and about the impact of tariffs on inflation. According to the CME FedWatch tool and Bloomberg’s analyst surveys, the expectations for a 25 basis point cut for the January 29th FOMC meeting currently stands at 0.5%, compared to 70% just before the elections. (Chart). The surveys also reflected that traders share the FED’s official view of two x 25 bps interest rate cuts in 2025. Before the US elections, the surveys showed that participants looked at 3 – 4 interest rate cuts of 25 bps each in 2025 by the FOMC. Traders will pay attention to Jerome Powell’s comments on how tariffs may impact inflation and how the FED would react.
ECB Rate Decision and Tariff Concerns Weigh on Euro
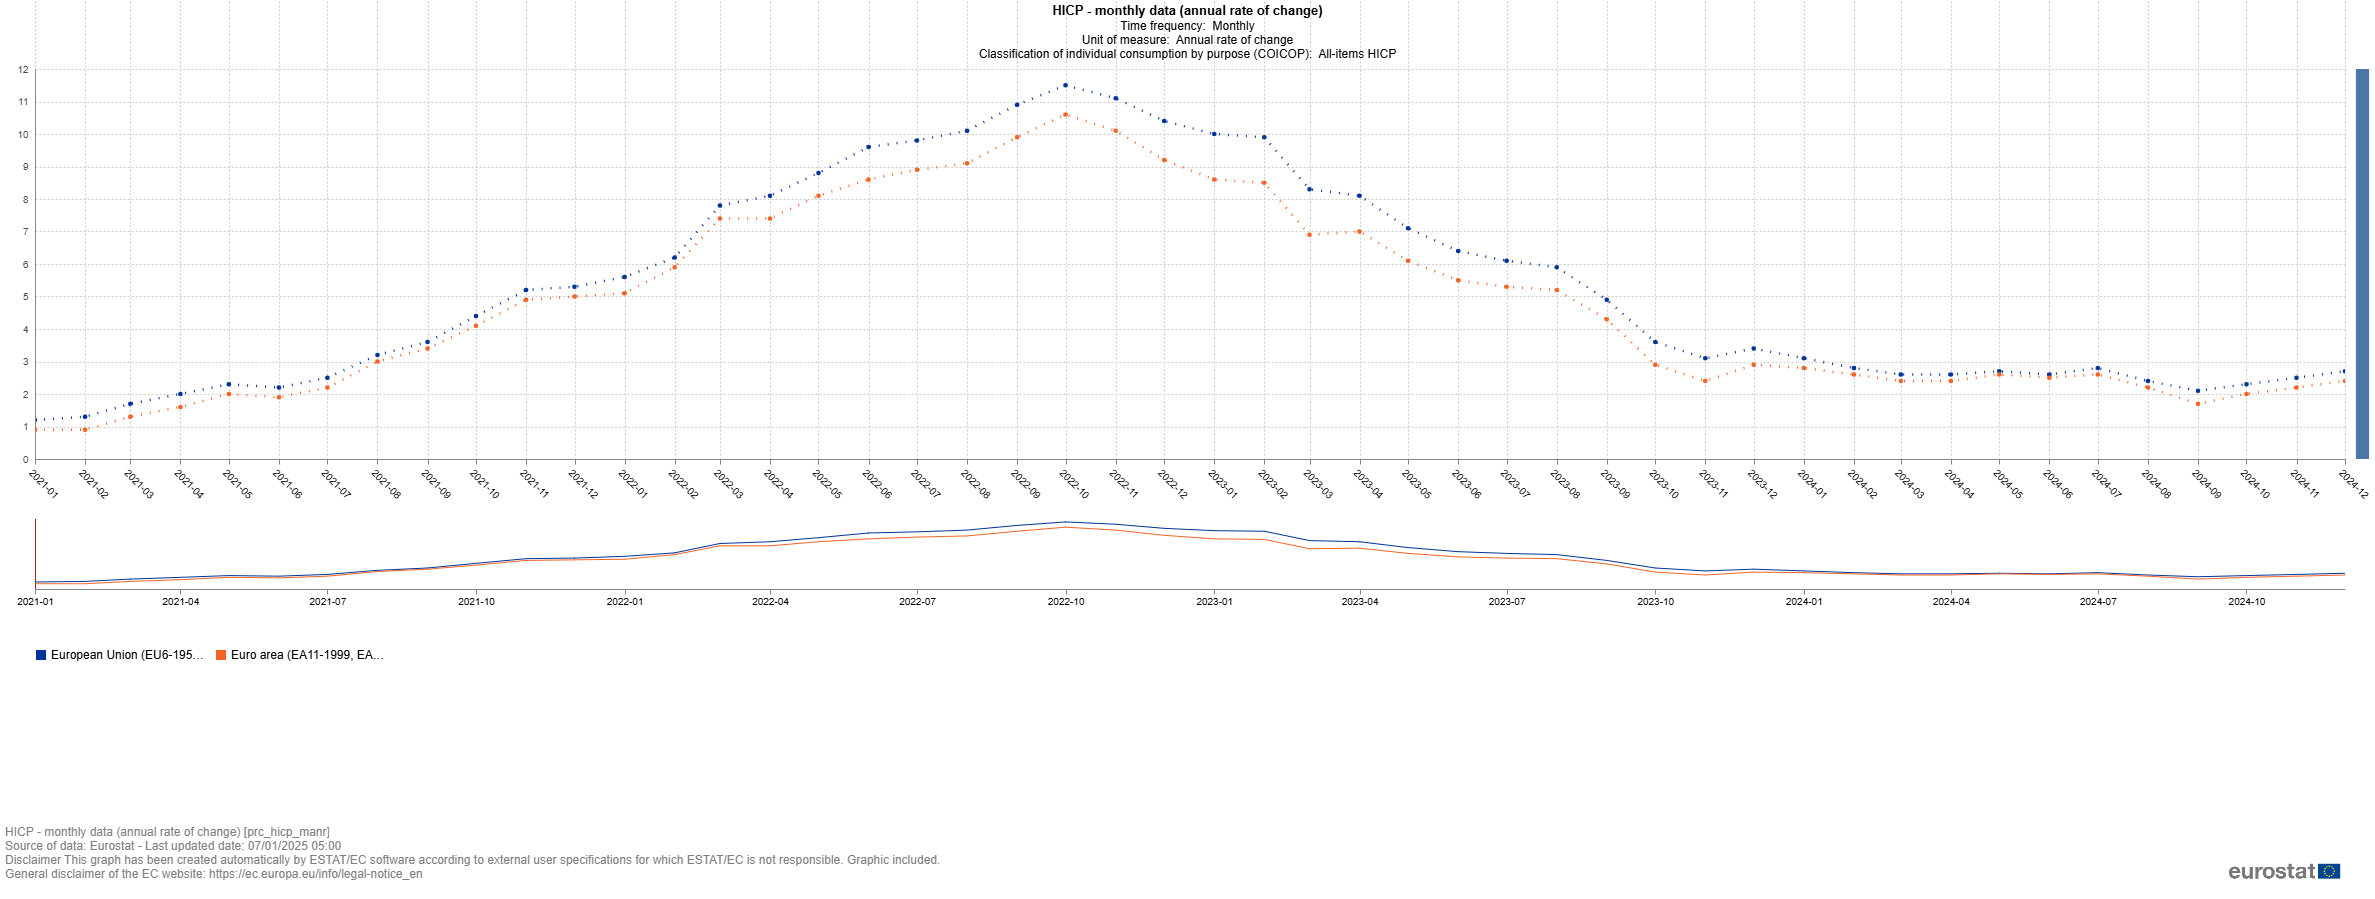
This week, markets are looking forward to the European Central Bank’s interest rate and monetary policy decision, scheduled for January 30th, 2025. According to Bloomberg analysts’ surveys, 97.2% of participants expect the ECB to cut interest rates by 25 basis points. The surveys also suggest that participants anticipate somewhere between 3 – 4, 25 bps cut in 2025. The EU inflation rate (Eurozone HICP) Y/Y remained at nearly 2.4% throughout 2024 but dropped to 1.72% in September. However, it rose to its 2024 average of 2.7% and has remained there since then.
Last week, President Trump vowed to impose tariffs on the EU; Trump said, “We have a $350 Billion deficit with the European Union, the EU, and other countries also had troubling trade surpluses with the United States”. “The European Union is very bad to us; they are going to be in for tariffs. It’s the only way you’re going to be in for tariffs.” On Wednesday of last week, ECB president Christine Lagard said, “Europe must be prepared and anticipate the potential trade tariffs of newly inaugurated US President Donald Trump.” Lagarde also said she “Expects Trump’s tariffs to be more selective and focused.”
Following Trump’s EU tariff comments, the EUR/USD exchange rate retreated below the resistance level of 1.0445 to 1.0390; however, it remained at this level as traders continued to digest the tariff’s impact on the exchange rate. The divergence between the EU and US plans for interest rate cuts in 2025 may add more pressure on the Euro; however, this remains subject to further details on how the tariff plans develop and its details.
Tariff Threats and Market Uncertainty
Markets remain on high alert, and volatility is higher than usual as traders react to mixed messages about tariffs. During his election campaign, President Trump proposed a 25% tariff on Canada and Mexico, the USA’s largest trading partners, and a 10% tariff on China and the EU. So far, no formal tariff decisions have been made. The president mentioned multiple times that the primary purpose of tariffs is for the US to have fairer trade agreements with its partners, additional border security, and to block the flow of the Fentanyl drug from China.
Although Trump didn’t impose tariffs on day one as promised during the election campaign on Monday, hours after the inauguration speech, Trump renewed his tariff threats to Canada, Mexico, and China. Market reaction was short-lived as traders continued to wait for more details on how the Trump administration would impose tariffs and which products could be affected. Canada and Mexico have reassured the Trump administration that they will work harder to ensure the US borders are secure per Trump’s request; however, the two nations and China have prepared a list of American goods on which they may impose retaliatory tariffs.
Tariffs are considered an additional cost, impacting goods and services prices and leading to higher inflation. The first mention of tariffs pushed the US dollar higher against most major currencies. EUR/USD dropped to the 1.0180 range, almost to parity. USD/CAD rose above 1.4500, breaking out and closing above critical resistance levels, which held firm in 2015 and again in 2020. However, the price moves didn’t last long as markets continued to wait for more details. EUR/USD rose back above 1.0420, and USD/CAD fell to 1.4360.
Tariffs remain a concern for FX traders as comments continue to impact exchange rates. On Monday, the dollar rose against all its peers. The Yen, the Euro, and the Canadian Dollar instantly weakened versus the dollar after comments from US President Donald Trump and Treasury Secretary Scott Bessent highlighted concerns about tariffs.
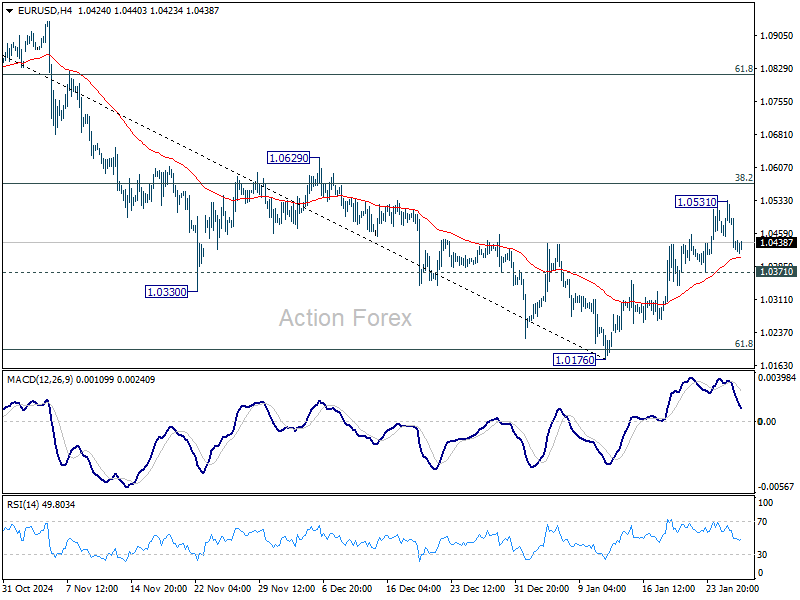
EUR/USD Technical Analysis
EUR/USD Weekly Chart
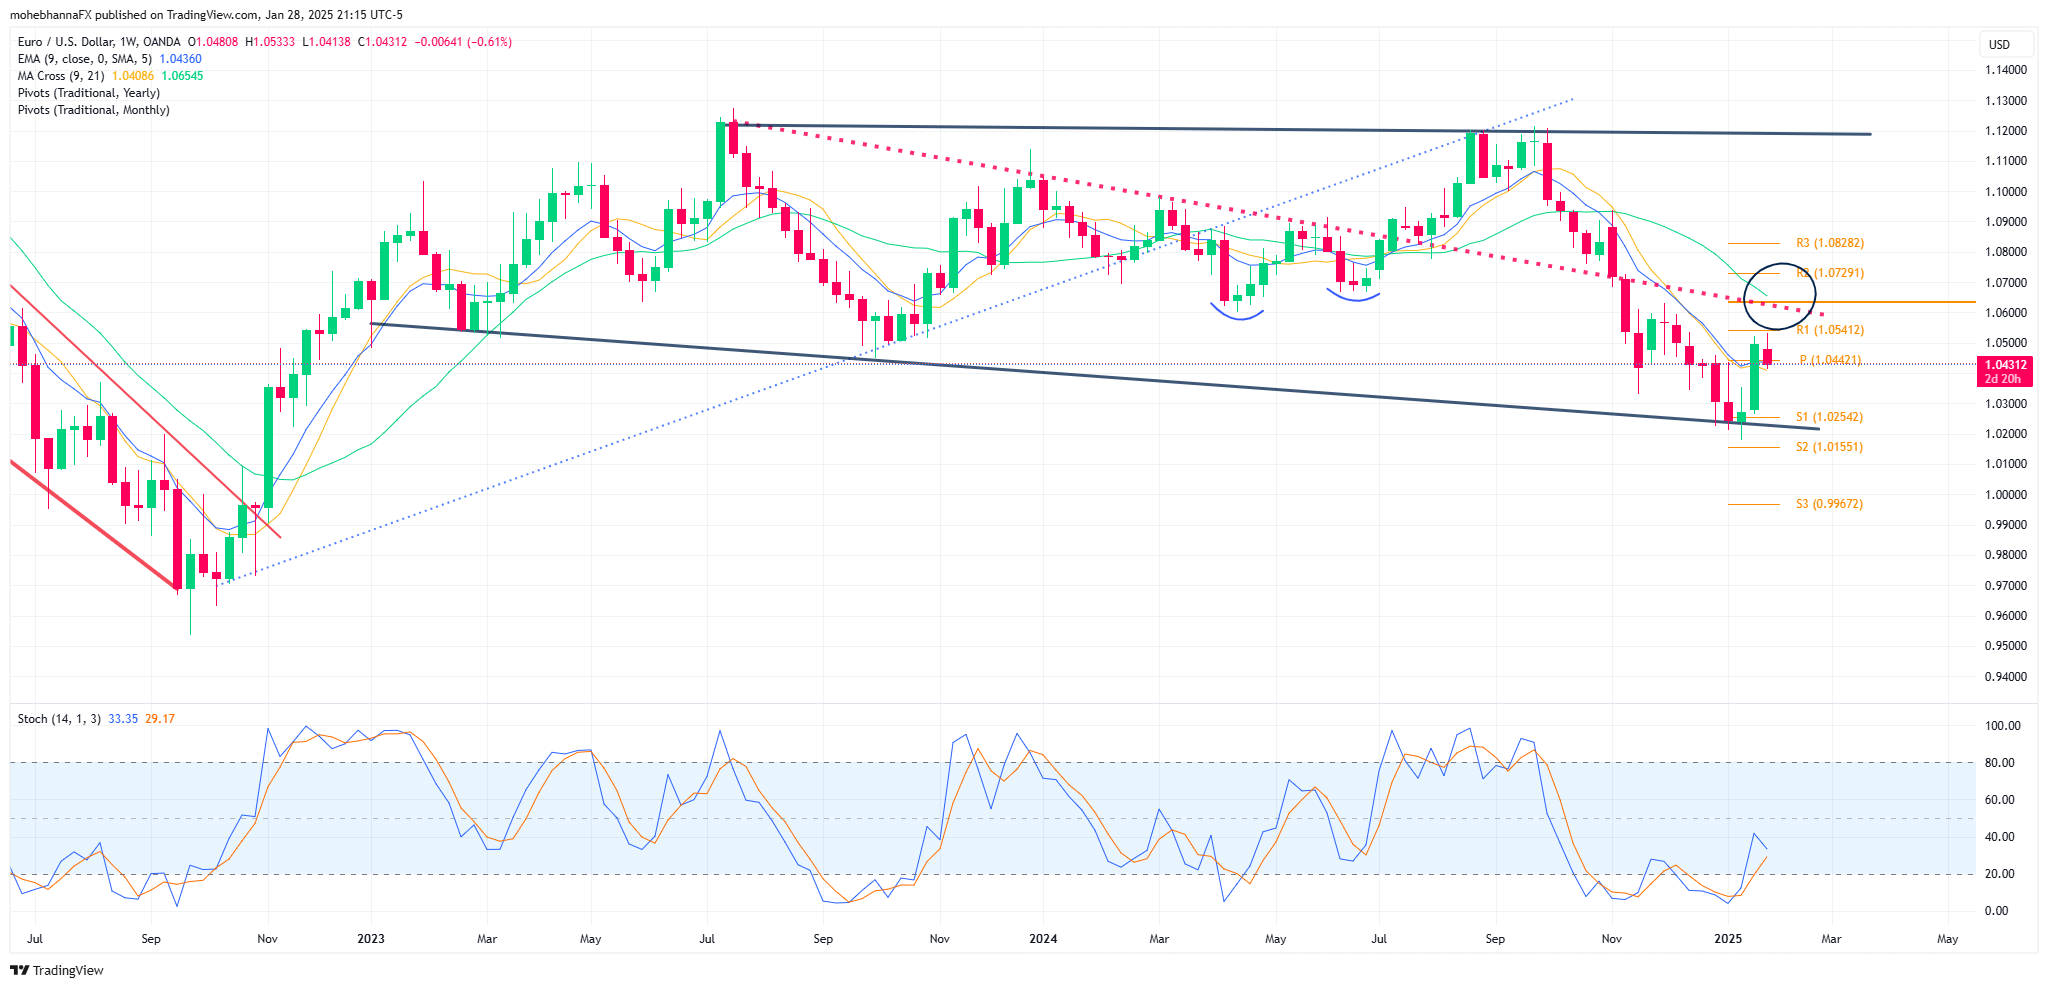
- The overall long-term chart context reflects a “Rising Wedge” formation for the downtrend, which began mid-2021 (Descending channel marked by red Lines to the left of the chart); price action attempted to break below the lower pattern border several times. The wedge pattern changed to a sideways price action, marked with black lines on the chart.
- The price continued its decline during December 2024, reaching new lows of 1.0230, where support was found, taking the price back up above the monthly PP of 1.0442. Price rose to R1 of 1.0541; however, following Trump’s administration’s renewed tariffs concerns, the price fell back to 1.0442.
- Multiple resistance levels lie above price action near monthly R1 of 1.0541 and a confluence of resistance at 1.0633 (Marked by a black circle), represented by the intersection of an intermediate declining trendline extending from July 2023 (Dotted red line), the SMA21 and the annual PP of 1.0633
- The Stochastic Indicator aligns with price action and has crossed above the %D line. The positive divergence previously seen has materialized; however, the indicator slightly reversed from its neutral level.
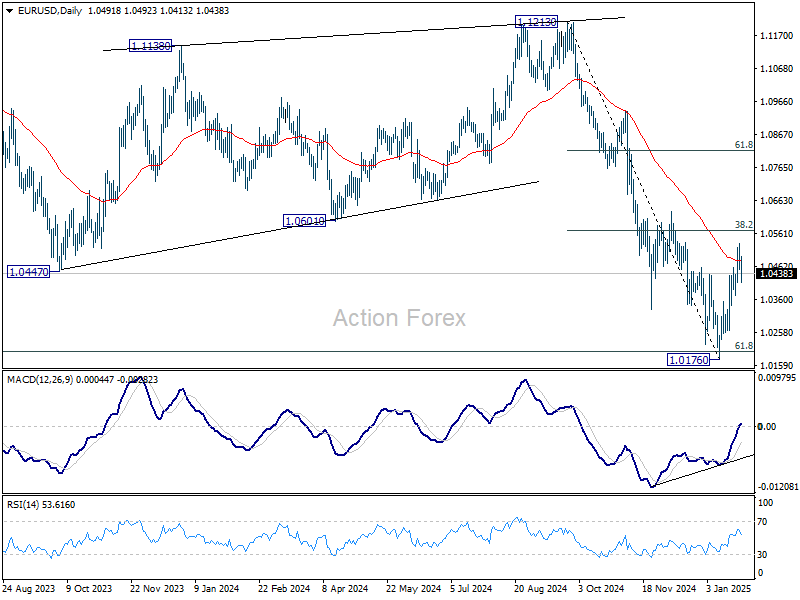
EUR/USD Daily Chart
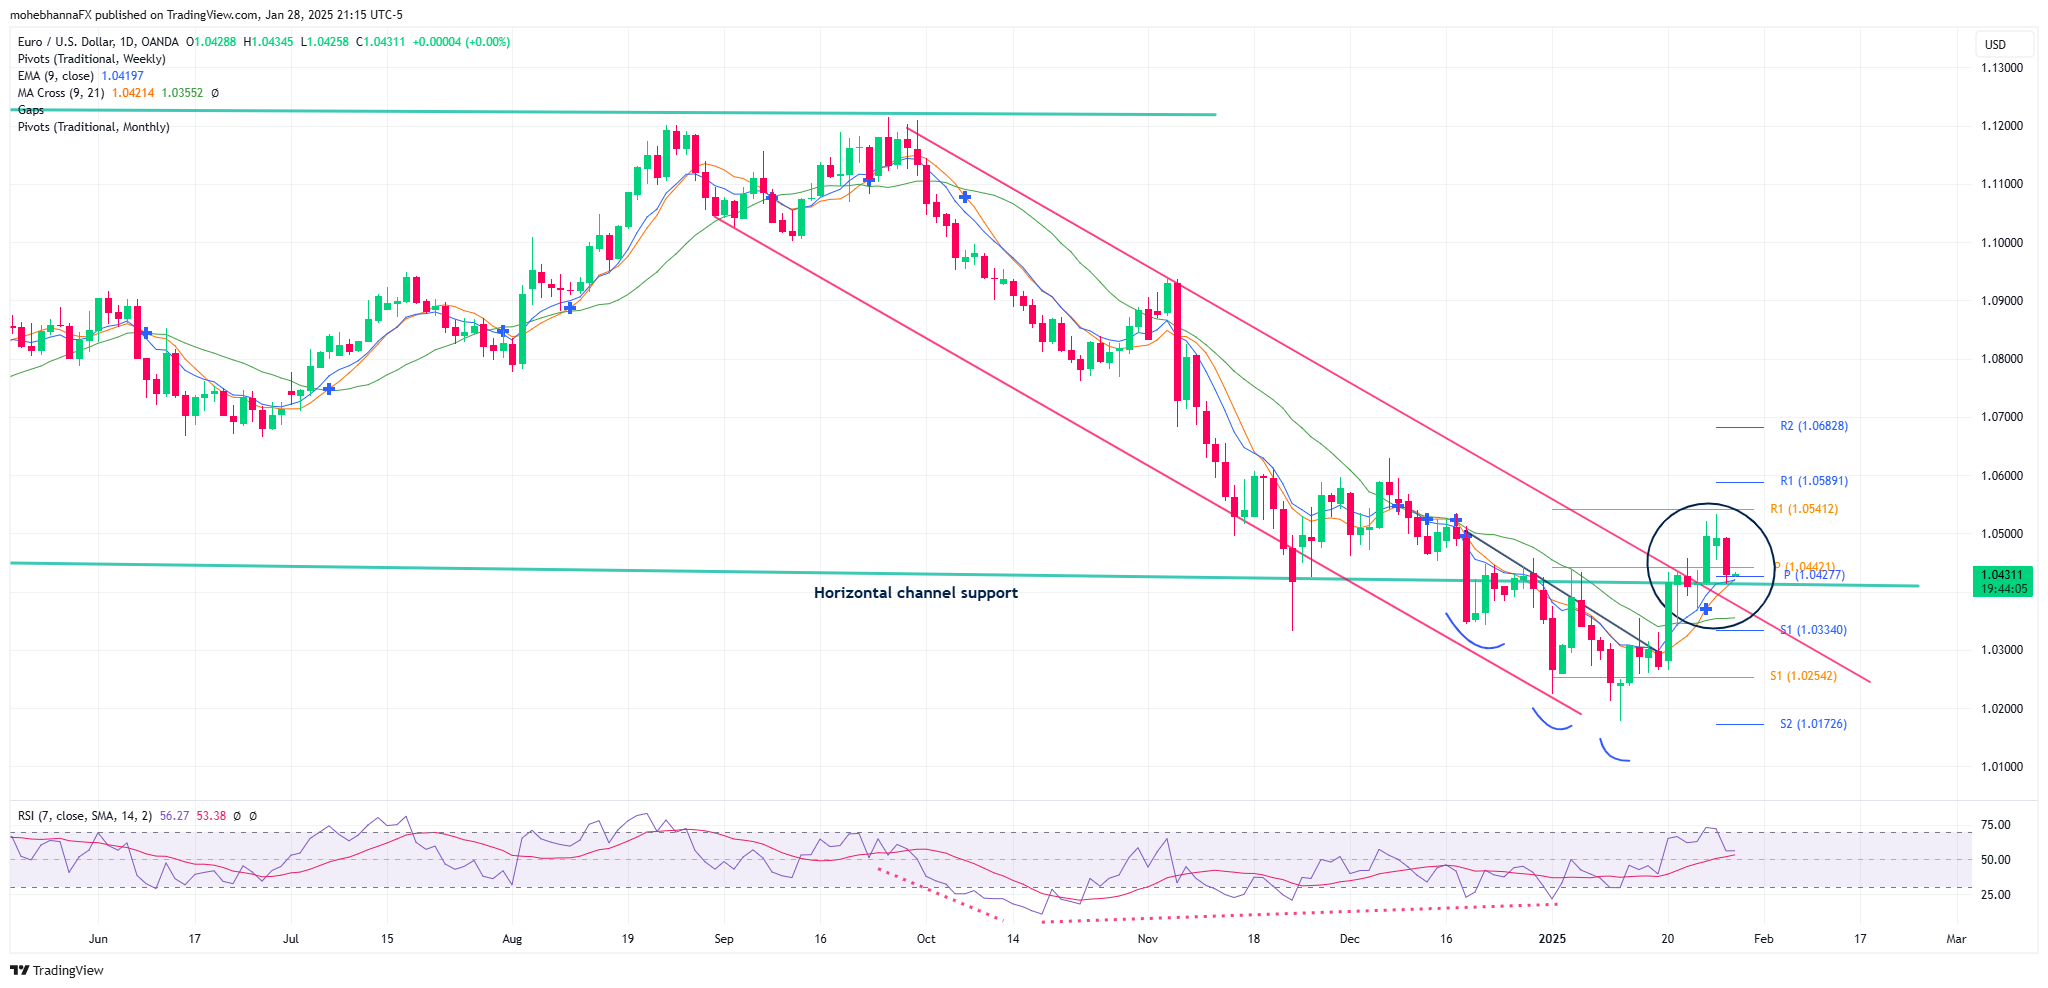
- The overall context: Price action has been trading sideways within a wide horizontal range channel that goes back to January 2023, marked by green lines on the daily chart. The channel lies within the wide range of 1.0400 – 1.1200. The price retreated to the horizontal channel support (Green line – the lower channel borderline), broke, and remained below it for more than 3 weeks. Following multiple failed attempts and the previously discussed inverted triple bottom, price action was able to break back above the broken level (Circle), where it is currently finding support. The price also broke above the descending channel’s upper border, marked by the chart’s red lines. (Resistance turned Support).
- Price action broke above the SMA21, SMA9, and EMA9, the monthly PP of 1.0442, and the weekly PP of 1.0427. The three averages and the PPs intersect with the horizontal channel support (green line) and the declining channel lower borders (red line), representing a critical confluence of support below price action near the range of 1.0350 -1.0440.
- RSI is in line with price action, with a double top formation; however, it has remained above and supported by its MA so far.
USD/JPY Technical Analysis
USD/JPY Weekly Chart
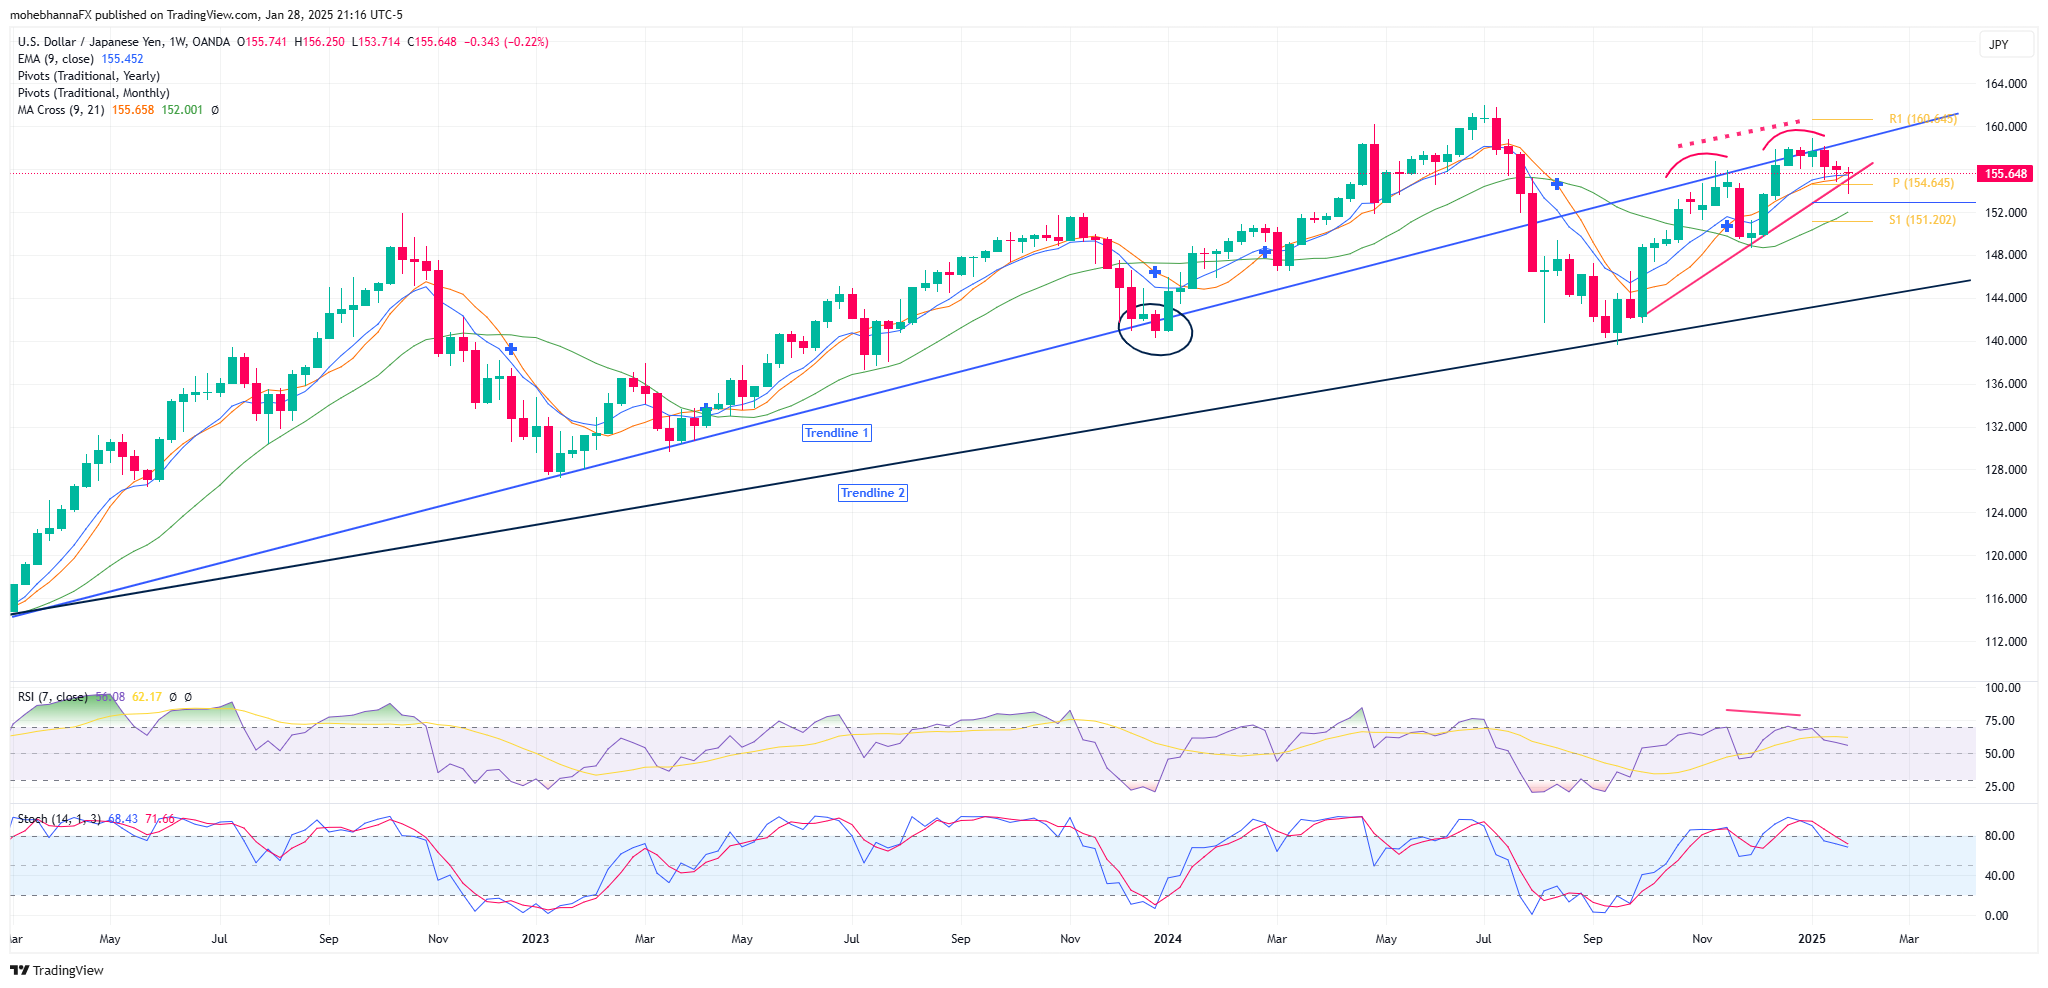
- The overall context of the chart reflects that Price action has been trading in an uptrend since early 2022, when the FED began raising interest rates. The uptrends are marked on the chart, trendlines 1 and 2. Following the US elections, the US dollar rose against the Yen; however, in the following weeks, it failed against the JPY as it was met by resistance at the historical monthly R1 standard calculations of 158.37 and trendline 1 (Blue line). Price action has been volatile around the breakout level. The decline was erased in the following weeks as the price rose, reaching the extension for trendline 1 in mid-December, the 158.37 area, where resistance was found for the past few weeks.
- The weekly chart shows a double top formation (Red curves—baseline marked by ascending red line). The baseline intersects with the monthly PP of 154.64.
- Price action is currently trading above its fast-moving averages, EMA9 and SMA9, the intermediate moving average, SMA20, and its monthly pivot point of 154.64.
- Fast RSI7 aligns with price action, currently at its neutral level and reflecting a slight negative divergence, adding more weight to the double top formation. (marked by the dotted red lines)
- Stochastic is in line with price; the %K line crossed below the %D line, and both are below the overbought levels.
USD/JPY Daily Chart
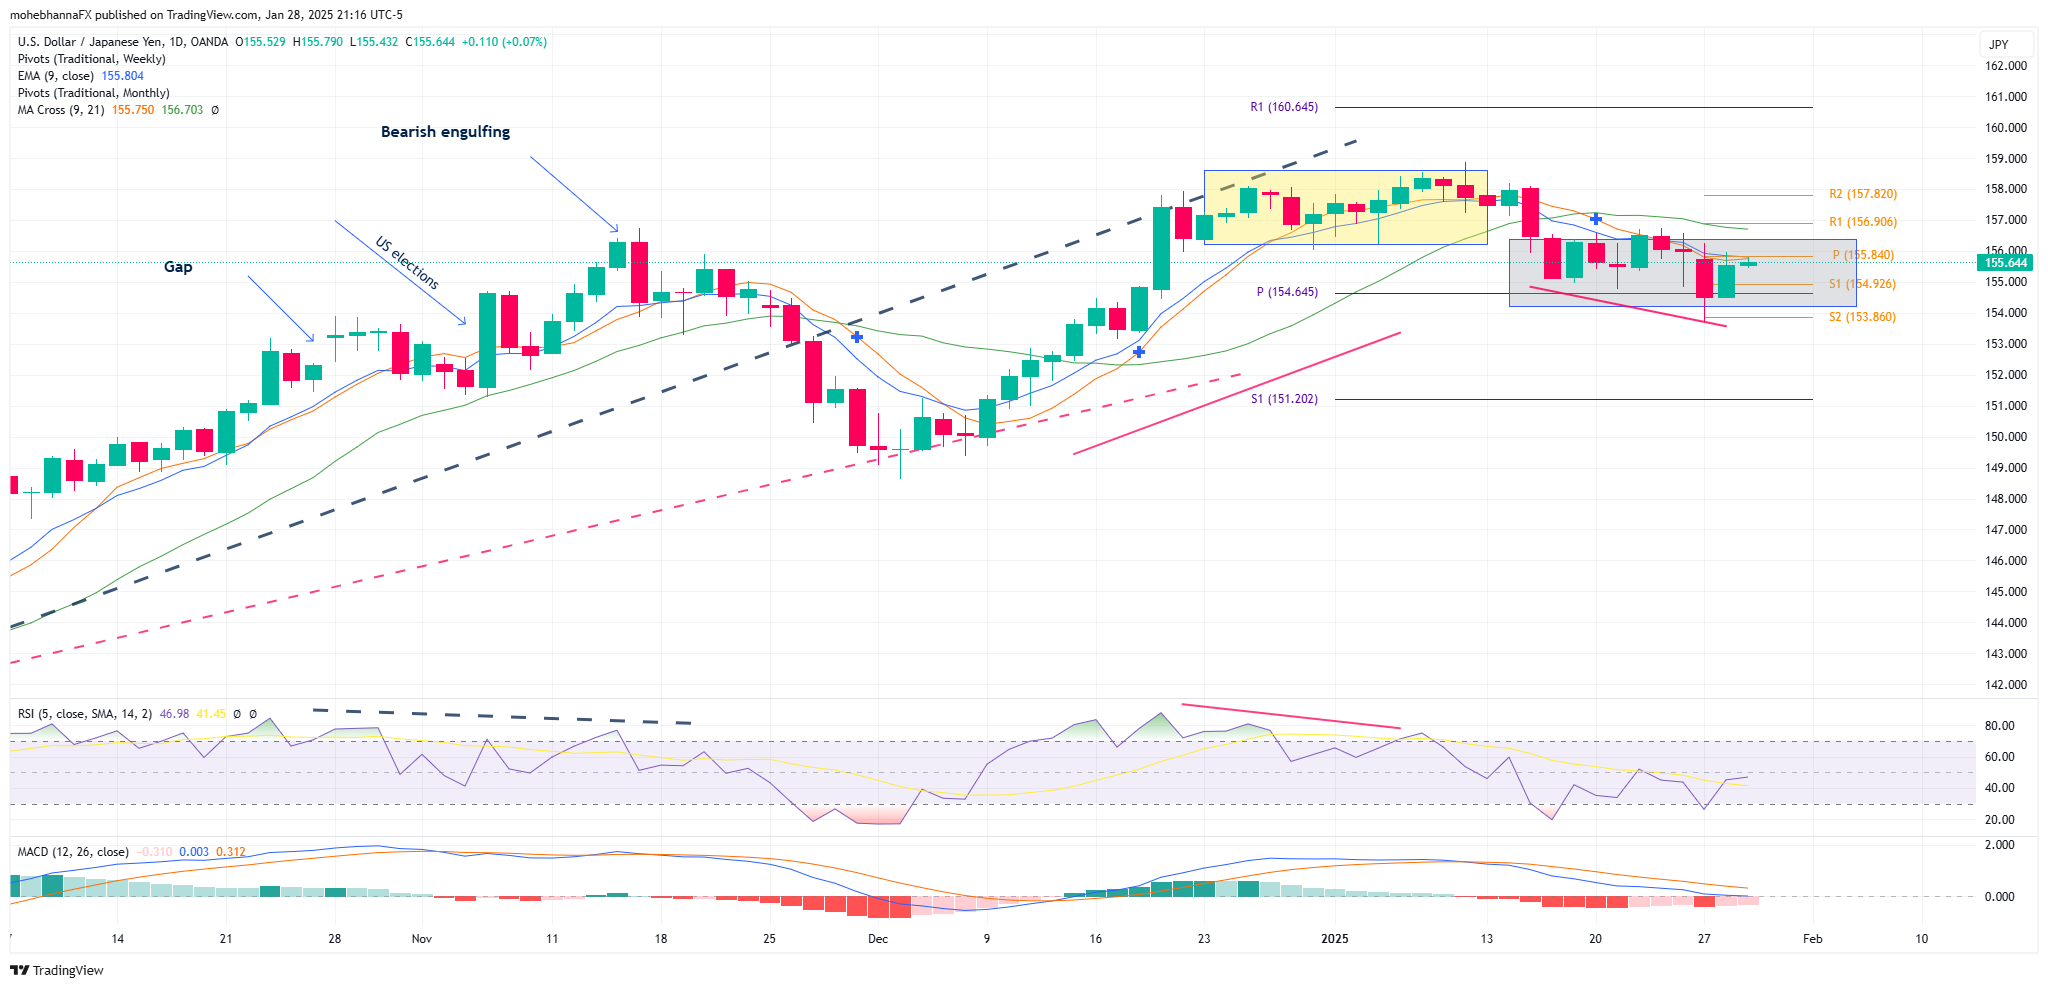
- The recent price action on the daily chart reflects that the price was moving in an intermediate uptrend since mid-September of 2024, interrupted during the last few days of November 2024, as price action broke and closed below the uptrend. (Dashed black line).
- An exhaustion gap in late October 2024 has been filled, with price action breaking and closing below it. The support level represented by the gap formation has turned into a resistance level near 152.60. Following the decline in early December of 2024, price action found support above an intermediate trendline (Dashed red line) and rose back to the dashed black line, where it found resistance, which was followed by multiple daily spinning tops candles and a failure back down to its monthly PP of 154.64.
- Price action broke and closed below its weekly PP of 155.84, its fast and intermediate moving averages, EMA9, MA9, and MA21. The three averages and the weekly PP represent a confluence of resistance above the price.
- A second set of multiple spinning top candles formation for the past few days, highlighted in grey.
- Fast RSI5 aligns with price action, reflecting a potential positive divergence. The MACD line is below its signal line but remains close to it.
In conclusion, this week’s central bank decisions and ongoing tariff threats have created a volatile and uncertain market environment. While the FOMC is expected to hold rates steady, the ECB is likely to cut rates amid concerns about US tariffs on the EU. The overall market sentiment remains cautious as investors await further clarity on the trade situation. The technical outlook for EUR/USD and USD/JPY suggests continued volatility, with potential support and resistance levels identified. Traders should closely monitor central bank announcements and news related to tariffs to navigate these uncertain times.
Gold (XAU/USD) Price Analysis: Bullish Bias Amid Tariff Uncertainty and FOMC
- The US Treasury is proposing a gradual increase in universal tariffs, causing uncertainty in the US Dollar and market expectations.
- The Federal Reserve meeting tomorrow is expected to result in an extended pause due to tariff uncertainties and potential inflation impact.
- Gold maintains a bullish bias due to uncertainties around tariffs and their impact, with safe-haven flows to support prices.
Gold prices dropped yesterday as markets digested a host of factors which included tariff threats and a market shock thanks to Chinese AI startup DeepSeek. The precious metal has edged its way higher since printing a low of $2730/oz to trade around $2750/oz at the time of writing.
Yesterday’s price drop in Gold may also have been down to some profit taking following an impressive rally last week. Given the US Federal Reserve interest rate meeting is tomorrow, market participants may have opted for some profit taking ahead of a potentially volatile Wednesday.
Tariff Threats Back in Focus – Bessent vs Trump?
The threats of tariffs came back to the fore yesterday as well. The Financial Times reported that new Treasury Secretary Scott Bessent is pushing for a gradual increase in universal tariffs, starting at 2.5% and possibly going up to 20%. President Trump later said he wants even higher tariffs and is considering specific taxes on products like steel, copper, and semiconductors.
This goes against market expectations that tariffs would be applied on a case-by-case basis, like with Colombia, rather than across the board. Since these plans are being actively developed by the Treasury and not just hinted at by Trump, the US Dollar has been making moves with a lot of whipsaw price action experienced by the Dollar Index (DXY).
FED Meeting Ahead – Extended Pause?
The Federal Reserve meeting tomorrow should result in an extended pause given the ongoing uncertainties around tariffs. Despite Fed Chair Powell’s comments in the lead up to the December meeting that policymakers do not concern themselves with the political side of things, the meeting minutes showed that policymakers are concerned about tariffs.
The threat of tariffs continues to shake markets when mentioned, and strengthens the US dollar. The impact on inflation however, is where the concern lies for the Fed with Trump’s comments yesterday around specific taxes on products like steel, copper and semiconductors likely to lead to an increase in price pressures down the line.
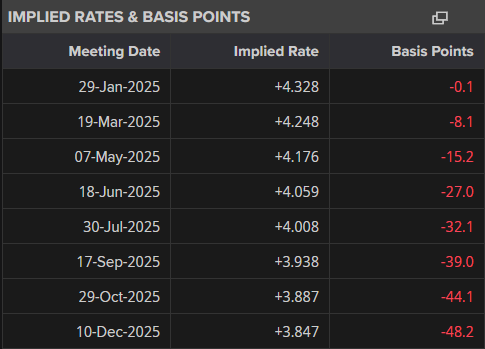
Markets are now pricing in around 48 bps of rate cuts from the Fed through December 2025.
Source: LSEG (click to enlarge)
Final Thoughts
Personally I still maintain a bullish bias on Gold largely from the fact that the uncertainties around tariffs and their impact will keep safe haven flows elevated. As we saw yesterday, the US Dollars safe haven appeal may be waning with the JPY and CHF faring better during the DeepSeek inspired market rout.
Geopolitical and growth concerns may also factor in and thus lend a supporting hand to Gold prices in the days and weeks ahead.
Technical Analysis Gold (XAU/USD)
From a technical analysis standpoint, this analysis is a follow up from the technicals last week. Read: Gold (XAU/USD) Price Steady On Inauguration Day, the Calm Before the Storm?
Golds breakout after President Trumps inauguration fell short of the al time highs as the precious metal rejected at the 2785 handle.
Yesterday’s selloff has not resulted in a trend change with bulls coming back in to push prices above the 2750 handle.
Gold (XAU/USD) Daily Chart, January 28, 2025
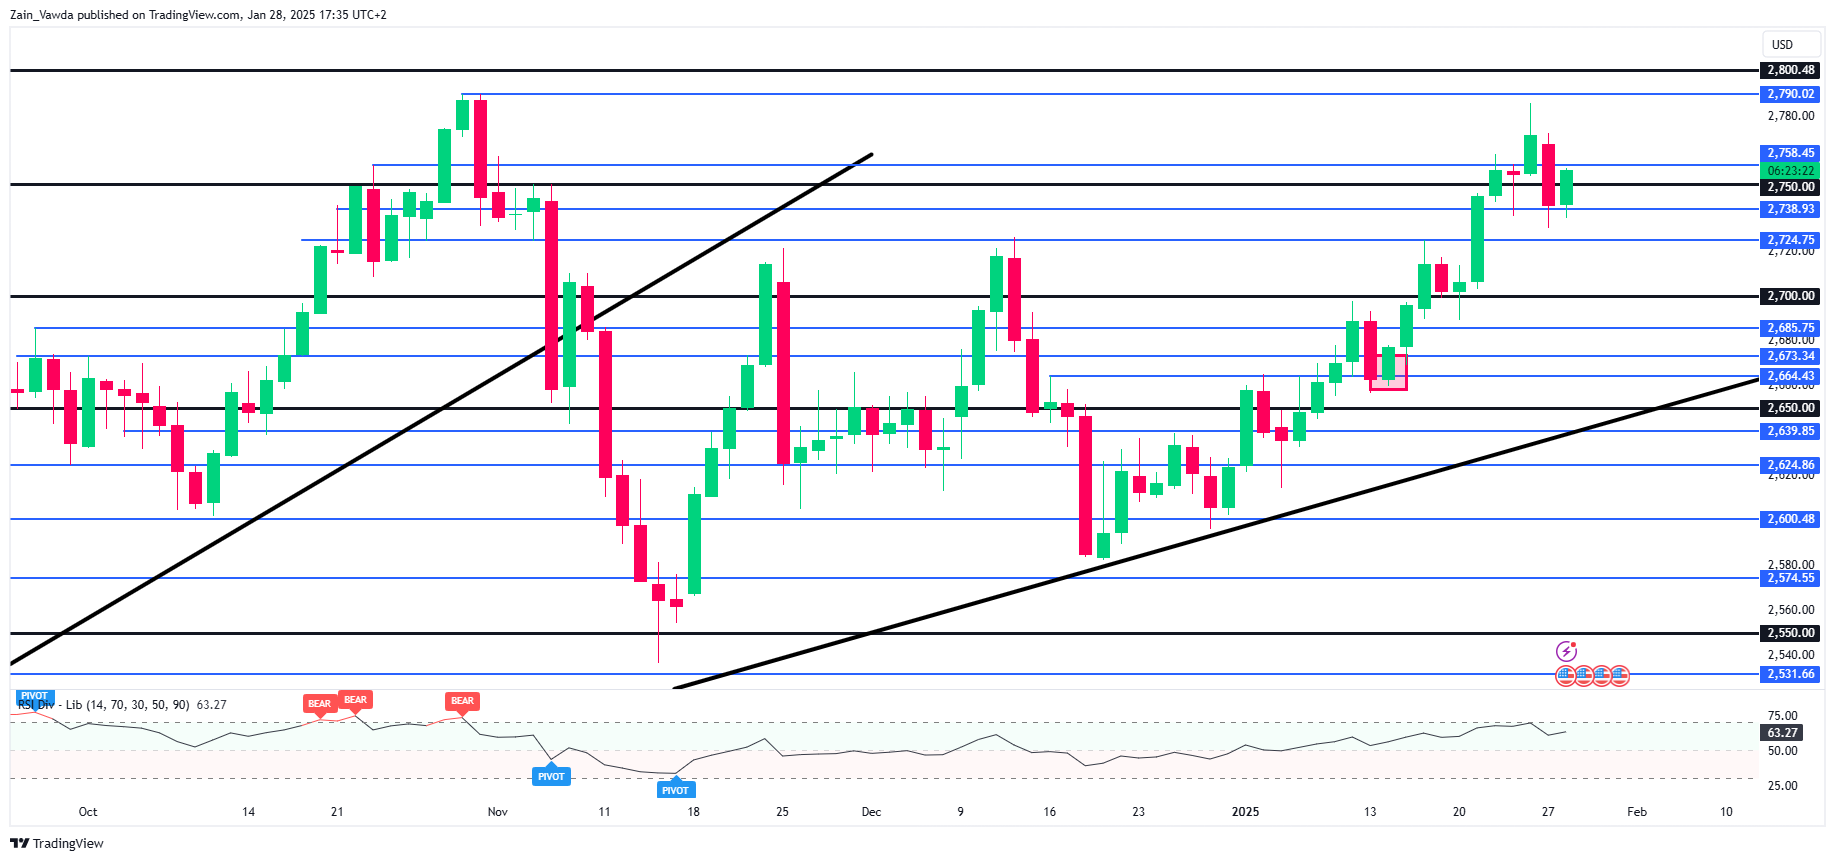
Source: TradingView (click to enlarge)
Dropping down to a H4 chart and as you can see below, the trend has changed to bearish with a lower high followed by a lower low. However there is a descending trendline in play with the swing high resting at 2770.
A candle close above the descending trendline, could lead to a retest of the 2770 ahead of the FOMC meeting.
A 4-hour candle close above the 2770 handle could be seen as a pre-cursor for fresh all-time high for the precious metal.
Keep an eye out for comments around tariffs or any other geopolitical comments from the Trump administration as this could have a knock on effect on global markets.
Gold (XAU/USD) Four-Hour H4 Chart, January 28, 2025
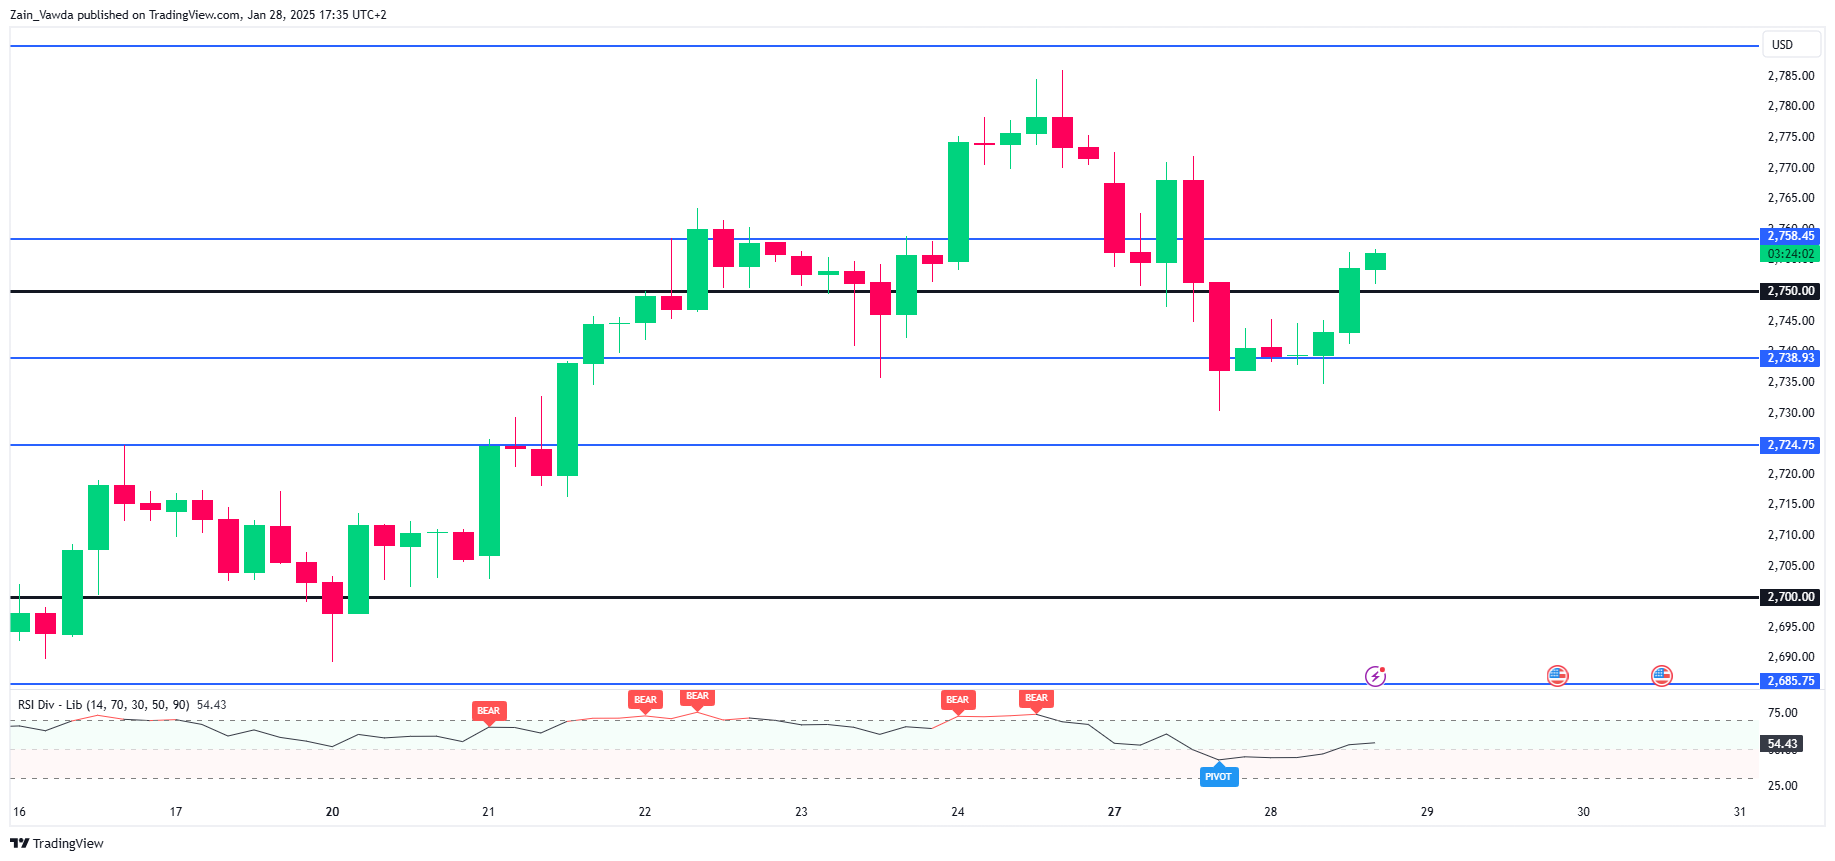
Source: TradingView (click to enlarge)
Support
- 2750
- 2739
- 2724
Resistance
- 2758
- 2770
- 2785
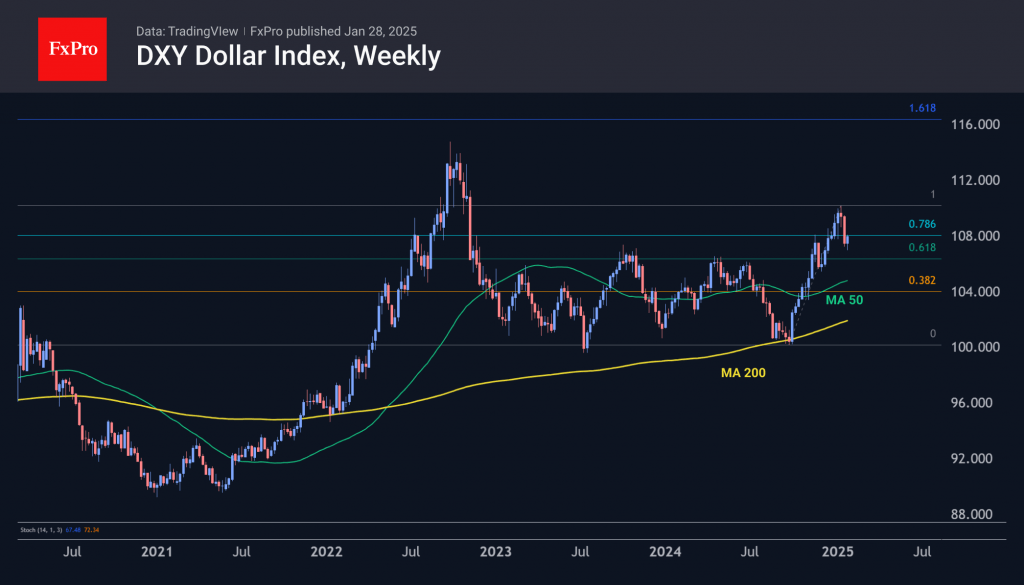
USD Index: Dollar Regains Traction on Renewed Tariff Talks, Awaits FOMC Decision
The dollar index was firmer on Tuesday and recovering from Monday’s turbulence, sparked by DeepSeek shockwave.
Today’s gap higher opening and (so far limited) bounce were sparked by Trump’s renewed tough tariff rhetoric.
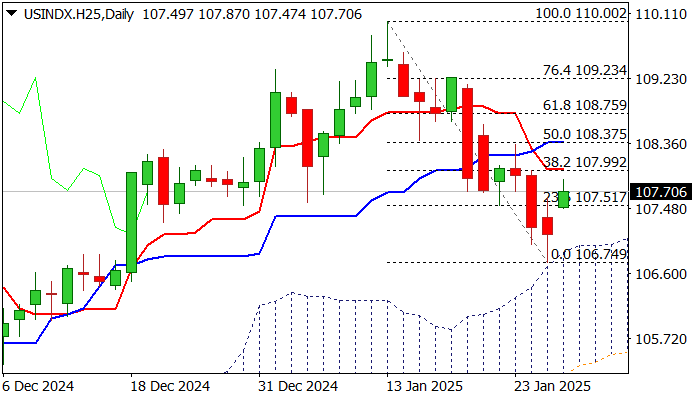
The action is calmer compared to Monday’s wide swings and signal potential recovery (if talks about tariffs do not fade again) after Monday’s dip to five-week low was contained by the top of ascending daily Ichimoku cloud (106.75) that now offers solid support.
However, recovery so far did not show significant results, as initial barriers at 108.00 zone (Fibo 38.2% of 110.00/106.75 pullback /10DMA) is still intact.
Conflicting signals from daily chart (momentum remains negative / RSI is heading north, and MA’s are in mixed setup) do not provide adequate support, although dollar is still afloat.
All eyes are on Wednesday’s FOMC rate decision, which is widely expected to result in unchanged US interest rates, but markets want to hear more from Chief Powell, particularly about the central bank’s rate trajectory in 2025.
Most economists expect 50 basis points cut in total in 2025, with first 25 bps cut to possibly occur in the second half of the year.
Elevated inflation in the US and expectations for further price pressure on President Trump’s election promise about strongly boosting US economic growth, should further support the dollar.
Res: 108.00; 108.37; 108.75; 109.25
Sup: 107.50; 106.89; 106.75; 106.12
Threats of Tariffs Bring Back Speculative Interest in Dollar
The US dollar rose on Tuesday, adding 0.65% against a basket of popular world currencies amid Donald Trump’s statements about his desire to increase the universal tariff on all imported goods above the current 2.5%.
News of the tariffs supports the US dollar as it suggests a reduction in the US trade deficit and an increase in demand for local goods. Currently, this represents a market reaction to plans that have yet to be implemented, but the information has supported the dollar from a technical analysis perspective.
Last week, the DXY index finished below its 50-day moving average, breaking a four-month uptrend. However, a quick return above that level this week allows the decline on Friday to be viewed as a temporary deviation.
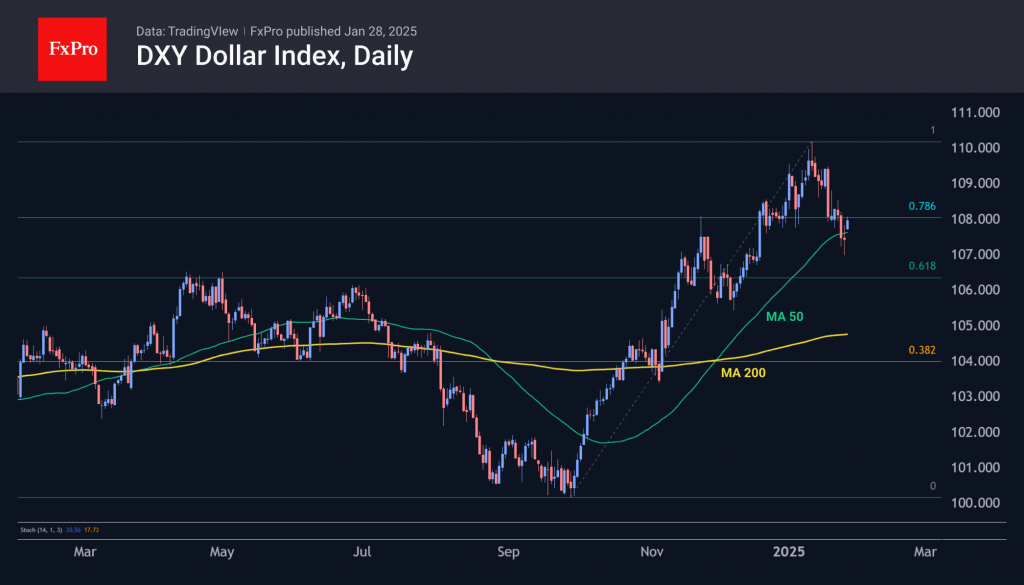
With further growth of the dollar, the decline of the previous two weeks can be interpreted as corrective, which allowed to fix profits and clear the way for further growth with the renewal of the January highs. The Fibonacci extension points to a potential target for the DXY index around 116, which corresponds to a rise to 161.8% of the initial momentum. But in practice, the path may be less straightforward.
Later this week, the Fed meets, where no change in the key rate is expected. The focus will be on plans for 2025 and whether expectations of two rate cuts are confirmed.
Tariff threats may encourage the Fed to stick to tighter monetary policy, but this is at odds with Donald Trump’s recent demands for rate cuts to stimulate growth. In the currency market, low rates help weaken the dollar, offsetting the effect of higher tariffs, with the economy receiving an additional boost to inflation. This raises the question of the Fed’s tolerance for inflation. Both in Trump’s first term and immediately after the last election, the Fed tightened its rhetoric at the prospect of the effects from tariffs.
Higher inflation at healthy growth rates could help the US reduce its government debt-to-GDP ratio by depreciating the dollar’s real purchasing power. However, this is a complex process that requires a high level of international coordination. The United States succeeded in the 1980s with the Plaza Accord, but the question remains whether it can do so again.
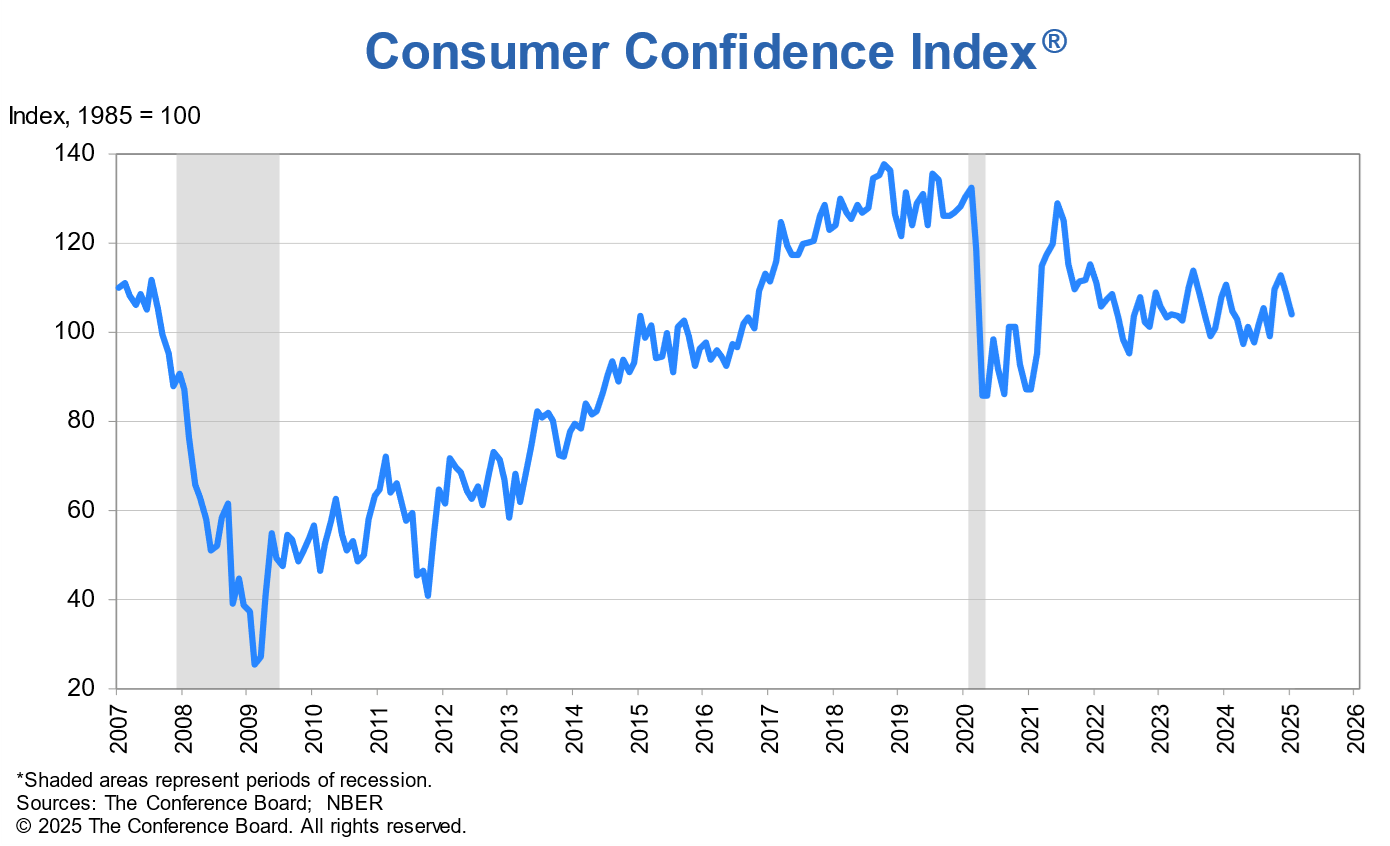
US consumer confidence falls to 104.1 as labor sentiment weakens
US Conference Board Consumer Confidence Index dropped to 104.1 in January, down from 109.5 and falling short of expectations at 105.7. Present Situation Index saw steep decline by -9.7 points to 134.3. Expectations Index fell by -2.6 points to 83.9, but remained above the critical recession signal threshold of 80.
Dana Peterson, Chief Economist at The Conference Board, noted that consumer confidence has been fluctuating within a relatively stable range since 2022. While January marked the second consecutive monthly decline, the index still falls within that range, albeit closer to its lower boundary.
Peterson added that consumers’ optimism about future business conditions and income also declined. Notably, December’s growing pessimism about future employment prospects was confirmed in January.
EUR/USD Mid-Day Outlook
Daily Pivots: (S1) 1.0453; (P) 1.0493; (R1) 1.0532; More...
Intraday bias in EUR/USD remains neutral for the moment. On the downside, break of 1.0371 support will indicate rejection by 38.2% retracement of 1.1213 to 1.0176 at 1.0572 and retain near term bearishness. Retest of 1.0176 low should be seen next. On the upside, though, decisive break of 1.0572 will raise the chance of bullish reversal, and target 61.8% retracement at 1.0817.
In the bigger picture, outlook is mixed as fall from 1.1274 (2023 high) could either be the second leg of the corrective pattern from 0.9534 (2022 low), or another down leg of the long term down trend. Strong support from 61.8 retracement of 0.9534 to 1.1274 at 1.0199 will favor the former case, and sustained break of 55 W EMA (now at 1.0722) will argue that the third leg might have started. However, sustained trading below 1.0199 will favor the latter case and bring retest of 0.9534 low.
GBP/USD Mid-Day Outlook
Daily Pivots: (S1) 1.2443; (P) 1.2483; (R1) 1.2540; More...
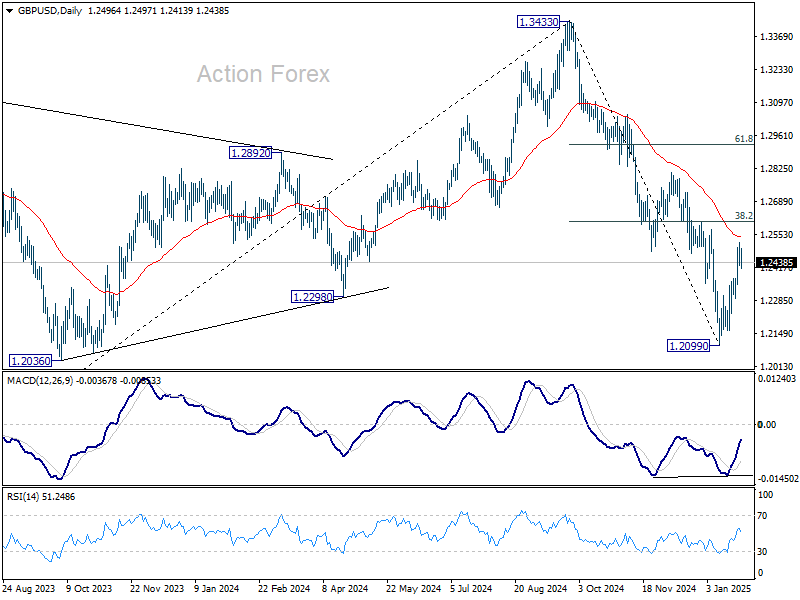
Intraday bias in GBP/USD remains neutral for the moment. Rebound from 1.2099 is seen as a corrective move. While another rise cannot be ruled out, strong resistance could be seen 38.2% retracement of 1.3433 to 1.2099 at 1.2609 to limit upside. On the downside, below 1.2292 minor support will bring retest of 1.2099 low. However, sustained trading above 1.2609 will raise the chance of reversal and target 61.8% retracement at 1.2923.
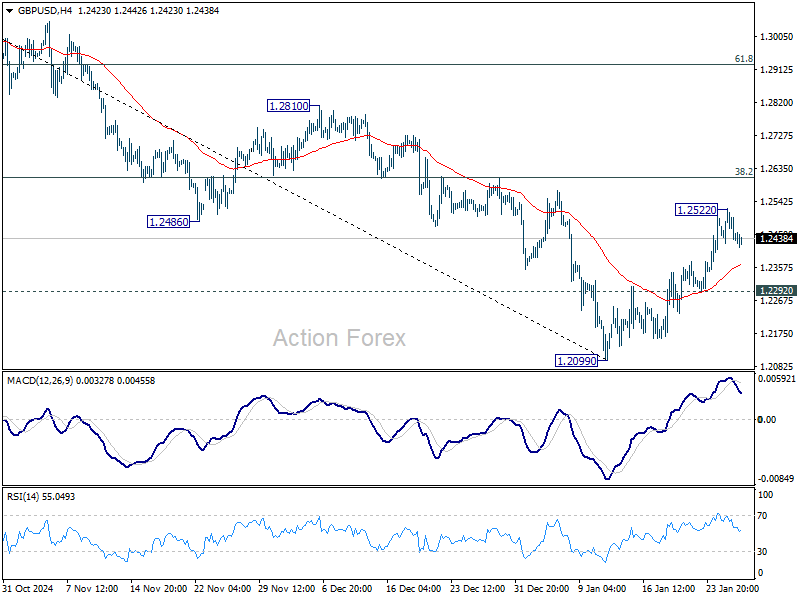
In the bigger picture, rise from 1.0351 (2022 low) should have already completed at 1.3433 (2024 high), and the trend has reversed. Further fall is now expected as long as 1.2810 resistance holds. Deeper decline should be seen to 61.8% retracement of 1.0351 to 1.3433 at 1.1528, even as a corrective move. However, firm break of 1.2810 will dampen this bearish view and bring retest of 1.3433 high instead.
USD/JPY Mid-Day Outlook
Daily Pivots: (S1) 153.40; (P) 154.82; (R1) 155.94; More...
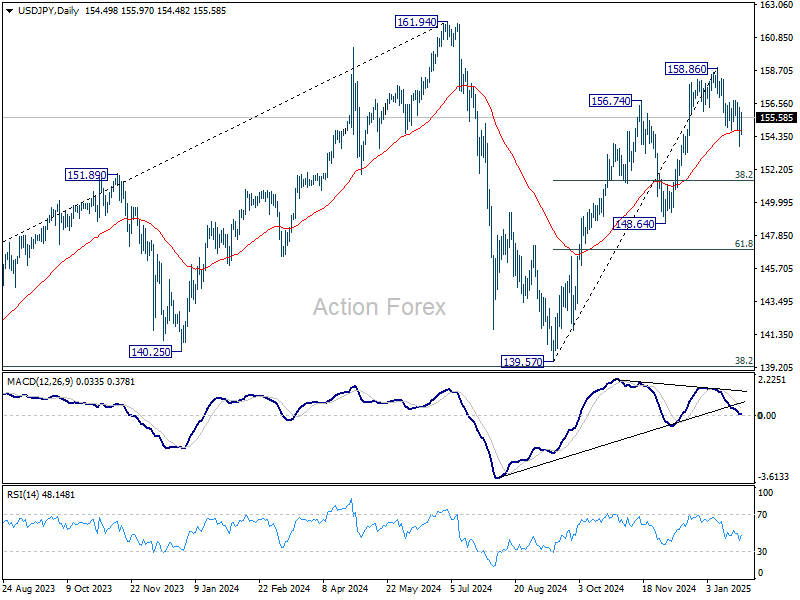
Intraday bias in USD/JPY remains neutral for the moment. On the upside, break of 156.74 resistance will indicate that fall from 158.86 has completed as a correction. Intraday bias will be back on the upside for 158.86 and above to resume the whole rally from 138.57. On the downside, below 153.70 will resume the fall from 158.86 to 38.2% retracement of 139.57 to 158.86 at 151.49.
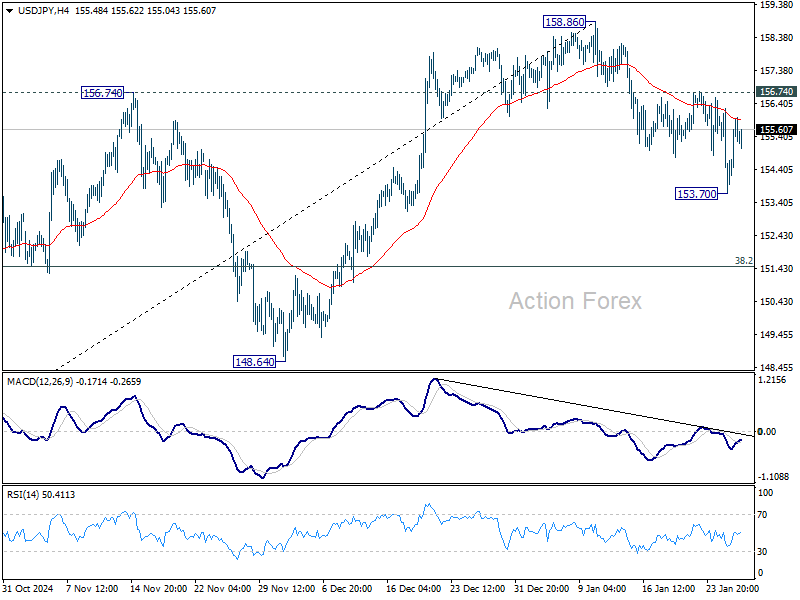
In the bigger picture, price actions from 161.94 are seen as a corrective pattern to rise from 102.58 (2021 low). The range of medium term consolidation should be set between 38.2% retracement of 102.58 to 161.94 at 139.26 and 161.94. Nevertheless, sustained break of 139.26 would open up deeper medium term decline to 61.8% retracement at 125.25.
Sunset Market Commentary
Markets
The dust settled after yesterday’s violent sell-off in the US tech sector. Dip-buying already emerged during the day in certain individual companies. Others closed near or at their intraday lows only to be picked a day later. US indices as a whole kick off more or less unchanged though. Core bond yields recoup some marginal ground with Treasuries trading on par with German Bunds. Rates in both areas add between 2-3 bps across the curve. Some second-tier economic data failed to inspire. US durable goods unexpectedly dropped 2.2% on a monthly basis but that’s due to a 46% plunge in commercial aircraft orders. Stripping for such notoriously volatile items, core gauges printed much better. These include a 0.6% m/m gain in capital goods shipments that excludes military equipment and commercial aircraft (and as such gives a glimpse on GDP-related business investments). The ECB in Europe released its fourth-quarter Bank Lending Survey, offering some last-minute input to Thursday’s policy meeting. Banks reported a renewed net tightening of credit standards for company loans. The most pronounced tightening since 2023Q3 was driven by higher perceived risks related to the economic outlook and a lower risk tolerance, especially in France and Germany. Both suffered from heightened political uncertainty during the survey’s reference period. Banks expect a further tightening of standards in 2025Q1. Credit standards for household loans for house purchases were more or less unchanged after three quarters of easing with increased competition offsetting a lower risk tolerance. On the demand side, firms’ net demand for loans continued to increase but remained weak overall with little improvement expected in the running quarter. Demand for housing loans increased strongly again whereas other consumer credit demand picked up, be it only slightly. Both were supported by declining interest rates.
Currency markets are more or less a reversal of yesterday. The US dollar prints some of the biggest gains whereas JPY and CHF take a breather. Dollar strength was inspired by early-morning comments from president Trump. Treasury Secretary Bessent in the Financial Times is said to favour a step-by-step tariff approach, applying a 2.5% universal levy that increases by the same amount each month. Trump responded he wants “much bigger” tariffs than that. EUR/USD stumbles towards 1.043 & DXY tried to take out 108. USD/JPY is back above 155. Sterling is on track for a four-day winning streak. EUR/GBP tested support around 0.838.
News & Views
French consumer confidence rose from 89 to 92 in January, the highest level since October. Details showed consumers turning less pessimistic on their (future) personal financial situation and the standard of living. The reversal of some of the initial 2025 budget proposals played a role here. New PM Bayrou will likely face a no-confidence vote linked to that budget as soon as next week. In a similar vein, they turned slightly more optimistic on the likelihood of future unemployment (47 from 54). Indicators measuring savings capacity and purchasing opportunities remained unchanged.
The Hungarian central bank kept its policy rate as expected unchanged at 6.5% and vowed to keep it that way for a sustained period. Hungarian inflation rose more than expected in December (4.6% Y/Y) and will continue to rise in January. The MNB flags an increased risk of a higher inflation path this year with CPI returning to the tolerance band later than projected in the December inflation report. The council closely monitors pricing decisions in the services sector while household inflation expectations have been on an upward trend since July. Anchoring inflation expectations, preserving financial market stability, and a disciplined monetary policy are crucial for the consumer price index to return to the central bank target in a sustained manner. The MNB also calls for disciplined budget deficit targets to help improve Hungary’s risk perception. A careful and patient approach to monetary policy remains warranted. In the Council’s assessment, geopolitical tensions, a volatile financial market environment, and risks to the outlook for inflation warrant the maintenance of tight monetary conditions. They by far outweigh downside risks to the economy. On FX markets, the bottom below the Hungarian forint (EUR/HUF 415) is becoming stronger. The pair is trying to paint a technical double top with neckline support located around 406.50. A break below would improve the short term technical picture of the forint.